 Open Access Article
Crystal structure, quantum chemical insights, and molecular docking studies of Naryl-2-(N-disubstituted) acetamide compounds: potential inhibitors for neurodegenerative enzymes†
Lorena Camargo-Ayala*a,
Mauricio Bedoya bc,
Luis Prent-Peñalozad,
Efraín Polo-Cuadrado
 a,
Edison Osorio
 e,
Iván Brito
 f,
Gerzon E. Delgadofg,
Wendy Gonzálezhi and
Margarita Gutierrez
 *a
*a
aLaboratorio Síntesis Orgánica y Actividad Biológica (LSO-Act-Bio), Instituto de Química de Recursos Naturales, Universidad de Talca, Casilla 747, Talca 3460000, Chile. E-mail: loreca17@gmail.com
bCentro de Investigación de Estudios Avanzados del Maule (CIEAM), Vicerrectoría de Investigación y Postgrado, Universidad Católica del Maule, Talca 3466706, Chile. E-mail: mgutierrez@utalca.cl
cLaboratorio de Bioinformática y Química Computacional (LBQC), Departamento de Medicina Traslacional, Facultad de Medicina, Universidad Católica del Maule, Talca 3466706, Chile
dDepartamento de Ciencias Químicas, Facultad de Ciencias Exactas, Universidad Andrés Bello, Quillota 980, Viña del Mar, Chile
eFacultad de Ciencias Naturales y Matemáticas, Universidad de Ibagué, Carrera 22 Calle 67, Ibagué 730001, Colombia
fDepartamento de Química, Facultad de Ciencias B, á, sicas, Universidad de Antofagasta, Campus Coloso, Antofagasta 02800, Chile
gDepartamento de Química, Facultad de Ciencias, Universidad de Los Andes, Mérida 5101, Venezuela
hCentro de Bioinformática y Simulaciones Moleculares (CBSM), Universidad de Talca, Casilla 747, Talca 3460000, Chile
iFacultad de Ingeniería and Millennium Nucleus of Ion Channels-Associated Diseases (MiNICAD), Universidad de Talca, 3460000 Talca, Chile
First published on 9th February 2024
Abstract
The increase in and concern about neurodegenerative diseases continue to grow in an increasingly long-lived world population. Therefore, the search for new drugs continues to be a priority for medicinal chemistry. We present here the synthesis of a series of compounds with acetamide nuclei. Their structures were established using UV-Visible, NMR, HRMS and IR techniques. Furthermore, we report the crystal structures that were obtained from compounds 5a–5d by X-ray diffraction. The compounds were evaluated as potential inhibitors of the monoxidase enzymes; A (MAO-A) and B (MAO-B), and cholinesterases; acetylcholinesterase (AChE) and butyrylcholinesterase (BChE) through in silico studies using the induced fit docking (IFD) method and binding free energy (ΔGbind) calculations by the MMGBSA method. Interestingly, compounds 5b, 5c and 5d showed much better ΔGbind than the reference drug Zonisamide. Compound 5c is the best in the series, which indicates a potential selective affinity of our compounds against MAO-B, which could be a promising finding in the search for new drugs for Parkinson's disease treatment. The acetamide crystal exhibits moderate NLO properties suggesting that it could be considered a potential candidate for application in nonlinear optical devices.
1 Introduction
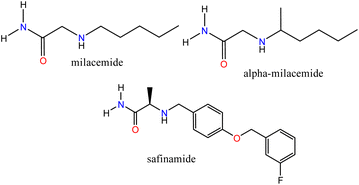
Bioinformatics tools have enabled the description of biological processes through simulations that offer a molecular view of ligand–receptor interactions, providing helpful information for the design and synthesis of new compounds. In addition, with an increasingly aging world population, different types of diseases, including some neurodegenerative disorders, have become significant challenges for medical science that require the use of novel strategies for drug design. Neurodegenerative diseases such as Parkinson's disease (PD) and Alzheimer's disease (AD) still lack safe and efficient treatments.1,2 Some pharmacological targets such as; monoamine oxidase (A:MAO-A and B:MAO-B), whose inhibitors have been used for the treatment of psychiatric and neurological disorders, respectively,3 and cholinesterases; butyrylcholinesterase (BChE) and acetylcholinesterase (AChE) associated with AD4 have been identified. MAO-B is involved with the breakdown of dopamine, a neurotransmitter related to PD.5 The molecular elucidation and the identification of the active sites of these enzymes have allowed us to determine how some ligands can modulate them successfully, which allows us, through a well-founded analysis, to establish the necessary characteristics for the synthesis of new compounds that can interact with these specific targets due to their structural features.Acetamide-type compounds have been shown to be potent modulators of MAO-A, MAO-B, AChE, and BChE. Recently, a potent and selective MAO-A inhibitor (50 times more selective over MAO-A) was reported, N-[5-(acetyloxy)-2-(4-chlorophenyl)-4-oxo-4,5-dihydropyrazolo[1,5-a]quinoxalin-7-yl]acetamide, the compound showed an IC50 value of 0.028 μM.6 On the other hand, milacemide and its structural modifications; alpha-milacemide or safinamide (Fig. 1), are inhibitors of the enzyme MAO-B, which plays an important role in the exacerbation of PD.7,8 In addition, triazole derivative compounds linked to benzothiazole through an acetamide linker,9 naphthoquinone conjugated to aryltriazole acetamide derivatives10 and the compound N-(naphthalen-1-yl)-2-(piperidin-1)-acetamide,11 recently reported by our group, have shown inhibitory activity against AChE and/or BChE. Furthermore, in recent studies, it has been reported that a series of compounds (R)-N-(benzo[d]thiazol-2-yl)-2-(1-phenyl-3,4-dihydroisoquinolin-2(1H)-yl)acetamide showed potent specific inhibitory polypharmacological activity against MAO-B and BChE.12
Different synthesis strategies have been proposed to obtain amides. The classic strategies, such as; the reaction between the carboxylic acid and the amine,13 or seeking to avoid the acid-base balance, the formation of salts and improve yields, the synthesis from the acyl chloride, which requires a previous synthetic step for the formation of the halide and strong conditions due to its reactivity.14 Other synthetic strategies involve the activation of the acid for the coupling with the amine using a coupling reagent. These reagents, such as carbodiimides, have proven efficient for forming amides,15 resulting in amidations with high yield and selectivity.16 The most widely used carbodiimides industrially are DCC (N,N′-dicyclohexylcarbodiimide, DIC (N,N′-diisopropylcarbodiimide), and EDC (1-ethyl-3-(3′-dimethylaminopropyl)carbodiimide hydrochloride).16
However, the choice of the coupling reagent must consider some limitations; for example, the use of DCC generates as a by-product N,N′-dicyclohexylurea, which is insoluble in water, and although it can be removed by filtration, it has been shown to be challenging to remove from reactions in solution because small traces remain, even after purification by column chromatography.17 These last typical drawbacks of DCC are mostly overcome when DIC is used as a coupling reagent.18 Another alternative is the use of EDC, which generates water-soluble urea as a by-product that is easy to eliminate. However, it has a high cost, which makes it challenging to access.16 DIC is more accessible and has shown better yields in some reactions compared to EDC.19 In this context, a series of acetamide compounds, their synthesis, crystal structure and computational studies are presented here to describe their possible activity against MAO-A, MAO-B, AChE and BChE enzymes.
2 Results and discussion
2.1 Chemistry
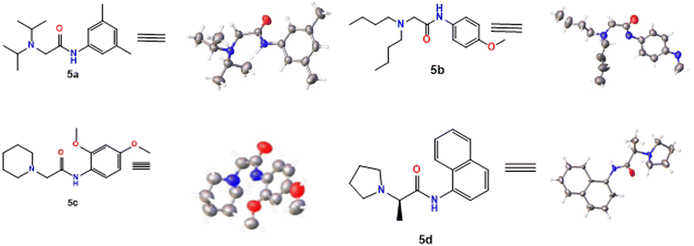
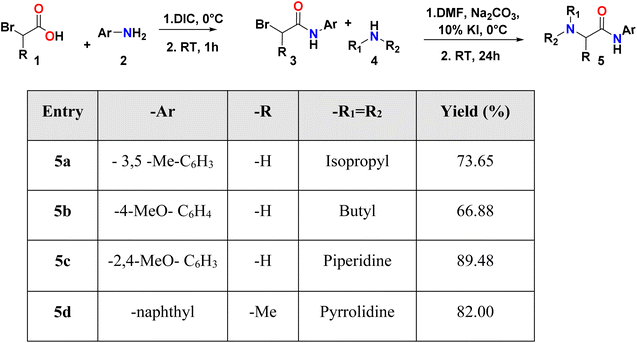
Initially, compounds 5a–5d were synthesized in two reaction steps. Thus, reagents 1 (carboxylic acid) and 2 (aromatic amine) were combined to generate compound 3, for which DIC was used as the coupling reagent. Product 3 was purified and dried. The next stage consisted of the reaction between the product obtained in the first phase and 4 (aliphatic amine) to obtain compounds 5a–5d. Finally, the compounds were purified by column chromatography using ethyl acetate:petroleum ether mixtures as eluant and left in solution to evaporate to crystals. The compounds were obtained with moderate to good yields (Table 1).2.2 X-ray diffraction measurements
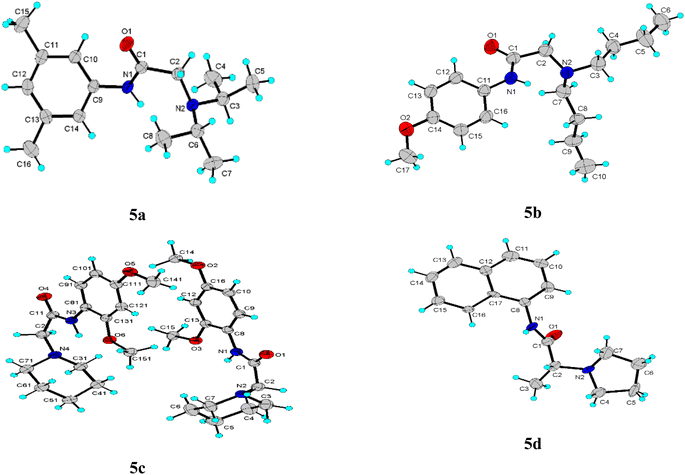
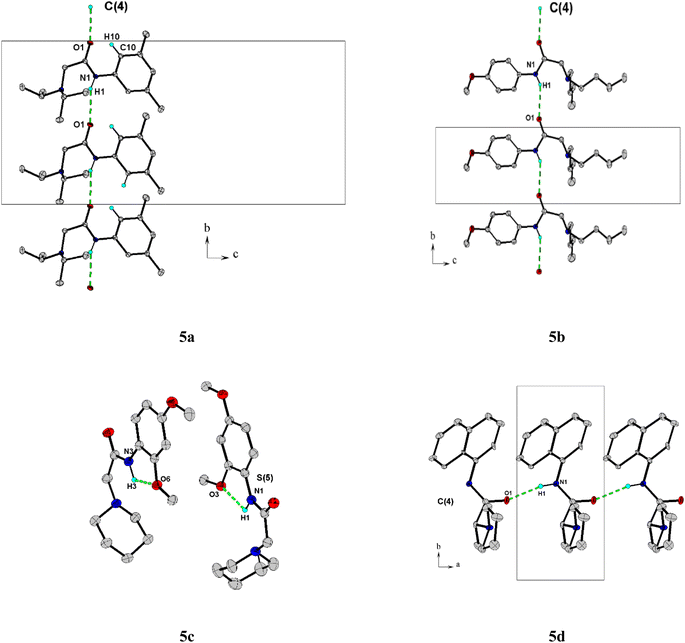
The title compounds crystallized with orthorhombic (5a) and monoclinic symmetry (5b–5d), respectively, with one or two (5c) independent molecules in the asymmetric unit. Fig. 2 shows the molecular conformation and atom labeling of the asymmetric unit in the title compounds. In the structures, all bond distances and angles are normal20 and agree with the average values in similar entries found in the Cambridge Structural Database CSD, version 5.43, November 2022.21 As expected, the amide bond in the molecules is nearly planar and trans-configurated.The molecular structure and crystal packing of all molecules are stabilized by intermolecular N–H⋯O hydrogen bonds (Table 2). For 5a, 5b, infinite one-dimensional chains are formed along [010] direction, and for 5d the chains run along [001] direction. These chains are parallel to each other (Fig. 3), which can be described in graph-set notation as C(4).22 For 5c, each independent molecule form intramolecular bonds with graph-set notation S(5). All crystal structures remain united due to van der Waals forces.
| Compound | D–H⋯A | D–H | H⋯A | D⋯A | D–H⋯A | Symmetry |
|---|---|---|---|---|---|---|
| 5a | N1–H1⋯O1 | 0.860 | 2.400 | 3.179(2) | 152.0 | 1/2 − x, −1/2 + y, z |
| 5b | N1–H1⋯O1 | 0.860 | 2.450 | 3.211(2) | 148.0 | x, −1 + y, z |
| 5c | N3–H3⋯O6 | 0.830 | 2.110 | 2.576(2) | 107.0 | x, y, z |
| 5d | N1–H1⋯O1 | 0.860 | 2.030 | 2.88(2) | 167.0 | −1 + x, y, z |
Table 3 summarizes both compounds' crystal data, intensity data collection, and refinement details. X-ray crystal structure determinations, CIF files containing tables of crystallographic parameters, bond lengths, and bond angles, as well as a list of structure factors have been deposited in the Cambridge Crystallographic Data center (CCDC no. 2211917, 2211918, 2238258, and 2238259). They are freely available upon request from the following website: http://www.ccdc.cam.ac.uk/data_request/cif.
| Compound | 5a | 5b | 5c | 5d |
|---|---|---|---|---|
| CCDC number | 2![[thin space (1/6-em)]](https://www.rsc.org/images/entities/char_2009.gif) 211 211![[thin space (1/6-em)]](https://www.rsc.org/images/entities/char_2009.gif) 918 918 |
2![[thin space (1/6-em)]](https://www.rsc.org/images/entities/char_2009.gif) 211 211![[thin space (1/6-em)]](https://www.rsc.org/images/entities/char_2009.gif) 917 917 |
2![[thin space (1/6-em)]](https://www.rsc.org/images/entities/char_2009.gif) 238 238![[thin space (1/6-em)]](https://www.rsc.org/images/entities/char_2009.gif) 259 259 |
2![[thin space (1/6-em)]](https://www.rsc.org/images/entities/char_2009.gif) 238 238![[thin space (1/6-em)]](https://www.rsc.org/images/entities/char_2009.gif) 258 258 |
| Empirical formula | C16H26N2O | C17H28N2O2 | C30H44N4O6 | C17H17N2O |
| Formula weight | 262.39 | 292.41 | 556.69 | 265.32 |
| Temperature/K | 298 | 298 | 298 | 298 |
| Crystal system | Orthorhombic | Monoclinic | Monoclinic | Monoclinic |
| Space group | Pbca | P21/n | P21/c | P21 |
| a/Å | 14.1335(11) | 15.9867(9) | 7.1033(4) | 4.763(7) |
| b/Å | 10.5456(7) | 5.3642(3) | 23.7608(14) | 10.544(16) |
| c/Å | 22.1248(17) | 21.1924(11) | 18.3655(11) | 15.14(2) |
| β/° | — | 103.788(2) | 93.527(4) | 96.49(4) |
| Volume/Å3 | 3297.6(4) | 1765.00(17) | 3093.9(3) | 756(2) |
| Z | 8 | 4 | 4 | 2 |
| ρcalcg/cm3 | 1.057 | 1.100 | 1.195 | 4.763(7) |
| μ/mm 1 | 0.066 | 0.072 | 0.678 | 0.074 |
| F(000) | 1152 | 640 | 1200.0 | 288 |
| Crystal size/mm3 | 0.14 × 0.22 × 0.32 | 0.16 × 0.24 × 0.40 | 0.14 × 0.18 × 0.35 | 0.15 × 0.20 × 0.30 |
| Radiation | MoKα (λ = 0.71073) | MoKα (λ = 0.71073) | CuKα (λ = 1.54178) | MoKα (λ = 0.71073) |
| Flack | — | — | — | −0.6(1) |
| 2Θ range for data collection/° | 5.16 to 61.072 | 5.248 to 58.302 | 8.87 to 150.136 | 2.7 to 26.5 |
| Index ranges | −20 ≤ h ≤ 20, −15 ≤ k ≤ 14, −31 ≤ l ≤ 31 | −21 ≤ h ≤ 21, −7 ≤ k ≤ 7, −29 ≤ l ≤ 28 | −8 ≤ h ≤ 8, −29 ≤ k ≤ 29, −22 ≤ l ≤ 22 | −5 ≤ h ≤ 5, −12 ≤ k ≤ 13, −18 ≤ l ≤ 18 |
| Reflections collected | 74![[thin space (1/6-em)]](https://www.rsc.org/images/entities/char_2009.gif) 427 427 |
53![[thin space (1/6-em)]](https://www.rsc.org/images/entities/char_2009.gif) 960 960 |
55![[thin space (1/6-em)]](https://www.rsc.org/images/entities/char_2009.gif) 156 156 |
5760 |
| Independent reflections | 5034 [Rint = 0.3243] | 4749 [Rint = 0.0839] | 6289 [Rint = 0.102] | 2031 [Rint = 0.410] |
| Data/restraints/parameters | 5034/0/183 | 4749/0/212 | 6289/0/376 | 2031/0/182 |
| Goodness-of-fit on F2 | 0.860.16 | 1.094 | 1.029 | 0.87 |
| Final R indexes [I ≥ 2σ (I)] | R1 = 0.0670, wR2 = 0.1273 | R1 = 0.0796, wR2 = 0.1952 | R1 = 0.0643, wR2 = 0.2058 | R1 = 0.0847, wR2 = 0.1474 |
| Largest diff. peak/hole/eÅ−3 | 0.18/−0.18 | 0.58/−0.75 | 0.23/−0.17 | 0.16/−0.16 |
2.3 Computational analyses
| Compound | HOMO | LUMO | HOMO–LUMO gap | Chemical hardness (η) | Chemical potential (μ) | Electrophilicity index (ω) | Chemical softness (s) |
|---|---|---|---|---|---|---|---|
| a All values are in eV. | |||||||
| 5a | −7.2309 | 0.5254 | 7.76 | 3.88 | 3.35 | 1.45 | 0.13 |
| 5b | −6.8886 | 0.5703 | 7.46 | 3.73 | 3.16 | 1.34 | 0.13 |
| 5c | −6.6692 | 0.7923 | 7.46 | 3.73 | 2.94 | 1.16 | 0.13 |
| 5d | −7.1087 | −0.5929 | 6.52 | 3.26 | 3.85 | 2.28 | 0.15 |
| Compounds | μ (D) | α (×10−24 esu) | β (×10−30 esu) | γ (×10−36 esu) |
|---|---|---|---|---|
| 5a | 4.202 | 31.046 | 1.891 | 27.477 |
| 5b | 6.330 | 30.229 | 4.920 | 28.676 |
| 5c | 5.332 | 33.760 | 4.737 | 30.277 |
| 5d | 3.687 | 32.329 | 3.444 | 31.798 |
| Urea | 3.875 | 4.823 | 0.414 | 2.941 |
| CNPA acetamide as reference23 | 2.490 | 24.081 | 1.721 | 16.179 |
The ΔGbind obtained by MMGBSA method is shown in Table 7with the reference ligands in each system. The ΔGbind values for the compounds studied in MAO-A are less negative than the reference ligand (harmine), indicating that they are potentially less active than the harmine compound.
| Compound | ΔGbind (kcal mol−1) | |||
|---|---|---|---|---|
| MAO-A | MAO-B | AChE | BChE | |
| 5a | −67.43 | −54.81 | −71.24 | −58.30 |
| 5b | −73.25 | −72.50 | −68.49 | −42.94 |
| 5c | −61.89 | −74.53 | −65.35 | −55.48 |
| 5d | −64.83 | −72.72 | −78.38 | −68.75 |
| Harmine | −80.49 | — | — | — |
| Zonisamide | — | −34.73 | — | — |
| Huprine W | — | — | −114.13 | |
| Tacrine | — | — | — | −69.82 |
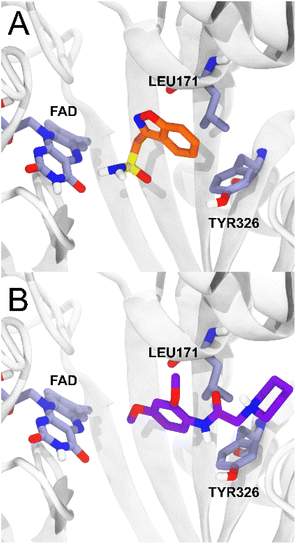
For MAO-B, on the other hand, the ligands studied present a range of ΔGbind values (−54.81; −74.53 kcal mol−1) more negative than the reference ligand zonisamide (−34.73 kcal mol−1), which makes them potentially more affine than zonisamide, with 5c being the ligand with the highest probability of having an action on MAO-B. The compounds studied presented less negative ΔGbind values in AChE with respect to the huprine-W compound, however, compound 5d presented a ΔGbind value of −68.75 in BChE, quite close to the energetic value of the tacrine compound. As reported for the MAO-B – zonisamide complex, compound 5c also has no direct interaction with the FAD cofactor and furthermore maintains two important hydrophobic interactions with residues TYR326 and LEU171.26 Zonisamide interacts with its benzyl group while 5c interacts with the aromatic ring that is oriented in the same plane as the benzyl moiety of zonisamide, retaining the same hydrophobic interactions (Fig. 6).
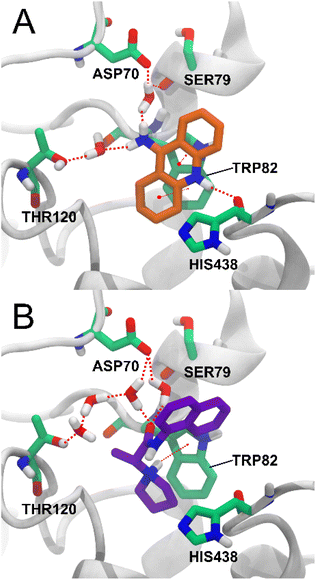
Among the key interactions between tacrine and BChE are a π–π stacking interaction between the aromatic ring of tacrine and residue TRP82, a hydrogen bond between the NH group of tacrine and the carbonyl of residue HIS438, and a hydrogen bond between the amino group of tacrine and two water molecules that simultaneously form hydrogen bonds with ASP70, SER79 and THR120.27 Of these interactions, compound 5d also forms a π – cation interaction with residue TRP82 with the charged amino group of 5d and forms a water bridge network between the carbonyl group and the residues ASP70 and THR120. The interaction with residue THR120 is not via a single water molecule as in tacrine but via three water molecules (Fig. 7). Water-mediated hydrogen bonding networks have been shown to be crucial in ligand–protein interactions, but their stability and the effect of their displacement are difficult to determine.30 Therefore, the interaction between compound 5d and THR120 mediated by 3 water molecules may not be stable or strong enough.
3 Conclusions
In summary, we synthesized compounds with acetamide nuclei through coupling reagents. The products were obtained with moderate to good yields with high purity. The compounds were elucidated by NMR (1H and 13C), IR, HRMS and X-ray crystallography. The crystals of compounds 5a, 5b, 5c and 5d showed a monoclinic and orthorhombic system in which the amide bond in the molecules is almost flat and trans-configured, stabilized by hydrogen bonds. The in silico analyses of the compounds as biological inhibitors against MAO-A, MAO-B, AChE and BChE did not show a better affinity for the MAO-A, AChE and BChE enzymes than the drugs used as a reference, except for compound 5d. which showed interactions and affinity similar to tacrine (reference drug used for BChE); a π – cation interaction with the TRP82 residue and a water bridge network between the carbonyl group and the ASP70 and THR120 residues. All the compounds showed a high affinity for MAO-B as well in the in silico studies, and all the compounds of the series studied presented a range of ΔGbind values more negative than the reference ligand zonisamide, which makes them potentially more related to MAO-B. Compound 5c showed the most negative ΔGbind value (−74.53 kcal mol−1) versus ΔGbind for zonisamide (−34.73 kcal mol−1), which indicates a greater probability of having an action on MAO-B. Molecular docking analysis showed compound 5c tends to be the most related to MAO-B, since it presents similar interactions to zonisamide, maintaining two hydrophobic interactions with residues TYR326 and LEU171 and interacting with the aromatic ring instead of a benzyl group. The in silico analyses suggest that compounds 5a–5d could serve as a scaffold for structural diversification seeking to improve the efficacy of MAO-B enzymatic inhibition. Therefore, the synthesis of compounds 5a–5d becomes an interesting finding in the search for selective drugs for the treatment of the Parkinson's disease.Moreover, based on the magnitude of the hyperpolarizability measurement, we conclude that 5a, 5b, 5c and 5d offers potential applications to the development of materials with NLO properties, making them potentially valuable for applications in advanced optics and photonics. The comparison with urea and CNPA acetamide compounds indicates their potential superiority for certain nonlinear optical applications.
4 Materials and methods
For the reactions, the reagents, solvents, and other materials used were provided by Sigma-Aldrich and Merck. To monitor the reactions, thin layer chromatography (TLC) was used using GF254 silica Al TLC plates. The spots were revealed using a SPECTROLINE MODEL CM-10 camera (254 and 366 nm) and/or developing solutions. For the characterization of the compounds, infrared (IR) spectra (KBr pellets, 500–4000 cm−1) were taken on a NEXUS 670 FT-IR spectrophotometer (Thermo Nicolet, Madison, WI, USA). Nuclear magnetic resonance (NMR) spectra were obtained on a Bruker DPX 400 spectrometer (400 MHz for 1H and 100 MHz for 13C). Samples were dissolved in CDCl3 and tetramethylsilane (TMS) was used to calibrate the signals. The displacement (δ) and coupling constant (J) values are expressed in parts per million (ppm) and Hertz (Hz), respectively. The signals were represented as singlet (s), doublet (d), triplet (t) and multiplet (m). HRMS spectra were performed on a Bruker Compact QqTOF spectrometer. The analysis was performed by direct injection. A 500 μL Hamilton syringe was used for injection, with a flow rate of 2 μL min−1 using the InfusionONE Syringe Pump NE-300. For ionization, an ESI source was used, with a voltage of 4500 V, a gas temperature of 180 °C, flow at 4 L min−1, and a nebulizer at 0.4 bar. The purity of the compounds was verified using high-performance liquid chromatography (HPLC), for which a C-18 reverse phase column LiChroCart 125-4 LiChrospher 100 RP-18 (5 μM) was used. For the mobile phase, two solutions were used; the first (solution A) was a 0.1% solution of trifluoroacetic acid (TFA) in acetonitrile (CH3CN), and the second (solution B) was a 0.1% aqueous TFA mixture. The flow rate was 1 mL min−1, and the chromatograms were acquired at a wavelength of 254 nm. For this, the YL9100 instrument was used with a YL9110 quaternary pump, a YL9150 autosampler, a YL9101 degassing pump, and a photodiode array (PDA) detector. YL9160 (190–400 nm), manufactured by YL INSTRUMENT CO, LTD. The analyzes were performed with the Clarity software version 6.0 of 2012. Melting points (m.p.), uncorrected, were measured on an IA9100 electrothermal apparatus (Stone, Staffs, UK) in triplicate.4.1 Synthesis of compounds 5
The synthesis was carried out in two steps (Scheme 1); in the first step, the amidation was carried out by mixing carboxylic acid (1) (1 mmol, 1 equiv.) in dichloromethane (DCM) at 0 °C with the aromatic amine (2), previously DIC (170.33 μL, 1.1 equiv.) was added to the acid, and it was stirred for 2 minutes. The reaction was followed by TLC and the reaction crude was purified using column chromatography. In the second step, potassium iodide (KI) and sodium car-bonate (Na2CO3) (10 mol% and 1 mmol, 1 equiv.) were add-ed to the amide product (3) and dissolved in DMF at 0 °C. Then, the aliphatic amine (4) (1.3 mmol, 1.3 equiv.) was added in DCM. After 24 h at room temperature, extraction with ethyl acetate (50 mL) was carried out, followed by washings with water, a saturated sodium bicarbonate solution and a saturated sodium chloride solution (20 mL in each case) and subsequently dried with anhydrous Na2SO4. The final prod-ucts (5a–5d) were isolated by column chromatography. For crystallization, the compounds were redissolved in DCM and left to stand in a mixture of DCM![[thin space (1/6-em)]](https://www.rsc.org/images/entities/char_2009.gif) :
:![[thin space (1/6-em)]](https://www.rsc.org/images/entities/char_2009.gif) petroleum ether (1
petroleum ether (1![[thin space (1/6-em)]](https://www.rsc.org/images/entities/char_2009.gif) :
:![[thin space (1/6-em)]](https://www.rsc.org/images/entities/char_2009.gif) 1) for 5a, 5c and 5d, and petroleum ether
1) for 5a, 5c and 5d, and petroleum ether![[thin space (1/6-em)]](https://www.rsc.org/images/entities/char_2009.gif) :
:![[thin space (1/6-em)]](https://www.rsc.org/images/entities/char_2009.gif) ethyl acetate (7
ethyl acetate (7![[thin space (1/6-em)]](https://www.rsc.org/images/entities/char_2009.gif) :
:![[thin space (1/6-em)]](https://www.rsc.org/images/entities/char_2009.gif) 3) for 5b, until the formation of the crystal.
3) for 5b, until the formation of the crystal.
![[thin space (1/6-em)]](https://www.rsc.org/images/entities/char_2009.gif) 250, 2970, 2940, 2860, 2790, 1530, 1490, 770 cm−1; HRMS (ESI, m/z): Calcd for C17H20N2O [M + H]+ 269,1654 found 269.1649; HPLC pureza = 99,0%; % ((Solución A: (TFA 0.01%/acetonitrilo)) y (Solución B: TFA 0.01%), 1 mL min−1, tR = 3.390 min). Yield 82%, White solid, m.p. = 165-166 °C.
250, 2970, 2940, 2860, 2790, 1530, 1490, 770 cm−1; HRMS (ESI, m/z): Calcd for C17H20N2O [M + H]+ 269,1654 found 269.1649; HPLC pureza = 99,0%; % ((Solución A: (TFA 0.01%/acetonitrilo)) y (Solución B: TFA 0.01%), 1 mL min−1, tR = 3.390 min). Yield 82%, White solid, m.p. = 165-166 °C.4.2 X-ray diffraction measurements
Colorless crystals of the title compounds suitable for X-ray diffraction analysis were selected and measured. Diffraction data were collected at 295(2) K on a Bruker D8 Venture diffractometer equipped with a Photon-III C14 detector, using graphite monochromated MoKα (λ = 0.71073 Å) radiation. The diffraction frames were integrated using the APEX4 package31 and were corrected for absorptions with SADABS.32 The crystal structures of the title compounds were solved by intrinsic phasing6 using the OLEX2 software33 and refined with full-matrix least-squares methods based on F2 (SHELXL).34 All the non-hydrogen atoms were refined with anisotropic displacement parameters. The hydrogen atoms were included from calculated positions and refined riding on their respective carbon atoms with isotropic displacement parameters. All geometrical calculations were done using the software Platon.354.3 Computational methods
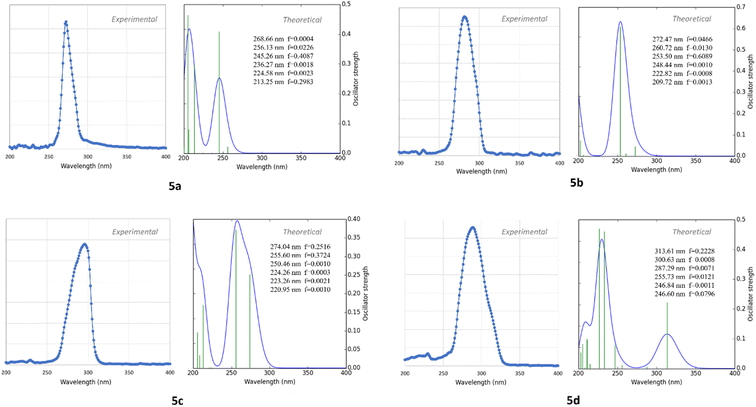
The X-ray diffraction experimental results for 5a–5d compounds were directly taken for initial molecular geometries. The geometry optimizations were carried out using the M062X exchange–correlation functional36 and def2tzvp basis set,37 all in gas phase. M062X is a hybrid meta exchange–correlation functional with double the nonlocal exchange (2X), which is parametrized for nonmetal and long noncovalent range interactions.38 The calculations were performed using Gaussian 09 software.39Optimized structural parameters were used to calculate theoretical electronic spectrum of 5a–5d compounds through the time-dependent density functional theory (TDDFT) calculations40,41 at the B3LYP/def2tzvp level of theory. The methanol solvent effect on the calculated electronic properties of the studied compound was investigated using the polarizable continuum model (PCM).42,43
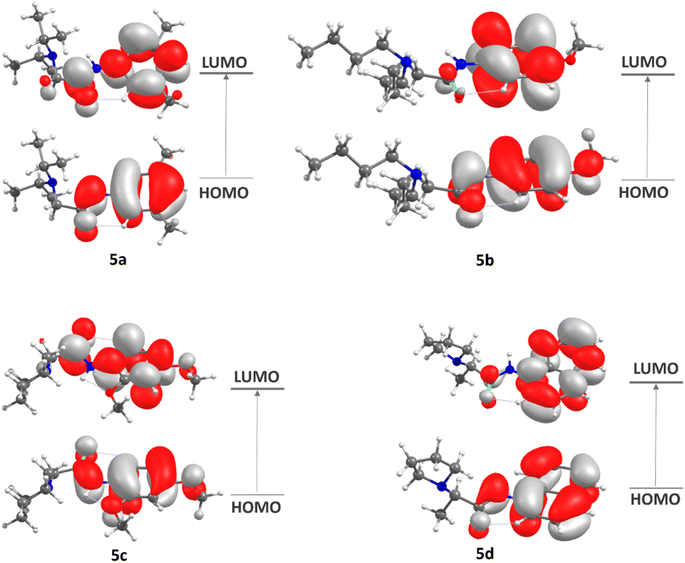
The frontier molecular orbitals (FMOs),44 the highest occupied molecular orbital (HOMO) and lowest unoccupied molecular orbital (LUMO), which account for the ability to donate and accept electrons, were calculated at DFT/M062X/def2tzvp level. Some global reactivity descriptors, such as HOMO–LUMO gap, chemical hardness (η), chemical potential (μ), electrophilicity index (μ), and chemical softness (s), which are based on the HOMO and LUMO energies were studied to measure the stability of synthesized molecules.
The electric dipole moment, linear polarizability, and the first and second hyperpolarizability tensors were evaluated using FF approach to explore the non-lineal optical (NLO) properties of the title compound with a field frequency of 0.0010 au at the DFT/DCAM-B3LYP/6-311G++ (d,p) level. DFT functional has shown results close to CCSD and MP2 methodologies,45,46 showing efficiency and accuracy for calculation of second order hyperpolarizability. In the finite field (FF) method, when a molecule is subjected to a static field (F), the energy (E) of the molecule can be expressed as:
| μ = (μx2 + μy2 + μz2)1/2 |
On the other hand, α corresponds to the linear polarizability tensor, while β and γ are the first and second hyperpolarizability tensors, with i, j, and k as the labels for x, y, and z components, respectively. The tensors equations are given as follows:
| 〈β〉 = [(βxxx + βxyy + βxzz)2 + (βyyy + βyzz + βyxx)2 + (βzzz + βzxy + βzyy)2]1/2 |
Molecular docking calculations were performed to evaluate the potential affinity of the compounds on four different molecular targets; MAO-A, MAO-B, AChE and BChE. Crystallographic structures were obtained from the protein databank47 (Table 6) and prepared using the protein preparation wizard module of the Schrödinger suite.48,49 Hydrogen and missing atoms were added, and amino acid protonation states were assigned at pH 7.0 with PROPKA50 software. The FAD molecule was retained for MAO-A and MAO-B and crystallized water molecules within 5 Å of the FAD cofactor and/or co-crystallized ligands were retained for all systems. Energetic minimization was performed considering the hydrogen atoms only. Prior to molecular docking calculations, the reference ligand was removed from the binding site, but FAD molecules were retained for MAO-A and MAO-B.
The Induced Fit Docking (IFD) protocol51,52 available in the Schrödinger suite was used for molecular docking calculations. The grid center for docking calculations was generated by selecting residues that were within 5 Å of the reference ligand in each system.
Subsequent to the IFD calculations, a re-scoring of the poses was performed with the MMGBSA method to obtain the binding free energy of the complexes. Finally, the pose with the most favorable binding free energy was chosen for all the systems. The protocol was validated by re-docking the co-crystallized reference ligands.
Author contributions
LC-A: investigation, methodology, writing – original draft; MB: computational analyses, methodology, writing – original draft; LP-P: conceptualization, methodology, writing – review & editing; EP-C: conceptualization, writing – original draft IB: Writing – original draft, visualization, software; GE. D: writing – original draft, visualization, software; WG: project administration, resources, supervision, writing – review & editing and MG: project administration, resources, supervision, writing – review & editing.Conflicts of interest
The authors declare that the research was conducted in the absence of any commercial or financial relationships that could be construed as a potential conflict of interest.Acknowledgements
The authors acknowledge the Research Group of the Laboratory of Organic Synthesis and Biological Activity of the University of Talca. ANID National Doctorate Scholarship 2019 Folio No. 21190020. Fondecyt Projects 1200531, 1191133 and 3210529. The authors also acknowledge to FONDEQUIP program (EQM 130021, 160063 and 180024). Gobierno Regional del Maule. FIC-R grant 40.027.577–0. This work was supported by the Universidad de Ibagué Research Fund, Ibague, Colombia, project No. 20-002-INT. FONDECYT-ANID postdoctoral grant No 3210774.References
- P. C. Poortvliet, K. O'Maley, P. A. Silburn and G. D. Mellick, Front. Neurol., 2020, 11, 686 CrossRef
.
- D. L. M. Radder, I. H. Sturkenboom, M. van Nimwegen, S. H. Keus, B. R. Bloem and N. M. de Vries, Int. J. Neurosci., 2017, 127, 930–943 CrossRef PubMed
.
- J. P. M. Finberg and J. M. Rabey, Front. Pharmacol, 2016, 7, 340 CAS
.
- R. T. Bartus, R. L. Dean, B. Beer and A. S. Lippa, Science, 1982, 217, 408–417 CrossRef CAS PubMed
.
- W. Poewe, K. Seppi, C. M. Tanner, G. M. Halliday, P. Brundin, J. Volkmann, A. E. Schrag and A. E. Lang, Nat. Rev. Dis. Primers, 2017, 3, 1–21 Search PubMed
.
- V. A. Panova, S. I. Filimonov, Z. V. Chirkova, M. V. Kabanova, A. A. Shetnev, M. K. Korsakov, A. Petzer, J. P. Petzer and K. Y. Suponitsky, Bioorg. Chem., 2021, 108, 104563 CrossRef CAS PubMed
.
- H. Wasan, D. Singh and R. KH, Brain Res. Bull., 2021, 168, 165–177 CrossRef CAS PubMed
.
- F. Stocchi, A. Antonini, D. Berg, B. Bergmans, W. Jost, R. Katzenschlager, J. Kulisevsky, P. Odin, F. Valldeoriola and K. Ray Chaudhuri, NPJ Parkinson's dis., 2022, 8, 1–9 CrossRef PubMed
.
- D. Mishra, A. Fatima, P. Kumar, N. S. Munjal, B. K. Singh and R. Singh, ChemistrySelect, 2022, 7, 202203060 CrossRef
.
- S. Hosseini, S. A. Pourmousavi, M. Mahdavi and P. Taslimi, J. Mol. Struct., 2022, 1255, 132229 CrossRef CAS
.
- L. Camargo-Ayala, L. Prent-Peñaloza, E. Polo-Cuadrado, I. Brito, J. Cisterna, E. Osorio, W. González and M. Gutiérrez, J. Mol. Struct., 2021, 131544 Search PubMed
.
- W.-H. Liu, L. Guan, D.-H. Zhao, Z.-W. He, Y.-M. Hu, Y.-X. Zhu, L.-J. Zhang, L.-H. Jin, L.-P. Guan and S.-H. Wang, SSRN Electron. J., 2022, 4149179 Search PubMed
.
- V. R. Pattabiraman and J. W. Bode, Nature, 2011, 480, 471–479 CrossRef CAS PubMed
.
- P. W. Seavill and J. D. Wilden, Green Chem., 2020, 22, 7737–7759 RSC
.
- A. Williams and I. T. Ibrahim, Carbodiimide Chemistry: Recent Advances, 1981, 81, 589–636 CAS
.
- J. R. Dunetz, J. Magano and G. A. Weisenburger, Org. Process Res. Dev., 2016, 20, 140–177 CrossRef CAS
.
- A. El-Faham and F. Albericio, Chem. Rev., 2011, 111, 6557–6602 CrossRef CAS
.
- A. Jordan, K. D. Whymark, J. Sydenham and H. F. Sneddon, Green Chem., 2021, 23, 6405–6413 RSC
.
- L. A. Carpino and A. El-Faham, Tetrahedron, 1999, 55, 6813–6830 CrossRef CAS
.
- F. H. Allen, O. Kennard, D. G. Watson, L. Brammer, A. G. Orpen and R. Taylor, J. Chem. Soc., Perkin trans. 2, 1987, S1–S19 RSC
.
- C. R. Groom and F. H. Allen, Angew. Chem., Int. Ed., 2014, 53, 662–671 CrossRef CAS PubMed
.
- J. Bernstein, R. E. Davis, L. Shimoni and N.-L. Chang, Angew. Chem., Int. Ed. Engl., 1995, 34, 1555–1573 CrossRef CAS
.
- B. Narayana, H. S. Yathirajan, R. Rathore and C. Glidewell, Acta Crystallogr., Sect. E: Crystallogr. Commun., 2016, 72, 1270–1275 CrossRef CAS PubMed
.
- S.-Y. Son, J. Ma, Y. Kondou, M. Yoshimura, E. Yamashita and T. Tsukihara, Proc. Natl. Acad. Sci. U. S. A., 2008, 105, 5739–5744 CrossRef CAS PubMed
.
- T. Rahman and M. Rahmatullah, Bioorg. Med. Chem. Lett., 2010, 20, 537–540 CrossRef CAS PubMed
.
- C. Binda, M. Aldeco, A. Mattevi and D. E. Edmondson, J. Med. Chem., 2011, 54, 909–912 CrossRef CAS PubMed
.
- F. Nachon, E. Carletti, C. Ronco, M. Trovaslet, Y. Nicolet, L. Jean and P. Y. Renard, Biochem. J., 2013, 453, 393–399 CrossRef CAS PubMed
.
- C. Ronco, R. Foucault, E. Gillon, P. Bohn, F. Nachon, L. Jean and P.-Y. Renard, ChemMedChem, 2011, 6, 876–888 CrossRef CAS PubMed
.
- M. Ahmed, J. B. T. Rocha, M. Corrêa, C. M. Mazzanti, R. F. Zanin, A. L. B. Morsch, V. M. Morsch and M. R. C. Schetinger, Chem.-Biol. Interact., 2006, 162, 165–171 CrossRef CAS PubMed
.
- I. Lukac, P. G. Wyatt, I. H. Gilbert and F. Zuccotto, J. Comput. Aided Mol. Des., 2021, 35, 1025–1036 CrossRef CAS PubMed
.
- Bruker AXS INC., APEX3, SAINT and SADABS, Bruker AXS Inc., Madison, Wisconsin, USA, 2016 Search PubMed
.
- G. M. Sheldrick, SADABS, Software for Empirical Absorption Corrections, Univ. Göttingen, Göttingen, Germany, 2000 Search PubMed
.
- O. V Dolomanov, L. J. Bourhis, R. J. Gildea, J. A. K. Howard and H. Puschmann, J. Appl. Crystallogr., 2009, 42, 339–341 CrossRef
.
- G. M. Sheldrick, Acta Crystallogr. C Struct. Chem., 2015, 71, 3–8 CrossRef PubMed
.
- A. L. Spek, J. Appl. Crystallogr., 2003, 36, 7–13 CrossRef CAS
.
- R. Krishnan, J. S. Binkley, R. Seeger and J. A. Pople, J. Chem. Phys., 1980, 72, 650–654 CrossRef CAS
.
- A. Hellweg and D. Rappoport, Phys. Chem. Chem. Phys., 2015, 17, 1010–1017 RSC
.
- Y. Zhao and D. G. Truhlar, Theor. Chem. Acc., 2008, 120, 215–241 Search PubMed
.
- G. T. Frisch, H. Schlegel, G. Scuseria, M. Robb, J. Cheeseman, J. Montgomery, T. Vreven,K. Kudin, J. Burant, J. Millam, S. Iyengar, J. Tomasi, V. Barone, B. Mennucci, M. Cossi, G. Scalmani, N. Rega, G. Petersson, H. Nakatsuji, M. Hada, M. Ehara, K. Toyota, R. Fukuda, J. Hasegawa, M. Ishida, T. Nakajima, Y. Honda, O. Kitao, H. Nakai, M. Klene, X. Li, J. Knox, H. Hratchian, J. Cross, V. Bakken, C. Adamo, J. Jaramillo, R. Gomperts, R. Stratmann, O. Yazyev, A. Austin, R. Cammi, C. Pomelli, J. Ochterski, P. Ayala, K. Morokuma, G. Voth, P. Salvador, J. Dannenberg, V. Zakrzewski, S. Dapprich, A. Daniels, M. Strain, O. Farkas, D. Malick, A. Rabuck, K. Raghavachari, J. Foresman, J. Ortiz, Q. Cui, A. Baboul, S. Clifford, J. Cioslowski, B. Stefanov, G. Liu, A. Liashenko, P. Piskorz, I. Komaromi, R. Martin, D. Fox, T. Keith, A. Laham, C. Peng, A. Nanayakkara, M. Challacombe, P. Gill, B. Johnson, W. Chen, M. Wong, C. Gonzalez and J. Pople, Fox, Gaussian 09, Revision A.08, Gaussian, Inc., Wallingford, 2009 Search PubMed
.
- R. Bauernschmitt and R. Ahlrichs, Chem. Phys. Lett., 1996, 256, 454–464 CrossRef CAS
.
- M. E. Casida, C. Jamorski, K. C. Casida and D. R. Salahub, J. Chem. Phys., 1998, 108, 4439–4449 CrossRef CAS
.
- S. Miertuš, E. Scrocco and J. Tomasi, Chem. Phys., 1981, 55, 117–129 CrossRef
.
- J. L. Pascual-ahuir, E. Silla and I. Tuñon, J. Comput. Chem., 1994, 15, 1127–1138 CrossRef CAS
.
- H. Chermette, J. Comput. Chem., 1999, 20, 129–154 CrossRef CAS
.
- Y.-Y. Hu, S.-L. Sun, S. Muhammad, H.-L. Xu and Z.-M. Su, J. Phys. Chem. C, 2010, 114, 19792–19798 CrossRef CAS
.
- H.-B. Zhao, Y.-Q. Qiu, C.-G. Liu, S.-L. Sun, Y. Liu and R.-S. Wang, J. Organomet. Chem., 2010, 695, 2251–2257 CrossRef CAS
.
- H. M. Berman, Nucleic Acids Res., 2000, 28, 235–242 CrossRef CAS PubMed
.
- G. Madhavi Sastry, M. Adzhigirey, T. Day, R. Annabhimoju and W. Sherman, J. Comput. Aided Mol. Des., 2013, 27, 221–234 CrossRef CAS PubMed
.
- N. P. P. W. E. Schrödinger, LLC, New York, NY, Impact, Schrödinger, LLC, New York, NY, Prime, Schrödinger, LLC, New York, 2020 Search PubMed.
- M. H. M. Olsson, C. R. Søndergaard, M. Rostkowski and J. H. Jensen, J. Chem. Theory Comput., 2011, 7, 525–537 CrossRef CAS PubMed
.
- W. Sherman, T. Day, M. P. Jacobson, R. A. Friesner and R. Farid, J. Med. Chem., 2006, 49, 534–553 CrossRef CAS PubMed
.
- N. I. F. D. P. G. Schrödinger, LLC, New York, NY, Impact, Schrödinger, LLC, New York, NY, Prime, Schrödinger, LLC, New York, 2020 Search PubMed.
Footnote |
| † Electronic supplementary information (ESI) available. CCDC 2211917, 2211918, 2238258 and 2238259. For ESI and crystallographic data in CIF or other electronic format see DOI: https://doi.org/10.1039/d3ra08649f |
| This journal is © The Royal Society of Chemistry 2024 |

