 Open Access Article
Coal gasification crude slag based complex flocculants by two-step acid leaching process: synthesis, flocculation and mechanisms
Haoqi Pan,
Chenxu Sun,
Tingting Shen *,
Jing Sun*,
Shaocang He,
Tianpeng Li and
Xuqian Lu
School of Environmental Science and Engineering, Qilu University of Technology (Shandong Academy of Sciences), Jinan 250353, P. R. China. E-mail: shentingting@qlu.edu.cn; sunjing77@qlu.edu.cn
First published on 16th January 2024
Abstract
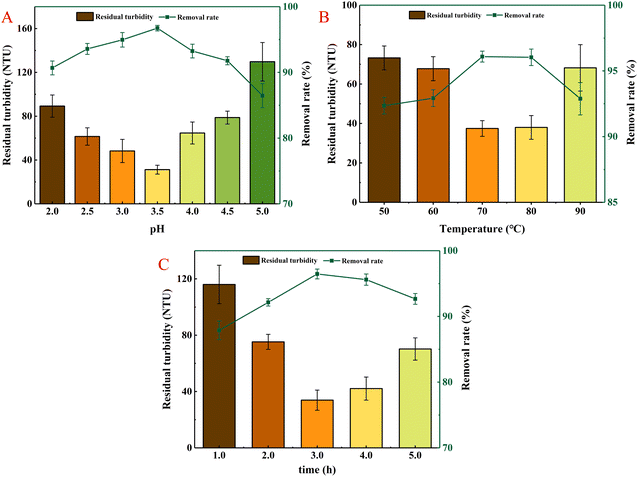
Coal gasification crude slag (CGCS) is the side-product of the coal gasification process, and its effective utilization has attracted great attention. A novel flocculant of poly-aluminum-ferric-acetate-chloride (PAFAC) was synthesized based on the recovery of CGCS by a two-step acid leaching process, namely HCl-acid leaching and HAc-acid leaching, which was optimized by an acid leaching liquor volume ratio of HCl to HAc of 3![[thin space (1/6-em)]](https://www.rsc.org/images/entities/char_2009.gif) :
:![[thin space (1/6-em)]](https://www.rsc.org/images/entities/char_2009.gif) 2, polymerization pH of 3.5, and reaction temperature and time of 70 °C and 3.0 h, respectively. The performance of PAFAC was further evaluated by kaolin simulated wastewater, domestic sewage, river water, and aquaculture wastewater. The results revealed that PAFAC was feasible for the removal of turbidity, chemical oxygen demand (COD) and total phosphorus (TP). Moreover, PAFAC was characterized by X-ray Diffraction (XRD), Fourier transform infrared spectroscopy (FT-IR), X-ray fluorescence spectrometry (XRF) and scanning electron microscopy (SEM), which proved that PAFAC was a kind of amorphous polyionic composite. Additionally, the acid leaching kinetics and flocculation mechanisms were further investigated. It was found that the acid leaching process was followed by the unreacted shrinkage core model, and the flocculation process was dominated by charge neutralization, adsorption bridging and precipitation net trapping. The work is expected to develop a new method for the safe disposal of CGCS and provide a novel way for the preparation of Fe–Al composite flocculants, especially, offering a potential strategy for the promotion of the additional value of the coal chemical industry.
2, polymerization pH of 3.5, and reaction temperature and time of 70 °C and 3.0 h, respectively. The performance of PAFAC was further evaluated by kaolin simulated wastewater, domestic sewage, river water, and aquaculture wastewater. The results revealed that PAFAC was feasible for the removal of turbidity, chemical oxygen demand (COD) and total phosphorus (TP). Moreover, PAFAC was characterized by X-ray Diffraction (XRD), Fourier transform infrared spectroscopy (FT-IR), X-ray fluorescence spectrometry (XRF) and scanning electron microscopy (SEM), which proved that PAFAC was a kind of amorphous polyionic composite. Additionally, the acid leaching kinetics and flocculation mechanisms were further investigated. It was found that the acid leaching process was followed by the unreacted shrinkage core model, and the flocculation process was dominated by charge neutralization, adsorption bridging and precipitation net trapping. The work is expected to develop a new method for the safe disposal of CGCS and provide a novel way for the preparation of Fe–Al composite flocculants, especially, offering a potential strategy for the promotion of the additional value of the coal chemical industry.
1. Introduction
Historically, coal has been China's primary source of energy due to the country's wealthy coal resources and lack of abundant oil and gas. It is foreseeable that the use of coal will continue to dominate China's energy structure for many years to come.1,2 In 2021, China's raw coal production increased by 5.7% over the previous year, reaching a total of 4.13 billion tons. Furthermore, the country's coal consumption saw a rise of 4.6%.3 Therefore, the efficient and clean utilization of coal is particularly important. Coal gasification is one of the core technologies for the efficient and clean utilization of coal,4 and it is also the basis for the synthesis of many chemical products, such as the synthesis of methane,5 methanol6 and dimethyl ether.7 The coal gasification process generates a solid waste, known as coal gasification slag including coal gasification crude slag (CGCS) and coal gasification fine slag (CGFS). It is reported that large quantities of coal gasification slag are discharged each year,8 while its primary disposal methods are landfilling and stacking,9 which will lead to significant waste of land resources, and result in dust10 and heavy metal11 pollution, seriously harming the ecological environment and endangering human life. Thus, finding a practical solution for the disposal of coal gasification slag and its clean and efficient utilization is a challenge that ought to be addressed and developed in the future.At present, the resource utilization of coal gasification slag is mainly focused on the following aspects: (1) production of building materials (e.g. wall material,12 mixed cement,10 aggregates,13 pavement base materials14); (2) soil improvement (e.g. microbial diversity,15 soil conditioner,16 modification the structure of sand for planting17); (3) water remediation (e.g. zeolites,18,19 adsorbent,20 flocculants21); (4) other uses (e.g. plastic fillers,22 cyclic mixing combustion,2 hydrogen production,23 CO2 adsorption24).
As well known, flocculation has been widely used for the treatment of drinking water, domestic sewage and industrial wastewater,25,26 and flocculants play a great role in the flocculation process. Compared to low molecular weight flocculants, polymer flocculants have the advantages of low dosage, fast settling, large flocs and insensitivity to pH in wastewater treatment, so polymer flocculants are currently more widely used in the water treatment process.25 Polymer flocculants are mainly made from expensive chemicals, so the use of solid waste to prepare polymer flocculants is an economical and environmentally friendly path. For example, the application of red mud was challenging due to its complex composition, large specific surface area and high alkalinity.27 Cheng et al.28 prepared polymeric aluminum ferric chloride (PAFC) using acid leaching liquor of hydrochloric acid from red mud. Zhang et al.29 mainly investigated the effect of the Al/Fe ratio of PAFC and alkalinity in the acid leaching liquor of fly ash, which resulted in 96.1% removal efficiency for SS and 91.5% for oil and grease. Recently, coal gasification slag was developed to prepare flocculants due to the abundant compositions of Al2O3 and Fe2O3. He et al.21 developed a one-step acid leaching process using HCl to extract the active components from CGCS and achieved a series of multi-ionic composite coagulants, which showed great coagulation efficiency for the treatment of kaolin simulated wastewater and domestic sewage. However, it was found that the leaching efficiency of CGCS was only about 65%, inhibiting the effective recovery of CGCS. Thus, finding a practical solution for the disposal of coal gasification slag and its clean and efficient utilization is a challenge that ought to be addressed and developed in the future.
It can be seen from the above research that the acid leaching method has a wide range of applications in the study of preparing flocculants from various minerals and solid wastes. However, the shortcomings of the one-step acid method lead to limited acid leaching efficiency, and the flocculation capacity cannot meet high application requirements. Additionally, the addition of chemical agents to modify the flocculant compound is not cost-effective. Therefore, some studies have explored the preparation of composite flocculants using a two-step acid leaching method involving HCl and H2SO4,30 but there are few studies on HCl and HAc. Moreover, HAc is a more environmentally friendly and cheaper acid compared to strong acids. In particular, HAc has a good effect on the leaching of iron, but its leaching ability for aluminum is weak.31 This weakness allows it to play an advantage in adjusting the ratio of iron to aluminum on a macro level. It is expected to provide a potential way to prepare flocculants through the acid leaching process of solid waste recovery.
Therefore, in this work, a two-step acid leaching process, namely HCl-acid leaching and HAc-acid leaching, were initiated to extract effective ingredients from CGCS to overcome the shortcomings of the limited leaching efficiency. Firstly, the processes were optimized by the acid concentration, acid leaching temperature, acid leaching time, and the liquid–solid ratio of acid to CGCS, respectively. Secondly, the two kinds of leaching liquor were mixed under optimal conditions, after a period of aging and drying, forming the flocculant of poly-aluminum-ferric-acetate-chloride (PAFAC). Thirdly, the performance of PAFAC was further evaluated by kaolin simulated wastewater, domestic sewage, river water, and aquaculture wastewater with the removal of turbidity, chemical oxygen demand (COD) and total phosphorus (TP). Moreover, PAFAC was characterized by X-ray Diffraction (XRD), Fourier transform infrared spectroscopy (FT-IR), X-ray fluorescence spectrometer (XRF) and scanning electron microscope (SEM). In addition, the acid leaching kinetics and flocculation mechanisms were further investigated. It is expected to propose a low-cost and high-value method of utilizing CGCS, and offer an environmentally friendly way for the preparation of inorganic polymer flocculants.
2. Materials and methods
2.1 Materials
Hydrochloric acid (HCl) was purchased from Yantai Yuandong Fine Chemicals Co., Ltd (China), sodium hydroxide (NaOH) was purchased from Foshan Xilong Chemical Co., Ltd (China), glacial acetic acid (HAc) and kaolin were both purchased from Sinopharm Chemical Reagent Co., Ltd (China). The CGCS used in this study was provided free of charge by Yankuang National Engineering Research Center of Coal Water Slurry Gasification and Coal Chemical Industry Co., Ltd, (Shandong, China). All reagents were analytically pure and did not require further treatment. All solutions were prepared with deionized water.The domestic sewage and riverwater were provided by the reclaimed water station and Dacheng River located at Qilu University of Technology (Shandong, China), and the aquaculture wastewater was offered by a cow pasture (Shandong, China). The relevant water quality indexes are shown in Table 1.
2.2 Preparation of PAFAC
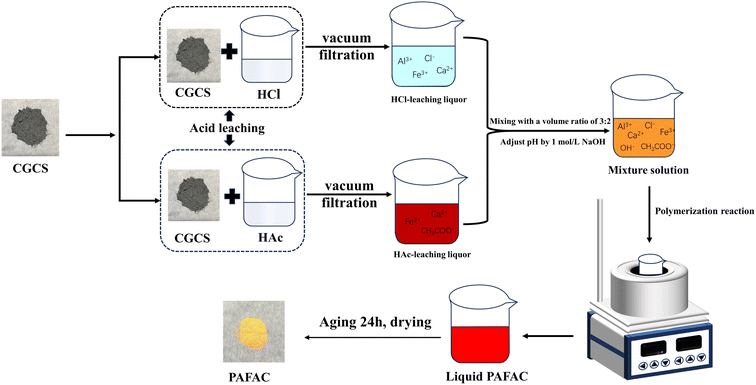
PAFAC was prepared according to the following three steps: HCl-acid leaching process, HAc-acid leaching process and the associative polymerization, which was carried out by a mixture of the leaching liquor of HCl and HAc acid leaching process. The entire process is shown in Fig. 1.![[thin space (1/6-em)]](https://www.rsc.org/images/entities/char_2009.gif) :
:![[thin space (1/6-em)]](https://www.rsc.org/images/entities/char_2009.gif) g) (5
g) (5![[thin space (1/6-em)]](https://www.rsc.org/images/entities/char_2009.gif) :
:![[thin space (1/6-em)]](https://www.rsc.org/images/entities/char_2009.gif) 1, 10
1, 10![[thin space (1/6-em)]](https://www.rsc.org/images/entities/char_2009.gif) :
:![[thin space (1/6-em)]](https://www.rsc.org/images/entities/char_2009.gif) 1, 15
1, 15![[thin space (1/6-em)]](https://www.rsc.org/images/entities/char_2009.gif) :
:![[thin space (1/6-em)]](https://www.rsc.org/images/entities/char_2009.gif) 1, 20
1, 20![[thin space (1/6-em)]](https://www.rsc.org/images/entities/char_2009.gif) :
:![[thin space (1/6-em)]](https://www.rsc.org/images/entities/char_2009.gif) 1, 25
1, 25![[thin space (1/6-em)]](https://www.rsc.org/images/entities/char_2009.gif) :
:![[thin space (1/6-em)]](https://www.rsc.org/images/entities/char_2009.gif) 1). The beaker was sealed with parafilm, put in a thermostat water bath (DF-101S, Gongyi City Yuhua Instrument Co., Ltd, China), and stirred at a set temperature (20, 30, 40, 50, 60 °C) for a period of time (0.5, 1.0, 1.5, 2.0, 2.5 h). It was then filtered and separated by a vacuum filter (SHK-III, Zhengzhou Ketai Laboratory Equipment Co., Ltd, China), and the HCl-leaching liquor was obtained for the preparation of PAFAC. The filtrate residue was repeatedly rinsed with deionized water and then dried and weighed for calculating the leaching rate.
1). The beaker was sealed with parafilm, put in a thermostat water bath (DF-101S, Gongyi City Yuhua Instrument Co., Ltd, China), and stirred at a set temperature (20, 30, 40, 50, 60 °C) for a period of time (0.5, 1.0, 1.5, 2.0, 2.5 h). It was then filtered and separated by a vacuum filter (SHK-III, Zhengzhou Ketai Laboratory Equipment Co., Ltd, China), and the HCl-leaching liquor was obtained for the preparation of PAFAC. The filtrate residue was repeatedly rinsed with deionized water and then dried and weighed for calculating the leaching rate.![[thin space (1/6-em)]](https://www.rsc.org/images/entities/char_2009.gif) :
:![[thin space (1/6-em)]](https://www.rsc.org/images/entities/char_2009.gif) g) (5
g) (5![[thin space (1/6-em)]](https://www.rsc.org/images/entities/char_2009.gif) :
:![[thin space (1/6-em)]](https://www.rsc.org/images/entities/char_2009.gif) 1, 10
1, 10![[thin space (1/6-em)]](https://www.rsc.org/images/entities/char_2009.gif) :
:![[thin space (1/6-em)]](https://www.rsc.org/images/entities/char_2009.gif) 1, 15
1, 15![[thin space (1/6-em)]](https://www.rsc.org/images/entities/char_2009.gif) :
:![[thin space (1/6-em)]](https://www.rsc.org/images/entities/char_2009.gif) 1, 20
1, 20![[thin space (1/6-em)]](https://www.rsc.org/images/entities/char_2009.gif) :
:![[thin space (1/6-em)]](https://www.rsc.org/images/entities/char_2009.gif) 1, 25
1, 25![[thin space (1/6-em)]](https://www.rsc.org/images/entities/char_2009.gif) :
:![[thin space (1/6-em)]](https://www.rsc.org/images/entities/char_2009.gif) 1), and the beaker was sealed with parafilm, put in a thermostat water bath, and stirred at a set temperature (20, 30, 40, 50, 60 °C) for a period of time (0.5, 1.0, 1.5, 2.0, 2.5 h). Afterward, it was filtered and separated by a vacuum filter, and the HAc-leaching liquor was obtained for the preparation of PAFAC. The filtrate residue was repeatedly rinsed with deionized water then dried and weighed, and was used for calculating the leaching rate.
1), and the beaker was sealed with parafilm, put in a thermostat water bath, and stirred at a set temperature (20, 30, 40, 50, 60 °C) for a period of time (0.5, 1.0, 1.5, 2.0, 2.5 h). Afterward, it was filtered and separated by a vacuum filter, and the HAc-leaching liquor was obtained for the preparation of PAFAC. The filtrate residue was repeatedly rinsed with deionized water then dried and weighed, and was used for calculating the leaching rate.![[thin space (1/6-em)]](https://www.rsc.org/images/entities/char_2009.gif) :
:![[thin space (1/6-em)]](https://www.rsc.org/images/entities/char_2009.gif) 1, 3
1, 3![[thin space (1/6-em)]](https://www.rsc.org/images/entities/char_2009.gif) :
:![[thin space (1/6-em)]](https://www.rsc.org/images/entities/char_2009.gif) 1, 2
1, 2![[thin space (1/6-em)]](https://www.rsc.org/images/entities/char_2009.gif) :
:![[thin space (1/6-em)]](https://www.rsc.org/images/entities/char_2009.gif) 1, 3
1, 3![[thin space (1/6-em)]](https://www.rsc.org/images/entities/char_2009.gif) :
:![[thin space (1/6-em)]](https://www.rsc.org/images/entities/char_2009.gif) 2, 1
2, 1![[thin space (1/6-em)]](https://www.rsc.org/images/entities/char_2009.gif) :
:![[thin space (1/6-em)]](https://www.rsc.org/images/entities/char_2009.gif) 1, 2
1, 2![[thin space (1/6-em)]](https://www.rsc.org/images/entities/char_2009.gif) :
:![[thin space (1/6-em)]](https://www.rsc.org/images/entities/char_2009.gif) 3), and the pH was adjusted to a certain value (2.0, 2.5, 3.0, 3.5, 4.0, 4.5, 5.0) with NaOH solution. Then heated and stirred at a set temperature (50, 60, 70, 80, 90 °C) for a period of time (1.0, 2.0, 3.0, 4.0, 5.0 h). After the reaction was completed, the mixture solution was aged for 24 h, then dried in a constant temperature drying oven to synthesize PAFAC, which was ground into powder for use.
3), and the pH was adjusted to a certain value (2.0, 2.5, 3.0, 3.5, 4.0, 4.5, 5.0) with NaOH solution. Then heated and stirred at a set temperature (50, 60, 70, 80, 90 °C) for a period of time (1.0, 2.0, 3.0, 4.0, 5.0 h). After the reaction was completed, the mixture solution was aged for 24 h, then dried in a constant temperature drying oven to synthesize PAFAC, which was ground into powder for use.2.3 Performance investigations on PAFAC
 | (1) |
From the perspective of cost and operation efficiency, the flocculation process was carried out directly under the initial pH of riverwater, domestic sewage and aquaculture wastewater, and the dosage of PAFAC was optimized, respectively. Based on the water quality conditions, the dosage of PAFAC was set as 50, 100, 150, 200, 250, 300 mg L−1 for domestic sewage and 100, 150, 200, 250, 300, 350 mg L−1 for riverwater. As for aquaculture wastewater, the dosage of PAFAC was selected as 2.5, 5.0, 7.5, 10.0, 12.5 g L−1.
2.4 Characterization methods
XRD analysis of PAFAC was conducted on X-ray diffraction (XRD) (D8 Advance, Bruker, Germany). The parameters were set as follows: the test target was a copper target, the scanning speed was 2° min−1, and the 2θ was 5°–80°.XRF analysis was performed on X-ray fluorescence spectrometer (Axios, Panalytical, Netherlands). The CGCS needs to be heated in a Muffle furnace (SX-G07103, Tianjin Zhonghuan Dianlu Instrument Co., Ltd, China) at 815 °C for 1.0 h to remove the carbon in it, and then its composition was determined. The flocculant can be measured directly in the instrument without high temperature calcination.
FT-IR analysis was measured on Fourier transform infrared (VERTEX70, Bruker, Germany). The sample powder was mixed with potassium bromide in a ratio of 1![[thin space (1/6-em)]](https://www.rsc.org/images/entities/char_2009.gif) :
:![[thin space (1/6-em)]](https://www.rsc.org/images/entities/char_2009.gif) 100, and the sample was pressed into thin slices by a tablet press, which can penetrate infrared light. The thin slices were placed into the instrument for measurement. And the scanning range was 5000−1–400−1.
100, and the sample was pressed into thin slices by a tablet press, which can penetrate infrared light. The thin slices were placed into the instrument for measurement. And the scanning range was 5000−1–400−1.
SEM analysis was carried out using scanning electron microscopy (SEM) (TESCAN MIRA LMS, TESCAN, Czech Republic). The sample powder was directly glued to the conductive adhesive and place on the sample table for observation. Magnification was set to 3000×, 5000× and 10![[thin space (1/6-em)]](https://www.rsc.org/images/entities/char_2009.gif) 000×.
000×.
2.5 Mechanisms investigation
When the acid leaching process is controlled by surface chemical reaction, the model can be expressed as:
| 1 − (1 − x)1/3 = K1t | (2) |
When the acid leaching process is controlled by loose layer diffusion, the model can be expressed as:
| 1 − 3(1 − x)2/3 + 2(1 − x) = K2t | (3) |
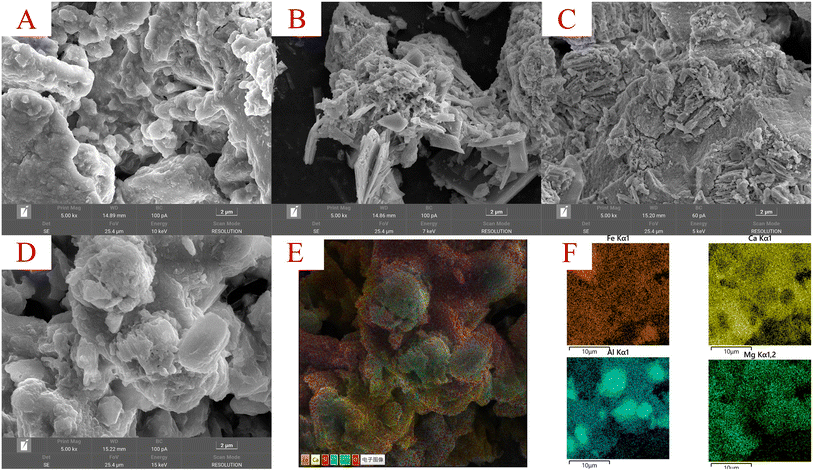
Adsorption bridging was investigated through SEM analysis of flocculants. The flocculants were put into Scanning electron microscopy (SEM) (TESCAN MIRA LMS, TESCAN, Czech Republic) to characterize the surface structure of the flocculants, and SEM images were obtained to analyze the structure of the flocculants and the flocculation mechanism. Magnification was set to 3000×, 5000× and 10![[thin space (1/6-em)]](https://www.rsc.org/images/entities/char_2009.gif) 000×.
000×.
The effect of precipitation net trapping was investigated through microscope image analysis of flocs formed by adding various dosages of PAFAC (50, 100, 150, 200, 250, 300 mg L−1) to domestic sewage (200 mL). At the end of the flocculation process, a small amount of settled floc was taken and the indicative morphology of the floc was observed by an optical microscope (B32, Chongqing OPTEC Instruments, China) with 10× magnification.
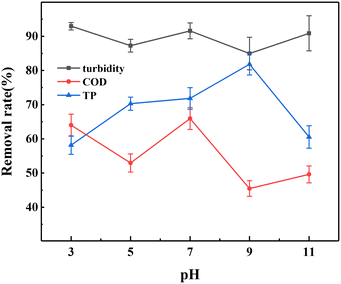
The effect of variation in the pH of domestic sewage on the flocculation efficiency was investigated, which can also show various flocculation mechanisms. The pH of domestic sewage was adjusted to 3.0, 5.0, 7.0, 9.0 and 11.0 by 1.0 mol L−1 NaOH solution and 1.0 mol L−1 HCl solution. Then 250 mg L−1 of PAFAC was injected into 200 mL wastewater of different pH, and the removal rates of turbidity, COD, and TP were calculated after the completion of flocculation to explain the effect of pH of wastewater on flocculation.
3. Results and discussion
3.1 Acid leaching process investigations
As shown in Fig. 2A, when the concentration of HCl solution was increased from 1.0 mol L−1 to 3.0 mol L−1, the leaching efficiency was promoted from 26.74% to 85.76%. As the concentration of acid was increased, the concentration of H+ was continuously increased, which promoted the full reaction with the CGCS, and led to the increase of leaching efficiency. The leaching efficiency remained essentially unchanged after the concentration increased to 4.0 mol L−1 and 5.0 mol L−1, suggesting that a sufficient concentration of H+ was provided at a concentration of 3.0 mol L−1 in the HCl solution. The leaching efficiency increased from 25.77% to 44.32% when the concentration of HAc solution was increased from 2.0 mol L−1 to 5.0 mol L−1 and the elevated concentration of H+ enhanced the efficiency of metal elements leaching. The leaching efficiency was almost unchanged when the concentration was increased to 6.0 mol L−1, indicating that sufficient H+ had been provided at the HAc solution concentration of 5.0 mol L−1. Therefore, for acid leaching of CGCS, the concentration of HCl solution was selected as 3.0 mol L−1 and the concentration of HAc solution was selected as 5.0 mol L−1.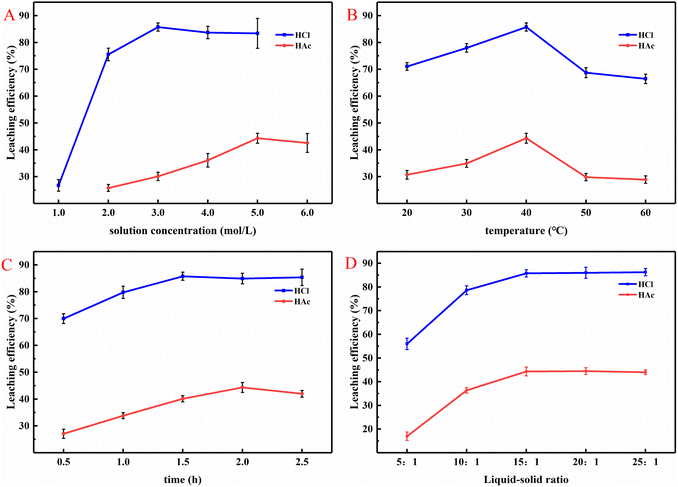 | ||
| Fig. 2 Effect of various acid leaching conditions on acid leaching efficiency. (A) Acid concentration, (B) temperature, (C) time, (D) liquid–solid ratio. | ||
As shown in Fig. 2B, in the range of 20–40 °C, the acid leaching efficiency of HCl and HAc solution increased from 71.07% to 85.76% and 30.70% to 44.32%, respectively, the results indicated that the increasing temperature could improve the efficiency of leaching metal elements from CGCS.36 However, when the temperature was raised to 50 °C, the acid leaching efficiency of HCl and HAc solution was reduced to 68.73% and 29.83%, and at the temperature of 60 °C, the leaching efficiency of HCl and HAc solution was similar to that at 50 °C and also had a weak trend of decline. It was attributed that the final acid leaching liquor would produce colloidal substances, and wrapped in the surface of the CGCS at higher acid leaching temperature, resulting in the difficulty of the solid–liquid separation. On the other hand, the high temperature would make the acid leaching liquor speed up the auto-polymerization reaction, inhibiting the leaching of metal oxides inside CGCS.37 Therefore, considering the leaching efficiency and economic benefits, the optimal acid leaching temperature of both HCl and HAc was selected as 40 °C.
In Fig. 2C, it was found that the acid leaching efficiency of HCl solution increased from 75.28% to 85.76% in the range of 0.5 h to 1.5 h, while the leaching efficiency was almost unchanged when the time was prolonged from 2.0 h to 2.5 h. The acid leaching efficiency increased from 27.04% to 44.32% when HAc acid leaching time was in the range from 0.5 h to 2.0 h. When the time was increased to 2.5 h, the leaching efficiency was almost unchanged. The results showed that the acid leaching reaction had almost reached equilibrium in 1.5 h of HCl-leaching process and 2.0 h of HAc-leaching process, the acid leaching reaction had almost reached equilibrium. With the prolongation of the reaction time, the acid leaching solution would take auto-polymerization,37 leading to the colloidal substances attached to the remaining CGCS, and increasing the difficulty of solid–liquid separation. Therefore, the optimal acid leaching time of HCl and HAc was 1.5 h and 2.0 h, respectively.
In Fig. 2D, when the liquid–solid ratio increased from 5![[thin space (1/6-em)]](https://www.rsc.org/images/entities/char_2009.gif) :
:![[thin space (1/6-em)]](https://www.rsc.org/images/entities/char_2009.gif) 1 to 15
1 to 15![[thin space (1/6-em)]](https://www.rsc.org/images/entities/char_2009.gif) :
:![[thin space (1/6-em)]](https://www.rsc.org/images/entities/char_2009.gif) 1, the leaching efficiencies of HCl and HAc increased from 55.96 to 85.76% and 16.96 to 44.32%, respectively, and then stabilized after increasing the ratio again. It could be found that when the liquid–solid ratio reached 15
1, the leaching efficiencies of HCl and HAc increased from 55.96 to 85.76% and 16.96 to 44.32%, respectively, and then stabilized after increasing the ratio again. It could be found that when the liquid–solid ratio reached 15![[thin space (1/6-em)]](https://www.rsc.org/images/entities/char_2009.gif) :
:![[thin space (1/6-em)]](https://www.rsc.org/images/entities/char_2009.gif) 1, the upper limit of acid leaching efficiency of metal elements had basically been reached, and the H+ in the acid had already been fully utilized.36 So, the optimal liquid–solid ratios for acid leaching of both HCl and HAc were chosen as 15
1, the upper limit of acid leaching efficiency of metal elements had basically been reached, and the H+ in the acid had already been fully utilized.36 So, the optimal liquid–solid ratios for acid leaching of both HCl and HAc were chosen as 15![[thin space (1/6-em)]](https://www.rsc.org/images/entities/char_2009.gif) :
:![[thin space (1/6-em)]](https://www.rsc.org/images/entities/char_2009.gif) 1.
1.
3.2 Preparation of PAFAC
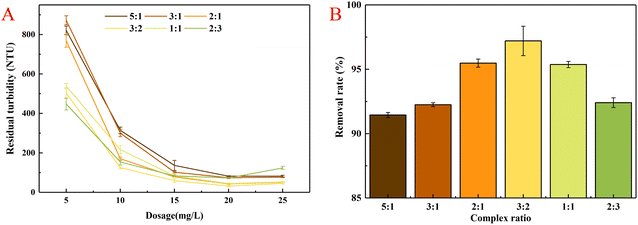
Fig. 3B exhibited the removal efficiency of turbidity of kaolin wastewater by PAFAC with different volume ratios at a flocculant dosage of 20 mg L−1. When the volume ratio increased from 5![[thin space (1/6-em)]](https://www.rsc.org/images/entities/char_2009.gif) :
:![[thin space (1/6-em)]](https://www.rsc.org/images/entities/char_2009.gif) 1 to 3
1 to 3![[thin space (1/6-em)]](https://www.rsc.org/images/entities/char_2009.gif) :
:![[thin space (1/6-em)]](https://www.rsc.org/images/entities/char_2009.gif) 2, the residual turbidity was reduced from 53.64 NTU to 28.66 NTU, and the removal efficiency was increased from 93.90% to 97.01%. As the HAc-leaching liquor continued to increase, the volume ratio decreased from 3
2, the residual turbidity was reduced from 53.64 NTU to 28.66 NTU, and the removal efficiency was increased from 93.90% to 97.01%. As the HAc-leaching liquor continued to increase, the volume ratio decreased from 3![[thin space (1/6-em)]](https://www.rsc.org/images/entities/char_2009.gif) :
:![[thin space (1/6-em)]](https://www.rsc.org/images/entities/char_2009.gif) 2 to 2
2 to 2![[thin space (1/6-em)]](https://www.rsc.org/images/entities/char_2009.gif) :
:![[thin space (1/6-em)]](https://www.rsc.org/images/entities/char_2009.gif) 3. The residual turbidity increased to 151.91 NTU and the removal efficiency decreased to 84.15%. The optimal volume ratio of 3
3. The residual turbidity increased to 151.91 NTU and the removal efficiency decreased to 84.15%. The optimal volume ratio of 3![[thin space (1/6-em)]](https://www.rsc.org/images/entities/char_2009.gif) :
:![[thin space (1/6-em)]](https://www.rsc.org/images/entities/char_2009.gif) 2 was chosen for the preparation of PAFAC.
2 was chosen for the preparation of PAFAC.
3.3 Characterization of PAFAC
Tables 2 and 3 are the component analysis results of CGCS and PAFAC by XRF, respectively. As depicted in Table 2, it could be seen that CGCS was mainly composed of SiO2, Fe2O3, Al2O3, and CaO. The results revealed that CGCS had the effective ingredients for flocculant preparation.| Samples | Component analysis | ||||||||||
|---|---|---|---|---|---|---|---|---|---|---|---|
| SiO2 | Fe2O3 | Al2O3 | CaO | Na2O | SO3 | TiO2 | K2O | MgO | BaO | Others | |
| Content (%) | 42.95 | 15.26 | 16.47 | 17.26 | 2.52 | 1.65 | 1.11 | 0.97 | 0.58 | 0.26 | 0.97 |
| Samples | Component analysis | |||||||||
|---|---|---|---|---|---|---|---|---|---|---|
| Fe | Al | Ca | Si | K | Mg | Ti | Na | Cl | Others | |
| Content (%) | 13.95 | 7.58 | 11.79 | 5.89 | 1.21 | 0.74 | 0.39 | 14.24 | 42.08 | 2.13 |
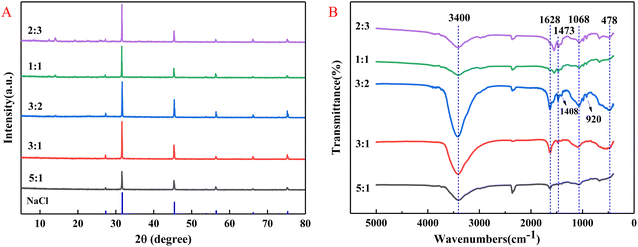
Table 3 showed that PAFAC was a polyionic composite flocculant including Fe, Al, and Ca. The existence of Na came from NaOH that was utilized to adjust pH during the preparation process and formed NaCl crystal with Cl− of HCl, which is also presented in the XRD patterns of Fig. 5A. According to Tables 2 and 3, the metal elements in the CGCS had been leached out by HCl solution and HAc solution effectively.
In Fig. 5A, only the diffraction peak of NaCl was observed when the volume ratio was in the range from 5![[thin space (1/6-em)]](https://www.rsc.org/images/entities/char_2009.gif) :
:![[thin space (1/6-em)]](https://www.rsc.org/images/entities/char_2009.gif) 1 to 3
1 to 3![[thin space (1/6-em)]](https://www.rsc.org/images/entities/char_2009.gif) :
:![[thin space (1/6-em)]](https://www.rsc.org/images/entities/char_2009.gif) 2. The results revealed that PAFAC might be a kind of amorphous polymer. With the further increase of the HAc-leaching liquor, namely the volume ratio reached 1
2. The results revealed that PAFAC might be a kind of amorphous polymer. With the further increase of the HAc-leaching liquor, namely the volume ratio reached 1![[thin space (1/6-em)]](https://www.rsc.org/images/entities/char_2009.gif) :
:![[thin space (1/6-em)]](https://www.rsc.org/images/entities/char_2009.gif) 1 and 2
1 and 2![[thin space (1/6-em)]](https://www.rsc.org/images/entities/char_2009.gif) :
:![[thin space (1/6-em)]](https://www.rsc.org/images/entities/char_2009.gif) 3, it was found that some stray peaks appeared in the range of 10°–30°, which indicated that the addition of too much HAc leaching liquor would lead to the precipitation of some crystalline salts and thus reduce the flocculation efficiency. The result was in good agreement with the results described in Fig. 3.
3, it was found that some stray peaks appeared in the range of 10°–30°, which indicated that the addition of too much HAc leaching liquor would lead to the precipitation of some crystalline salts and thus reduce the flocculation efficiency. The result was in good agreement with the results described in Fig. 3.
FT-IR spectra of PAFAC with different volume ratios were demonstrated in Fig. 5B. The bands at 3400 cm−1 and 1628 cm−1 could attributed to the OH− vibration of Al–OH, Fe–OH and H–OH.43 The peaks intensity reached the maximum at the volume ratio of 3![[thin space (1/6-em)]](https://www.rsc.org/images/entities/char_2009.gif) :
:![[thin space (1/6-em)]](https://www.rsc.org/images/entities/char_2009.gif) 2. The results suggested that the amount of ligand water of Al–Fe hydroxylated copolymers in PAFAC reached the maximum, the strongest bonding interactions with the central ions after transformation into structured water, which was one of the reasons why PAFAC achieved the best flocculation efficiency at a ratio of 3
2. The results suggested that the amount of ligand water of Al–Fe hydroxylated copolymers in PAFAC reached the maximum, the strongest bonding interactions with the central ions after transformation into structured water, which was one of the reasons why PAFAC achieved the best flocculation efficiency at a ratio of 3![[thin space (1/6-em)]](https://www.rsc.org/images/entities/char_2009.gif) :
:![[thin space (1/6-em)]](https://www.rsc.org/images/entities/char_2009.gif) 2.44 A weaker characteristic peak at 920–1068 cm−1 might be assigned to the stretching vibration of Fe–O–Fe and Al–O–Al bonds.45 The bands of 478 cm−1–515 cm−1 could be the bending vibrations of Fe–O and Al–O.46 The appearance of the characteristic peak at 1473 cm−1 could be due to the asymmetric scaling of the carboxylate group (–COO−). The intensity of this peak increased significantly with the increase of HAc-leaching liquor compared to that occurred at the volume ratios of 5
2.44 A weaker characteristic peak at 920–1068 cm−1 might be assigned to the stretching vibration of Fe–O–Fe and Al–O–Al bonds.45 The bands of 478 cm−1–515 cm−1 could be the bending vibrations of Fe–O and Al–O.46 The appearance of the characteristic peak at 1473 cm−1 could be due to the asymmetric scaling of the carboxylate group (–COO−). The intensity of this peak increased significantly with the increase of HAc-leaching liquor compared to that occurred at the volume ratios of 5![[thin space (1/6-em)]](https://www.rsc.org/images/entities/char_2009.gif) :
:![[thin space (1/6-em)]](https://www.rsc.org/images/entities/char_2009.gif) 1 and 3
1 and 3![[thin space (1/6-em)]](https://www.rsc.org/images/entities/char_2009.gif) :
:![[thin space (1/6-em)]](https://www.rsc.org/images/entities/char_2009.gif) 1, proving that it was associated with –COO−. The characteristic peak appeared at 1408 cm−1 when the ratio was 3
1, proving that it was associated with –COO−. The characteristic peak appeared at 1408 cm−1 when the ratio was 3![[thin space (1/6-em)]](https://www.rsc.org/images/entities/char_2009.gif) :
:![[thin space (1/6-em)]](https://www.rsc.org/images/entities/char_2009.gif) 2–2
2–2![[thin space (1/6-em)]](https://www.rsc.org/images/entities/char_2009.gif) :
:![[thin space (1/6-em)]](https://www.rsc.org/images/entities/char_2009.gif) 3, which was attributed to the coordination interactions between the metal ions and –COO− groups in PAFAC.47 Overall, the intensity of the characteristic peaks of PAFAC was significantly stronger at the volume ratio of 3
3, which was attributed to the coordination interactions between the metal ions and –COO− groups in PAFAC.47 Overall, the intensity of the characteristic peaks of PAFAC was significantly stronger at the volume ratio of 3![[thin space (1/6-em)]](https://www.rsc.org/images/entities/char_2009.gif) :
:![[thin space (1/6-em)]](https://www.rsc.org/images/entities/char_2009.gif) 2 than those of the other ratios, which indicated that a suitable complex ratio could increase the degree of polymerization of PAFAC.30
2 than those of the other ratios, which indicated that a suitable complex ratio could increase the degree of polymerization of PAFAC.30
3.4 Performance of PAFAC on real wastewater treatment
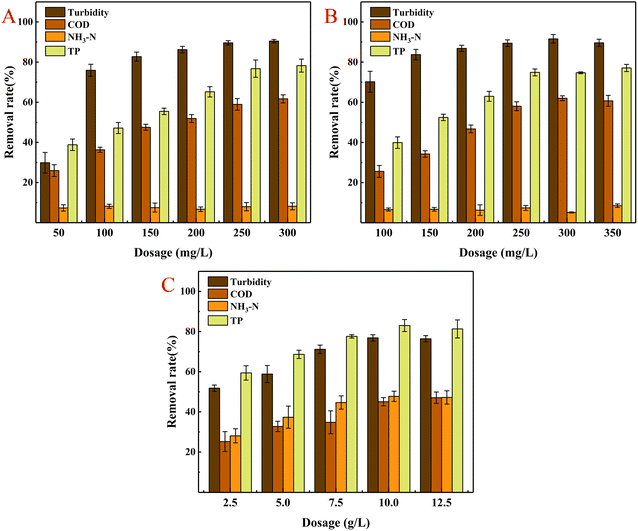 | ||
| Fig. 6 Effectiveness in treating pollutants in various water bodies. (A) Domestic sewage, (B) river water, (C) aquaculture wastewater. | ||
As shown in Fig. 6B, the optimal treatment efficiency occurred at a 300 mg L−1 dosage. However, the improvement of the removal efficiency was not significant compared with that at 250 mg L−1. Considering the cost-effectiveness, the optimal dosage of PAFAC was selected as 250 mg L−1.
As shown in Fig. 6C, the removal rate of pollutants basically reached the maximum at the dosage of 10 g L−1, the removal of turbidity was of 76.89%, COD of 45.09%, NH3–N of 47.76% and TP of 83.02%. The results indicated that the removal capacity of NH3–N by PAFAC was improved, which could be attributed that the physicochemical properties of aquaculture wastewater were different from those of domestic sewage and riverwater, and some of the NH3–N presented in aquaculture wastewater might be the form of particles or colloids, so PAFAC was much more effective in treating NH3–N in aquaculture wastewater than that of domestic sewage and riverwater.
Furthermore, the treatment efficiency of turbidity of PAFAC was compared with other flocculants reported in the previous research.21,49–55 As shown in Table 4, it could be found that PAFAC was feasible for the synthesis of flocculant, which showed good performance for the removal of turbidity.
| Types of flocculants | C0 (NTU) | C1 (NTU) | Dosage (mg L−1) | Removal rate (%) |
|---|---|---|---|---|
| PSBFZ-Fe3O4 (ref. 49) | 20–25 | 0.8–1.0 | 300 | 96.00 |
| Coagulant-3.0 (ref. 21) | 2104 | 42.08 | 100 | 98.00 |
| Al–P50 | 707 | 8.48 | 14 | 98.80 |
| YCW-PAC51 | 100 | 2.0 | 300 | 98.00 |
| CMCNa52 | 33 | 2.31 | 100 | 93.00 |
| XCTS53 | 200 | 28.20 | 90 | 85.90 |
| XG-Fe(III)54 | 3247 | 31.5 | 20 | 99.03 |
| PSTF55 | 700 | 33.60 | 45 | 98.20 |
| PAFAC | 958.40 | 28.66 | 20 | 97.01 |
4. Investigations on mechanisms
4.1 Acid leaching kinetics
The results of acid leaching kinetics were investigated in Fig. 8 and Table 5. From Fig. 8A and B, it could be seen that “1 − (1 − x)1/3” and “1 − 3(1 − x)2/3 + 2(1 − x)” had a good linear relationship with “t” in the acid leaching process of HCl and HAc in the range of 0.5 h–2.5 h. The fitted R2 of the two kinetic equations corresponding to HCl-acid leaching were 0.83 and 0.85, and the fitted R2 of the two kinetic equations corresponding to HAc-acid leaching were 0.90 and 0.93, respectively. However, since the leaching rate was maximized at 1.5 h for HCl-acid leaching and at 2.0 h for HAc-acid leaching, the H+ in the acid was fully utilized, and the reaction was complete. The following reasons could explain the above phenomenon: with the extension of the reaction time, the acid leaching liquor had a tendency to polymerize, and the colloidal substance produced by polymerization adhered to the surface of CGCS, affecting the diffusion of the acid and its contact with CGCS, and the acid soak activity was not effectively carried out in the subsequent time range.21 To further reveal the acid leaching kinetics, the model of “1 − (1 − x)1/3” and “1 − 3(1 − x)2/3 + 2(1 − x)” versus “t” during HCl-acid leaching in the range of 0.1 h to 1.5 h, and “1 − (1 − x)1/3” and “1 − 3(1 − x)2/3 + 2(1 − x)” versus “t” during HAc-acid leaching in the range of 0.25 h to 2.0 h were investigated, respectively (Fig. 8C and D). It could be seen that both “1 − (1 − x)1/3” and “1 − 3(1 − x)2/3 + 2(1 − x)” had a highly linear relationship with “t”, and the R2 of both models for the HCl-acid leaching were more than 0.98, and which of HAc-acid leaching also reached 0.97 and 0.99, respectively. The results showed that the unreacted shrinkage core model was in good agreement with the acid leaching process, and the acid leaching process involved both surface chemical reaction and loose layer diffusion.32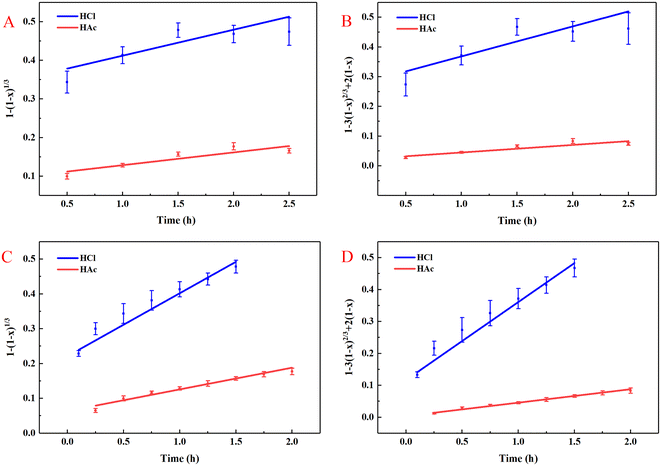 | ||
| Fig. 8 Acid leaching kinetics. (A and C) Linear relationship between “1 − (1 − x)1/3” and t, (B and D) linear relationship between “1 − 3(1 − x)2/3 + 2(1 − x)” and “t”. | ||
| Types of acids | Kinetics model and the relative parameters | |||
|---|---|---|---|---|
| Surface chemical reaction | Diffusion through the product layer | |||
| 1 − (1 − x)1/3 | 1 − 3(1 − x)2/3 + 2(1 − x) | |||
| K1 | R2 | K2 | R2 | |
| A: HCl | 6.725 × 10⁻² | 0.83388 | 10.096 × 10⁻² | 0.84845 |
| B: HAc | 3.306 × 10⁻² | 0.90246 | 2.544 × 10⁻² | 0.9326 |
| C: HCl | 18.058 × 10⁻² | 0.98402 | 24.423 × 10⁻² | 0.98897 |
| D: HAc | 6.231 × 10⁻² | 0.9764 | 4.211 × 10⁻² | 0.99453 |
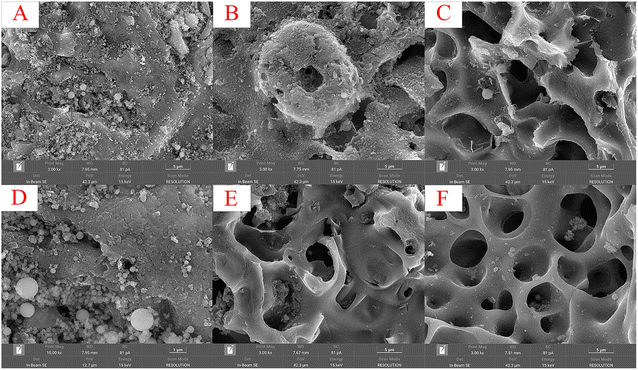
To further investigate the acid leaching mechanism, the SEM images of the original CGCS and its residues after HCl and HAc acid leaching were demonstrated in Fig. 9. It was found that the surface of the original CGCS was covered with SiO2 microspheres and various metal oxides but few pores (Fig. 9A and D). With the time going on, it could be seen that the surface of the CGCS gradually became rough due to the opened pores (Fig. 9B and E). Then the acid started to diffuse into the interior of the pores, react with the metal oxides of looser layer, leaving the smoother inner surface and larger pore size (Fig. 9C and F), which played a significant role in enhancing the acid leaching efficiency. The results were in good agreement with surface chemical reaction and loose layer diffusion, greatly supporting the mechanisms of acid leaching.
4.2 Flocculation mechanism of PAFAC
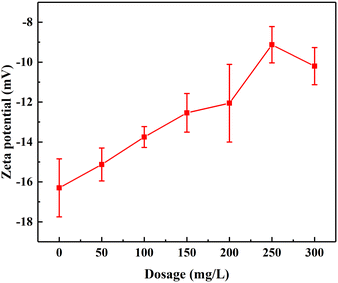
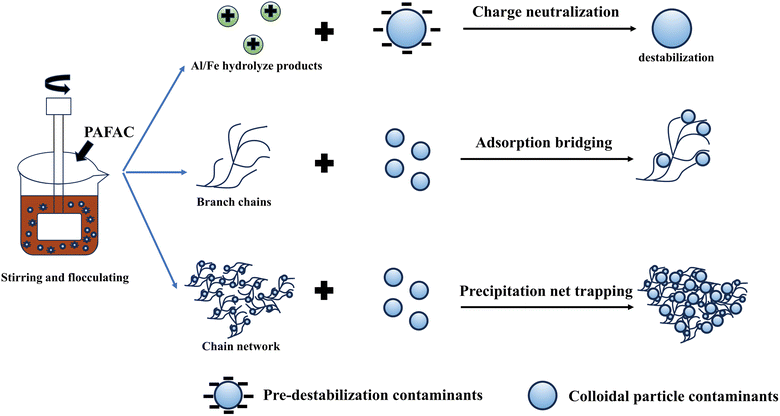
The flocculation mechanism of PAFAC includes electric neutralization, adsorption bridging and precipitation net trapping. Fig. 14 is a schematic diagram of the overall flocculation mechanism of PAFAC.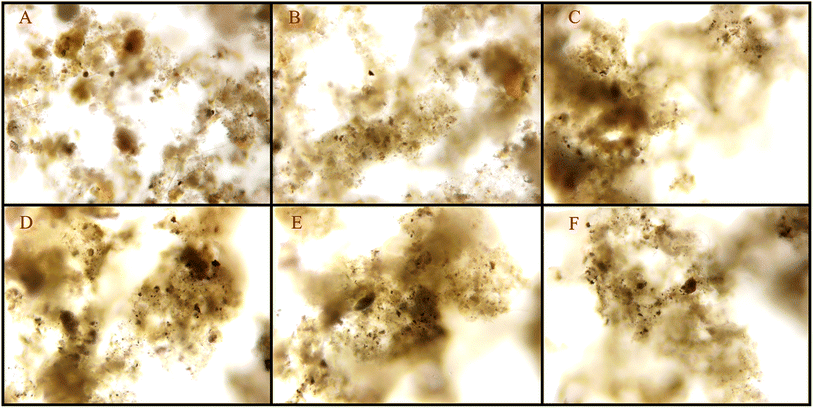 | ||
| Fig. 12 Optical microscope images of flocs. (A), (B), (C), (D), (E) and (F) are the images at dosages of 50, 100, 150, 200, 250 and 300 mg L−1, respectively. | ||
In addition, the effect of pH was investigated to further reveal the treatment efficiency of turbidity, COD and TP. As shown in Fig. 13, the good removal effect at pH 3.0 was attributed that metal ions (Al3+, Fe3+, Ca2+, etc.) of PAFAC were hydrolyzed into mononuclear and polynuclear hydroxyl complex ions under the strong acid environment, which adsorbed suspended colloidal particles in the system and rapidly aggregate to form large and dense flocs.21,64 At pH 7.0, the flocculation performance was mainly based on adsorption bridging, supplemented by charge neutralization, and in this way, the flocculant also possessed good removal performance.65 However, at pH 5.0, charge neutralization was not as strong as strong acid conditions, and adsorption bridging was not as strong as neutral conditions, resulting a weaker flocculation performance.66 When the pH was increased to 9.0, the removal efficiency of the flocculant on turbidity and COD decreased sharply to 84.95% and 45.47%. This was because the rate and degree of hydrolysis of Fe3+ and Al3+ was intensified in an alkaline environment, which tended to form Fe(OH)3 and Al(OH)3 precipitates, thus weakening the performance of PAFAC and led to a significant decrease in flocculation effect.67 When the pH was increased to 11.0, OH− increased, and some pollutants in domestic sewage would react with OH− to form precipitation, which made it easier for the pollutants to settle through precipitation net trapping with PAFAC. However, at pH 11.0, the removal rate of COD did not increase as significantly as that of turbidity due to the hydrolysis of Fe3+ and Al3+ further aggravated in the strong alkali environment, which weakened the flocculant performance and decreased the efficiency of COD removal.
It was found that the removal efficiency of TP improved with the increase of pH, which reached its maximum of 81.84% at pH 9.0. The results indicated that PO43− in solution would exchange ligands with the –OH/–OH2 groups of Al and Fe to form AlPO4 and FePO4 precipitates or similar Al–P and Fe–P compounds in neutral and partially neutral environments, which is conducive to the removal of PO43−.68 The removal efficiency of TP was weak at pH 3.0 and 11.0 because the phosphate might dissolve under strongly acidic or alkaline environments.69
5 Conclusion
In the work, a novel two-step acid leaching process was initiated for the synthesis of flocculants based on the reutilization of CGCS, and the acid leaching kinetics and flocculation mechanisms were investigated. The unique strategy of work lies in overcoming the limitation of acid leaching efficiency, improving the flocculation structure and performance. The following conclusions could be achieved.(1) The optimum conditions for CGCS in HCl-acid leaching were as follows: concentration of 3.0 mol L−1, acid leaching temperature of 40 °C, acid leaching time of 1.5 h, and liquid–solid ratio of 15![[thin space (1/6-em)]](https://www.rsc.org/images/entities/char_2009.gif) :
:![[thin space (1/6-em)]](https://www.rsc.org/images/entities/char_2009.gif) 1. The optimum conditions for CGCS in HAc-acid leaching were as follows: concentration of 5.0 mol L−1, acid leaching temperature of 40 °C, acid leaching time of 2.0 h, and liquid–solid ratio of 15
1. The optimum conditions for CGCS in HAc-acid leaching were as follows: concentration of 5.0 mol L−1, acid leaching temperature of 40 °C, acid leaching time of 2.0 h, and liquid–solid ratio of 15![[thin space (1/6-em)]](https://www.rsc.org/images/entities/char_2009.gif) :
:![[thin space (1/6-em)]](https://www.rsc.org/images/entities/char_2009.gif) 1. The optimum leaching of CGCS by HCl solution was 85.76%, and the optimum leaching of CGCS by HAc solution was 44.32%.
1. The optimum leaching of CGCS by HCl solution was 85.76%, and the optimum leaching of CGCS by HAc solution was 44.32%.
(2) The optimal preparation conditions of PAFAC were as follows: the volume ratio was 3![[thin space (1/6-em)]](https://www.rsc.org/images/entities/char_2009.gif) :
:![[thin space (1/6-em)]](https://www.rsc.org/images/entities/char_2009.gif) 2, the polymerization pH was 3.5, the reaction temperature was 70 °C, and the reaction time was 3.0 h. Based on the XRF, XRD, FT-IR, and SEM characterization of PAFAC, it could be concluded that PAFAC was a kind of amorphous polymer containing Al, Fe, and Ca with a close gel network structure.
2, the polymerization pH was 3.5, the reaction temperature was 70 °C, and the reaction time was 3.0 h. Based on the XRF, XRD, FT-IR, and SEM characterization of PAFAC, it could be concluded that PAFAC was a kind of amorphous polymer containing Al, Fe, and Ca with a close gel network structure.
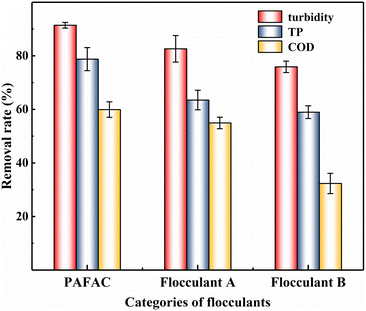
(3) PAFAC showed good performance in the treatment of domestic sewage, riverwater and aquaculture wastewater. Especially in the treatment of domestic sewage, PAFAC had excellent performance in the removal of turbidity, COD, and TP compared with that of flocculant A and B, which were only prepared by HCl and HAc, respectively.
(4) The acid leaching kinetics revealed that the acid leaching process of both acids coincided with both equations of the unreacted shrinkage core model and that both involved surface chemical reaction and loose layer diffusion. Moreover, the flocculation mechanisms demonstrated that charge neutralization, adsorption bridging dominated the flocculation process and precipitation net trapping played simultaneous roles in the flocculation.
The work has developed a new method for the safe disposal of CGCS and provides a novel way for the preparation of Fe–Al composite flocculants, especially, offering a potential strategy for the promotion of the additional value of the coal chemical industry. In addition, due to its good flocculation performance, PAFAC is expected to be a feasible pathway to treat coal gasification wastewater, coal chemical wastewater and mine wastewater associated with the activated sludge process.
Author contributions
Haoqi Pan: writing – original draft, methodology, formal analysis; Tingting Shen, Jing Sun: writing – review & editing, conceptualization, funding acquisition, resources; Chenxu Sun, Haoqi Pan, Shaocang He, Tianpeng Li: formal analysis; Xuqian Lu: methodology.Conflicts of interest
The authors declare that they have no known competing financial interests or personal relationships that could have appeared to influence the work reported in this paper.Acknowledgements
The study was financially supported by the Foundation (No. ZZ20210124) of State Key Laboratory of Biobased Material and Green Papermaking, Qilu University of Technology, Shandong Academy of Sciences; National College Students' Innovation and Entrepreneurship Training Program (No. 202110431079), and Qilu University of Technology (Shandong Academy of Sciences) Basic Research Project of Science, Education and Industry Integration Pilot Project (No. 2022PY047).References
- F. Guo, H. Wang, H. Li, S. Guo, Y. Guo, G. Qiu, H. Du, Y. Zhang, J. Wu and H. Zhang, Fuel, 2023, 339, 126924 CrossRef CAS
.
- X. Liu, Z. Jin, Y. Jing, P. Fan, Z. Qi, W. Bao, J. Wang, X. Yan, P. Lv and L. Dong, Chin. J. Chem. Eng., 2021, 35, 92–106 CrossRef CAS
.
- J. Han, D. Jia, Q. Hui, L. Cui, Z. Zhu and C. Cao, Geohazard Mech., 2023, S294974182300033X Search PubMed
.
- Z. Xue, C. Yang, L. Dong, W. Bao, J. Wang and P. Fan, Sep. Purif. Technol., 2023, 304, 122394 CrossRef CAS
.
- W. Li, Z. Yu and G. Guan, Carbon Resour. Convers., 2021, 4, 89–99 CrossRef CAS
.
- D. Wang, W. Meng, H. Zhou, Y. Yang, J. Xie, S. Yang and G. Li, J. Cleaner Prod., 2022, 339, 130500 CrossRef CAS
.
- K. B. Kabir, K. Hein and S. Bhattacharya, Comput. Chem. Eng., 2013, 48, 96–104 CrossRef CAS
.
- F. Guo, Y. Guo, Z. Guo, Z. Miao, X. Zhao, Y. Zhang, J. Li and J. Wu, ACS Sustain. Chem. Eng., 2020, 8, 8830–8839 CrossRef CAS
.
- U. Arena, Waste Manage., 2012, 32, 625–639 CrossRef CAS PubMed
.
- Z. Li, Y. Zhang, H. Zhao, H. Chen and R. He, Constr. Build. Mater., 2019, 213, 265–274 CrossRef CAS
.
- A. G. Kim, Fuel, 2009, 88, 1444–1452 CrossRef CAS
.
- B. Lv, X. Deng, F. Jiao, B. Dong, C. Fang and B. Xing, Process Saf. Environ. Prot., 2023, 171, 859–873 CrossRef CAS
.
- J. Xin, L. Liu, Q. Jiang, P. Yang, H. Qu and G. Xie, Constr. Build. Mater., 2022, 322, 125936 CrossRef CAS
.
- A. Mohammadinia, A. Arulrajah, J. Sanjayan, M. M. Disfani, M. Win Bo and S. Darmawan, J. Mater. Civ. Eng., 2016, 28, 04016033 CrossRef
.
- T. Liu, S. K. Awasthi, Y. Duan, Z. Zhang and M. K. Awasthi, Bioresour. Technol., 2020, 304, 123024 CrossRef CAS PubMed
.
- D. Zhu, S. Miao, B. Xue, Y. Jiang and C. Wei, Water, Air, Soil Pollut., 2019, 230, 155 CrossRef
.
- Y. Xiang, Y. Xiang, L. Wang and X. Li, Environ. Sci. Pollut. Res., 2018, 25, 11636–11645 CrossRef CAS PubMed
.
- N. Yuan, K. Tan, X. Zhang, A. Zhao and R. Guo, Chemosphere, 2022, 303, 134839 CrossRef CAS
.
- X. Ma, Y. Li, D. Xu, H. Tian and H. Yang, J. Environ. Manage., 2022, 305, 114404 CrossRef CAS PubMed
.
- Q. Qiao, H. Zhou, F. Guo, R. Shu, S. Liu, L. Xu, K. Dong and Y. Bai, J. Cleaner Prod., 2022, 379, 134739 CrossRef CAS
.
- S. He, T. Li, T. Shen, J. Sun, H. Pan, C. Sun, W. Lu, X. Lu, G. Gao, Y. Fan, R. Li, E. Zhang and D. Yu, Process Saf. Environ. Prot., 2023, 173, 249–262 CrossRef CAS
.
- W. Ai, Y. Li, X. Zhang, L. Xiao and X. Zhou, Environ. Sci. Pollut. Res., 2022, 29, 88894–88907 CrossRef CAS
.
- C. Li, R. Liu, J. Zheng, L. Liao and Y. Zhang, Int. J. Hydrogen Energy, 2022, 47, 12528–12538 CrossRef CAS
.
- Z. Miao, J. Xu, L. Chen, R. Wang, Y. Zhang and J. Wu, Fuel, 2022, 309, 122334 CrossRef CAS
.
- C. S. Lee, M. F. Chong, J. Robinson and E. Binner, Ind. Eng. Chem. Res., 2014, 53, 18357–18369 CrossRef CAS
.
- J. El-Gaayda, F. E. Titchou, R. Oukhrib, P.-S. Yap, T. Liu, M. Hamdani and R. Ait Akbour, J. Environ. Chem. Eng., 2021, 9, 106060 CrossRef CAS
.
- G. Lu, T. Zhang, L. Ma, Y. Wang, W. Zhang, Z. Zhang and L. Wang, Hydrometallurgy, 2019, 188, 248–255 CrossRef CAS
.
- Y. Cheng, L. Xu and C. Liu, Environ. Technol. Innovation, 2022, 27, 102509 CrossRef CAS
.
- Y. Zhang, M. Li, D. Liu, X. Hou, J. Zou, X. Ma, F. Shang and Z. Wang, Environ. Technol., 2019, 40, 1568–1575 CrossRef CAS
.
- J. Gao, B. Wang, W. Li, L. Cui, Y. Guo and F. Cheng, Sep. Purif. Technol., 2023, 306, 122545 CrossRef CAS
.
- M. Brubaker, B. W. Stewart, R. C. Capo, K. T. Schroeder, E. C. Chapman, L. J. Spivak-Birndorf, D. J. Vesper, C. R. Cardone and P. C. Rohar, Appl. Geochem., 2013, 32, 184–194 CrossRef
.
- Y. Zhang, J. Sun, G. Lü, T. Zhang and Y. Gong, Trans. Nonferrous Met. Soc. China, 2023, 33, 1932–1942 CrossRef CAS
.
- Z. Zhao, R. Wang, J. Shu, M. Chen, Z. Xu, T. Xue, X. Zeng, D. He, D. Tan, Z. Deng and K. Ai, Miner. Eng., 2022, 189, 107862 CrossRef CAS
.
- H. Islas, M. U. Flores, I. A. Reyes, J. C. Juárez, M. Reyes, A. M. Teja, E. G. Palacios, T. Pandiyan and J. Aguilar-Carrillo, J. Hazard. Mater., 2020, 386, 121664 CrossRef CAS PubMed
.
- Y. Zheng and K. Chen, Trans. Nonferrous Met. Soc. China, 2014, 24, 536–543 CrossRef CAS
.
- J. Zhang, J. Zuo, Y. Jiang, D. Zhu, J. Zhang and C. Wei, Solid State Sci., 2020, 100, 106084 CrossRef CAS
.
- Z. Lin, C. Zhang, C. Sun, W. Lu, B. Quan, P. Su, X. Li, T. Zhang, J. Guo and W. Li, Sep. Purif. Technol., 2023, 327, 124870 CrossRef CAS
.
- H. Wang, Q. Zhang, J. Bian and D. Zhang, Environ. Technol. Innovation, 2023, 30, 103096 CrossRef CAS
.
- W. P. Cheng, Chemosphere, 2002, 47, 963–969 CrossRef CAS PubMed
.
- T.-K. Liu and E. S. K. Chian, J. Colloid Interface Sci., 2005, 284, 542–547 CrossRef CAS PubMed
.
- L. Yan, Y. Wang, J. Li, H. Shen, C. Zhang and T. Qu, Desalin. Water Treat., 2016, 57, 18260–18274 CrossRef CAS
.
- B. Liu, P. An, J. Chen, X. Xu, L. Liu and F. Yang, Process Saf. Environ. Prot., 2020, 140, 380–391 CrossRef CAS
.
- A. I. Zouboulis, P. A. Moussas and F. Vasilakou, J. Hazard. Mater., 2008, 155, 459–468 CrossRef CAS PubMed
.
- N. D. Tzoupanos, A. I. Zouboulis and C. A. Tsoleridis, Colloids Surf., A, 2009, 342, 30–39 CrossRef CAS
.
- Y. Zhang, S. Li, X. Wang, X. Ma, W. Wang and X. Li, Sep. Purif. Technol., 2015, 146, 311–316 CrossRef CAS
.
- S. Yang, W. Li, H. Zhang, Y. Wen and Y. Ni, Sep. Purif. Technol., 2019, 209, 238–245 CrossRef CAS
.
- Y. Liu, J. Ma, L. Lian, X. Wang, H. Zhang, W. Gao and D. Lou, Process Saf. Environ. Prot., 2021, 155, 287–294 CrossRef CAS
.
- A. Hasan and P. Fatehi, Sep. Purif. Technol., 2018, 207, 213–221 CrossRef CAS
.
- C. Ding, A. Xie, Z. Yan, X. Li, H. Zhang, N. Tang and X. Wang, J. Water Process Eng., 2021, 40, 101899 CrossRef
.
- Z. Lin, C. Zhang, Y. Hu, P. Su, B. Quan, X. Li and Z. Zhang, J. Cleaner Prod., 2023, 399, 136582 CrossRef CAS
.
- Z. Ferasat, R. Panahi and B. Mokhtarani, J. Environ. Manage., 2020, 255, 109939 CrossRef CAS PubMed
.
- R. Khiari, S. Dridi-Dhaouadi, C. Aguir and M. F. Mhenni, J. Environ. Sci., 2010, 22, 1539–1543 CrossRef CAS PubMed
.
- K. Yang, G. Wang, X. Chen, X. Wang and F. Liu, Colloids Surf., A, 2018, 558, 384–391 CrossRef CAS
.
- Q. Teng, Z. Yang, B. Li, Z. Xie and S. Liu, Colloids Surf., A, 2023, 676, 132250 CrossRef CAS
.
- X. Huang, Y. Zhang, X. Li, J. Duan, B. Xu, S. Xia and P. Dong, J. Water Process Eng., 2020, 36, 101267 CrossRef
.
- L. Zhang, X. Liu, M. Zhang, T. Wang, H. Tang and Y. Jia, J. Environ. Chem. Eng., 2023, 11, 109312 CrossRef CAS
.
- M. Han, Y. Dong, L. Dong, N. Guo and D. Wu, J. Water Process Eng., 2023, 54, 103952 CrossRef
.
- M. E. M. Ali, S. M. A. Moniem, B. A. Hemdan, N. S. Ammar and H. S. Ibrahim, S. Afr. J. Chem. Eng., 2022, 42, 127–137 Search PubMed
.
- Y. Zeng and J. Park, Colloids Surf., A, 2009, 334, 147–154 CrossRef CAS
.
- X. Quan and H. Wang, Chin. J. Chem. Eng., 2014, 22, 1055–1060 CrossRef CAS
.
- R. Subramanian, S. Zhu and R. H. Pelton, Colloid Polym. Sci., 1999, 277, 939–946 CrossRef CAS
.
- L. D. Benefield, J. F. Judkins and B. L. Weand, Process Chemistry for Water and Wastewater Treatment, Prentice-Hall, Englewood Cliffs, N. J., 1982 Search PubMed
.
- S. Sadri Moghaddam, M. R. Alavi Moghaddam and M. Arami, J. Environ. Manage., 2011, 92, 1284–1291 CrossRef CAS PubMed
.
- J. Liu, Y. Zhu, Y. Tao, Y. Zhang, A. Li, T. Li, M. Sang and C. Zhang, Biotechnol. Biofuels, 2013, 6, 98 CrossRef CAS PubMed
.
- T. Chen, B. Gao and Q. Yue, Colloids Surf., A, 2010, 355, 121–129 CrossRef CAS
.
- G. Zhu, H. Zheng, W. Chen, W. Fan, P. Zhang and T. Tshukudu, Desalination, 2012, 285, 315–323 CrossRef CAS
.
- H. Zhao, H. Liu and J. Qu, Colloids Surf., A, 2011, 379, 43–50 CrossRef CAS
.
- U. A. Toor, H. Shin and D.-J. Kim, J. Ind. Eng. Chem., 2019, 71, 425–434 CrossRef CAS
.
- T. U. Ali and D.-J. Kim, Bioresour. Technol., 2016, 217, 233–238 CrossRef CAS PubMed
.
| This journal is © The Royal Society of Chemistry 2024 |

