 Open Access Article
Molecular dynamics simulation of crack propagation in very small grain size nanocopper with different grain size gradients
Fankai Xian ab,
Jinjie Zhou*ac,
Xiaofeng Lianb,
Jinchuan Shenac and
Yuepeng Chenab
aSchool of Mechanical Engineering, North University of China, Taiyuan, 030051, P. R. China. E-mail: zhoujinjiechina@nuc.edu.cn
bThe Key Laboratory of Industrial Internet and Big Data, China National Light Industry, Beijing, 100048, P. R. China
cShanxi Key Laboratory of Intelligent Equipment Technology in Harsh Environment, North University of China, Taiyuan, 030051, China
First published on 2nd January 2024
Abstract
In this paper, we use molecular dynamics to simulate the crack propagation behavior of gradient nano-grained (GNG) copper models with different grain size gradients, compare the crack propagation rates of different models, and analyze the microstructural changes and the mechanism of crack propagation. The simulation results show that the increase of the grain size gradient of the GNG copper model can improve the fracture resistance of the material, and the crack propagation mode undergoes a transition from brittle propagation along the grain boundaries to the formation of pores at the grain boundaries, and then to ductile fracture along the inclined plastic shear zone. The number of dislocations increases with the grain size gradient, while the crack passivation is more serious, indicating that a larger grain size gradient is more effective in inhibiting crack propagation. The introduction of gradient grain size promotes crack propagation and weakens the plasticity of the material relative to the nano-grained (NG) copper model.
1. Introduction
Nano-grained (NG) metals have high strength but poor ductility compared to coarse crystals (CG), and the introduction of heterostructures can overcome the ductility limitation of NG metals, which is an effective way to improve the performance of NG metals for applications. Gradient nano-grained (GNG) metals with progressively varying grain sizes from the surface to the center have numerous excellent properties, including strength-ductility synergy,1,2 significant strain-hardening effect,3–5 catalytic properties,6,7 and excellent corrosion resistance.8,9 Various methods have been used in previous studies to realize the gradient microstructure of metals, such as surface mechanical attrition treatment,10 surface mechanical grinding treatment (SMGT),1 and frictional sliding deformation of platens.11The unique microstructure of gradient nanomaterials leads to a unique deformation mechanism during deformation, which is closely related to grain size, while dislocation activity and grain boundary motion dominate the deformation of metallic materials. Many studies have been devoted to reveal the deformation mechanism of GNG structures through experiments and simulations. Wu et al.3 and Cheng et al.12 attribute the additional strain hardening of GNG metals to the storage of geometrically necessary dislocations near grain boundaries or within grains caused by the grain gradient size distribution, which also makes the material highly ductile. Qiang et al.13 revealed the strengthening mechanism of the GNG model structure by varying the width of the region for each grain size, showing that the change in grain size leads to a shift in the deformation mechanism from grain boundary motion of small grains to dislocation slip of large grains, and at the same time realizes the synergistic strengthening of dislocations and heterogeneous structural deformation in the GNG structure. Cheng et al.14 established the mechanism linking the structural gradient, plastic strain gradient, extra back-stress and extra strength in GNG Cu through experiments and modeling, and explained the higher extra strength and work-hardening of GNG metal based on the extra back stress induced by GND buildup. He et al.15 found that larger gradients in a certain size range increase the strength through molecular dynamics (MD) simulation studies. Uneven grain size leads to uneven stress distribution and the appearance of synergistic deformation-induced reverse H–P phenomenon. Zhu et al.16 proposed that GND stacking as resulting in back stress in the soft domains to counteract the applied stress to make it appear stronger, and forward stress in the hard domains to make it appear weaker, and defined heterogeneous deformation-induced (HDI) hardening as additional hardening induced by the interplay between back stress and positive stress. Cao et al.17 found that the grain size gradient has an effect on the strongest size, and an increase in the grain gradient size will make the strongest size decrease, in which the grain boundary-mediated softening process is the key to regulating the spatial distribution of grain boundaries can be varied resistance and dislocations within the grain boundaries or grains are stored to cause additional strain hardening. In addition, Li et al.2 summarized experimental, theoretical, and computational studies on engineered metals and alloys, showing that gradient nanostructures are an effective way to achieve simultaneous increases in material strength and ductility, as well as additional work hardening.
In the study of the fracture properties of gradient nanomaterials, Jing et al.18 and Jing et al.19 investigated the high-cycle fatigue performance as well as the low-cycle fatigue performance of GNG Cu, respectively, and showed that the gradient nanostructures prevented surface roughening and crack formation. Wang et al.20 showed that large grain size gradients can increase the resistance of nanocrystals to crack propagation by shifting the fracture mode from intergranular to intragranular, as well as exhibiting higher fracture toughness, while nanocrystals with uniform grain size or smaller gradients exhibit intergranular fracture. Yang et al.21 explored the crack propagation process in gradient nanocrystals by constructing a two-dimensional mathematical model, showing that the dispersion of grain size facilitates the grain boundaries to undergo adaptive deformation, which blunts the cracks and hinders crack propagation. It is demonstrated that the related mechanisms of grain boundaries (creep and debonding) dominate the brittle toughness transition of nanomaterials. Li et al.22 used the distributed dislocation method to simulate the evolution of the plastic zone and found that the larger the grain size gradient, the larger the size of the dislocation and dislocation-free zones. The increase in grain size gradient led to an increase in the number of dislocations emitted from the crack tip and more severe crack passivation, which effectively inhibited the crack propagation. Liu et al.23 investigated crack propagation in GNG metals under the inverse H–P relationship. The results show that the introduction of grain size gradient impairs the ability of nanomaterials to resist crack propagation. The importance of grain boundary-related mechanisms and dislocation activities in crack propagation was also revealed. When preparing gradient nanomaterials, it is difficult to completely avoid the presence of defects such as pores and impurities. These defects degrade the mechanical properties of the materials and may lead to brittle fractures. Therefore, studying the cracking behavior of very small grains in nanocrystalline metals is essential to ensure the safe application of gradient nanomaterials. On the other hand, the crack propagation study of gradient nanomaterials using molecular dynamics is still relatively rare so far. Molecular dynamics, starting from the atomic level, can provide in-depth study on the crack extension process of gradient nanomaterials, which is of great significance in revealing the complex synergistic effect of multiple mechanisms in gradient nanomaterials. Therefore, in this study, we used the molecular dynamics method to simulate the fracture behavior of gradient nanocopper materials with central cracks and explored the effect of grain size gradient on the fracture behavior by analyzing their microstructural deformation.
2. MD modeling of GNG Cu with initial center cracks
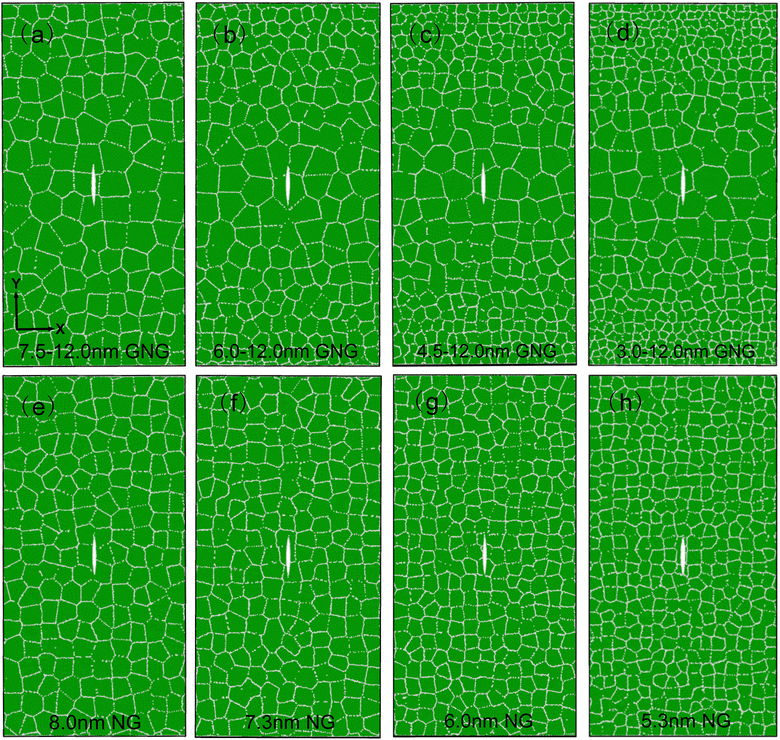
In this paper, quasi-3D gradient nanocopper models containing an initial center crack are constructed. First, four models with different grain size gradients were generated using the Voronoi method in the direction along the Y-axis, and the grain sizes in all the models were below the critical grain size, and all these models had random crystal orientations, as shown in Fig. 1(a)–(d), with GNG structures with linear distributions of 3.0–12.0 nm, 4.5–12.0 nm, 6.0–12.0 nm, and 7.5–12.0 nm, respectively. To facilitate comparison, four NG models with uniform grain size distribution were prepared by the same method, with grain sizes of 5.3 nm, 6.0 nm, 7.3 nm, and 8.0 nm, respectively, as shown in Fig. 1(e)–(h). All study models have dimensions of 80 × 150 × 14 nm3 and several atoms of approximately 1![[thin space (1/6-em)]](https://www.rsc.org/images/entities/char_2009.gif) 130
130![[thin space (1/6-em)]](https://www.rsc.org/images/entities/char_2009.gif) 000.
000.
In this study, the open-source software LAMMPS was used for the calculations. In the model setup, we inserted center cracks of size 150 Å in the model by deleting atoms in the middle region of the model, all model crack tips were located inside the grains, and NVT system relaxation was performed for all models. The stretching process was carried out using uniaxial stretching at a constant strain rate of 5 × 10⁸ s−1 along the X-direction and an integration step of 1 fs. During the stretching process, we also used the NVT system and kept the overall temperature at 300 K. In terms of boundary conditions, we used non-periodic boundary conditions along the Y-direction, while along the X and Z directions, we used periodic boundary conditions. To model interatomic interactions, we used the modified embedded atom method (MEAM) (Asadi et al.24), which allows for more accurate characterization of materials concerning the conventional EAM potential (Mishin et al.25). In the MEAM potential, the total energy Etotal of the atomic system can be expressed by the following equation:
 | (1) |
In the above expression, Fi denotes the energy of embedding, i.e., the energy required for atom i to be embedded in a position having a background electron density of ρi, ρi denotes the density of electrons produced by the nearest atom neighboring atom i, φij is the pairwise interaction potential between atoms i and j, and rij denotes the distance between atom i and atom j. Compared to the EAM potential, the MEAM potential can better characterize the interatomic interactions in asymmetric systems, such as those characterized by surfaces, defects, and so on. Compared to the conventional EAM potential, the MEAM potential can more accurately reflect the material properties because it takes into account more electron density information.
In this paper, OVITO was chosen as the visualization software for model analysis and data post-processing (Stukowski et al.26). Dislocation extraction algorithm (DXA) was used to identify the dislocations present in the model (Stukowski et al.27). To distinguish the different structures of the atoms, the method of common neighbor analysis (CNA) was used to color the atoms (Honeycutt et al.28). Green color represents atoms with FCC structure, red color represents atoms with HCP structure, and white color represents atoms with amorphous structure.
3. Results and discussion
3.1 Main features of cracking
In order to accurately describe the variation in grain size, we define the grain size gradient parameter g:| g = (dmax − dmin)/Ly | (2) |
In the above equation dmax denotes the maximum size of the grain in the GNG structure, dmin denotes the minimum size of the grain, and Ly denotes the length of the model in the y direction. The four grain size gradients chosen in this paper g are calculated to be 0.06, 0.08, 0.1, and 0.12, respectively.
The stress–strain curves during crack propagation of the GNG model for each grain size gradient and the corresponding NG model are shown in Fig. 2. The flow stress is defined as the average stress in the strain interval of 8–18% after the specimen enters the yield stage. By looking at the flow stresses of GNG models with different grain size gradients (see Fig. 2(a)), the flow stresses of the GNG structure under the inverse H–P relationship are related to the grain gradient, and the higher the gradient, the higher the strength (see inset of Fig. 2(a)), which is in agreement with the conclusion of He et al.15 The flow stress profile of the 7.5–12.0 nm model is similar to that of the 6.0–12.0 nm model in that the stress values decrease rapidly with increasing strain, which is related to its rapid fracture. The flow stress profile of the 4.5–12.0 nm model is similar to that of the 3.0–12.0 nm model, with a relatively flat change in stress values, which suggests a relatively slow rate of crack propagation. As shown in Fig. 2(b), comparing the flow stress of NG models with different grain sizes, it can be seen that the flow stress of the NG structure increases with decreasing grain size, which implies that the strength of the crack-containing NG Cu model in the tensile process increases with decreasing grain size, and the plasticity also increases as shown in Fig. 4, so that its resistance to crack propagation is better with decreasing grain size.
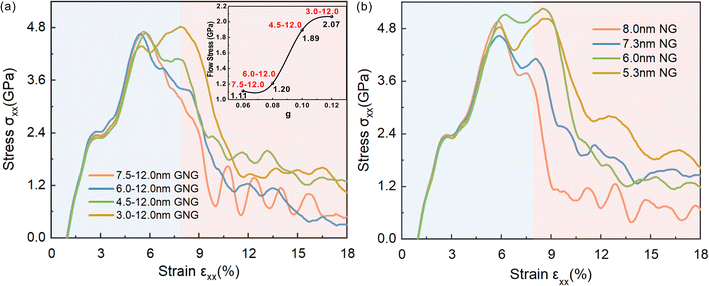 | ||
| Fig. 2 Stress–strain curves for each model during tension (a) GNG model with different grain size gradients and (b) uniform NG model. | ||
The crack propagation process of the GNG model with different grain size gradients and the NG model with different grain sizes are shown in Fig. 3 and 4, respectively. Observing Fig. 3, with the increase of the grain size gradient of the GNG model, the crack propagation rate slows down and the plasticity is enhanced. In the NG model of Fig. 4, the crack propagation is hindered more intensely as the average grain size decreases, and the plastic shear band is significantly enhanced. A comparison of Fig. 3 and 4 shows that each GNG model crack propagation is faster than its corresponding NG model, and the number of dislocations (red atoms) is smaller than its corresponding NG model, which indicates that the GNG model has the effect of accelerating crack propagation and weakening plasticity.
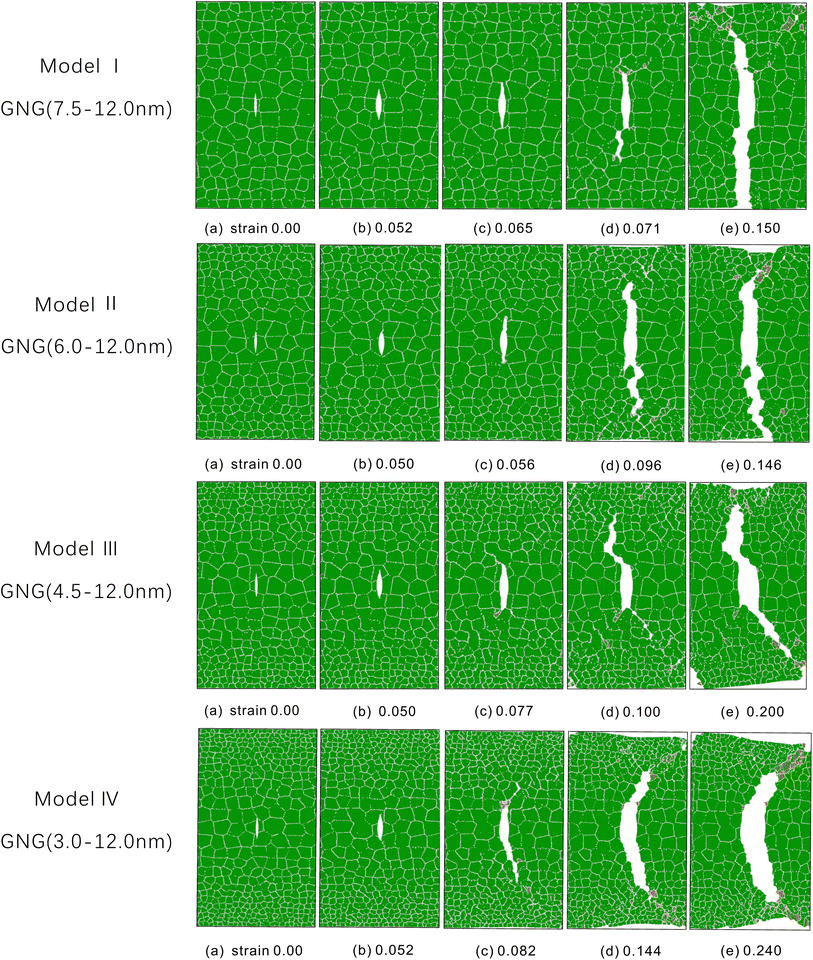 | ||
| Fig. 3 (a–e) Propagation process of 7.5–12.0 nm, 6.0–12.0 nm, 4.5–12.0 nm, 3.0–12.0 nm GNG MD samples with center cracks under different strains. | ||
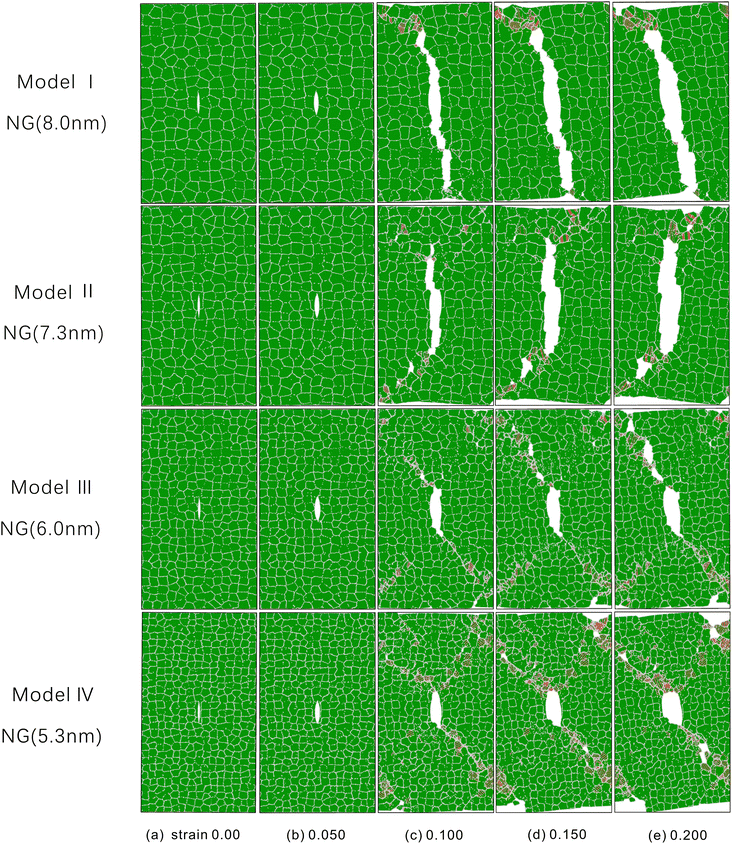 | ||
| Fig. 4 (a–e) Propagation process of 8.0 nm, 7.3 nm, 6.0 nm, 5.3 nm NG MD samples with center cracks under different strains. | ||
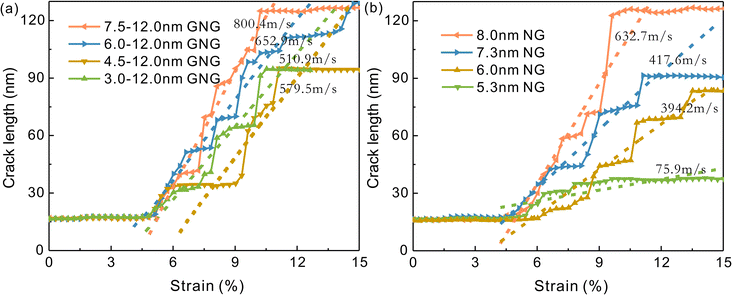
The crack length is defined in this paper as the vertical distance from the crack opening to the crack tip. It is plotted as a function of the displacement of model a to d (Fig. 5(a)) versus model e to h (Fig. 5(b)) in Fig. 1, as shown in Fig. 5. By observing the crack length variation curves of the GNG model in Fig. 5(a) and the NG model in Fig. 5(b), it can be seen that the crack propagation rate decreases with the increase of the grain size gradient in the GNG model or the decrease of the average grain size in the NG model. By comparing Fig. 5(a) with (b), it can be similarly seen that the crack propagation rate of each GNG model is greater than the crack propagation rate of its corresponding NG model, while the grain sizes of all the GNG models and the NG model are in the range of the inverse H–P relationship, which similarly suggests that the introduction of gradient sizes in the inverse H–P relationship accelerates the crack propagation.
3.2 Transformation of crack propagation mechanisms
First, the crack propagation paths of four different GNG and NG materials are analyzed in conjunction with the crack length curves in Fig. 5. In the model I 7.5–12.0 nm GNG material of Fig. 3, the propagation resistance is relatively high when the initial tip of the crack is inside the grain during stretching at a strain less than 0.052, at which time the crack is not able to expand. As stretching proceeds, the stress at the crack tip continues to increase causing the crack to begin to expand. The specific process of crack propagation in model I is shown in Fig. 6. As shown in Fig. 6(b), at a strain of 0.058, the crack tip arrives at the grain boundary which is almost perpendicular to the crack propagation direction, and the propagation is blocked. The increase of tensile strain thereafter will cause the crack propagation direction to be deflected, as shown in Fig. 6(c) because the resistance of crack propagation along the deflected grain boundary is smaller than that of breaking through the grain boundary that is perpendicular to the crack propagation direction. At the same time, the stress in the cracks at the deflected grain boundaries increases, while the stress at the grain boundaries that originally prevented crack propagation decreases, leading to a change in the direction of crack propagation, as shown in Fig. 6(d) for the resultant diagram of crack propagation occurring in deflection. It shows that the crack propagation occurs along the grain boundaries and is not capable of intragranular propagation. And the cracks under this grain gradient basically occur along the intergranular propagation, the propagation rate is also the fastest, the propagation process is accompanied by very few dislocations generated, and the whole propagation process behaves brittle, indicating that the grain boundaries contribute to the brittle behavior, and at a strain of 0.15, the 7.5–12.0 nm GNG Cu basically fracture completely, as shown in (e) in model I of Fig. 3.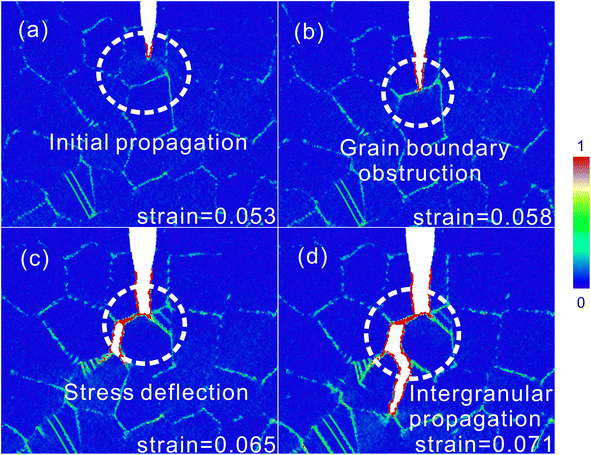 | ||
| Fig. 6 In the 7.5–12.0 nm GNG model, (a and b) GB hinders crack propagation, and (c and d) a transverse transition occurs in the subsequent crack propagation. | ||
Next, observing the crack propagation model of model II in Fig. 3, combined with the crack propagation curve in Fig. 5(a), compared with model I, although the crack propagation speed is slowed down, it still extends rapidly along the grain boundaries, and the whole is still brittle propagation.
The crack propagation process of GNG Cu at 4.5–12.0 nm is shown in model III in Fig. 3, where the crack starts to undergo sudden propagation at 0.091 strain. This sudden propagation of the crack is due to the formation of the pores that connect with the main crack when they increase to a certain extent, and its detailed propagation process is shown in Fig. 7. Under tensile strain, the pores initially nucleate at the crack tip at a strain of 0.087, as in Fig. 7(a), and then more pores nucleate at the triple junctions or weak grain boundary junctions, as in Fig. 7(b). Under the effect of concentrated stress, the pores grow and expand and eventually transform into nanocracks along the grain boundaries, as in Fig. 7(c). Finally, the nanocracks connect with the main cracks, leading to a sudden increase in crack length, corresponding to the sharp increase in the length of the 4.5–12.0 nm GNG crack propagation curve at strains from 0.091 to 0.115 in Fig. 5(a). This formation of nanopores is associated with the decrease in grain boundary strength and increase in plasticity when the grain size decreases, and also leads to dislocation emission from neighboring grains and their propagation, as shown in the CAN plots in Fig. 7(c) and (d). Other researchers (Farkas29) have also observed the phenomenon of hole formation at grain boundaries at the crack tip. This indicates a shift in the crack propagation mode from rapid propagation along grain boundaries to propagation at grain boundaries where the main crack and pore connections occur while slowing down the rate of crack propagation.
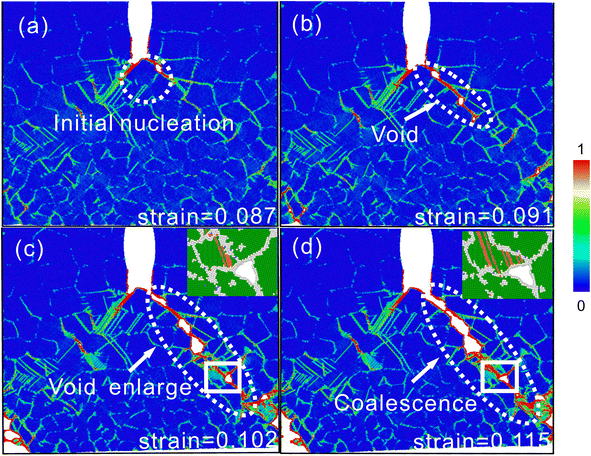 | ||
| Fig. 7 In the 4.5–12.0 nm GNG model, (a–c) the crack tip pores are enlarged and (d) the pores are connected to the main crack. | ||
As shown in Fig. 3 model IV shows the crack propagation of the 3.0–12.0 nm GNG model, the specific propagation is shown in Fig. 8. In the initial stage of crack propagation, at a strain of 0.092, a pore is formed at the crack tip and further combined with the main crack, which makes the crack undergo propagation, as shown in Fig. 8(a). With the increase of applied load, the crack propagation is blocked at the grain boundary at a strain of 0.110, and the crack tip is passivated, and the crack passivation relaxes the stress concentration near the crack tip, as shown in Fig. 8(b). At this time, the crack tip of the smaller size of the grain is subjected to shear force, the occurrence of grain boundary sliding and migration, this process is accompanied by the generation of dislocations, and then the material undergoes shear deformation, as shown in Fig. 8(c). In previous studies, Farkas29 has shown that cracks are stopped and blunted as they encounter boundaries in their path and that crack propagation is hindered by grain boundary sliding as well as other plastic mechanisms that contribute to material ductility, consistent with the results of this paper. As the tensile strain continues to increase, the shear continues to increase and the increase in dislocations makes the plastic deformation near the grain boundaries more severe. Therefore, as shown in Fig. 8(d), the grain boundaries are destroyed by more dislocations under shear stress, and eventually a plastic shear zone is formed, and the crack propagation mode changes to plastic shear fracture.
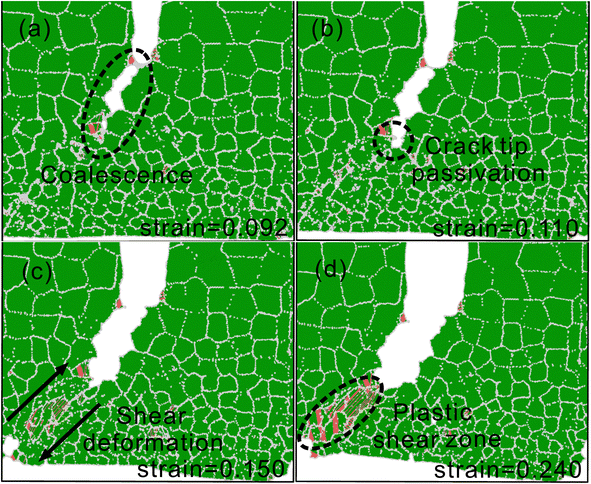 | ||
| Fig. 8 In the 3.0–12.0 nm GNG model, (a and b) crack propagation and its passivation, (c and d) occurrence of shear deformation and formation of plastic shear zone. | ||
Fig. 9(a) and (b) represent the variation in the number of Shockley dislocations in GNG Cu and NG Cu, respectively, which are mainly present in the plastic shear zone. From Fig. 9(a), it can be seen that the number of Shockley dislocations increases with increasing grain size gradient parameters in GNG models, especially in GNG Cu of 3.0–12.0 nm, where the plastic shear band is obvious and the number of Shockley dislocations is the largest. As shown in Fig. 9(b), the reduction of the average grain size also leads to an increase in the number of Shockley dislocations in the NG material, which corresponds to the apparent enhancement of the plastic shear bands when the grain size is reduced in Fig. 3, suggesting that the reduction of the grain size enhances the ductility of the material.
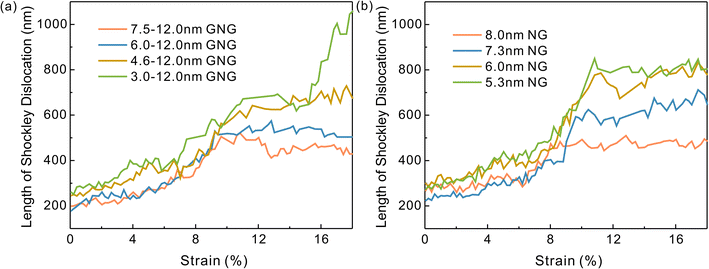 | ||
| Fig. 9 Variation curves of the length of the Shockley dislocation during crack propagation for the GNG model and the NG model (a) GNG model (b) NG model. | ||
Since the atoms at the grain boundaries behave in an amorphous state, the activity of the grain boundaries in the model can be expressed in terms of the change in amorphous atoms, which in this paper is expressed using the following equation:
| Pincrement = Ploaded − Pinitial | (3) |
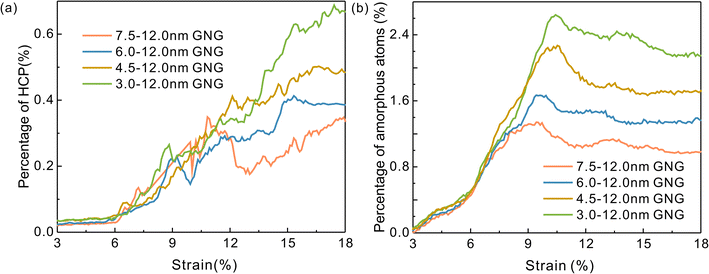 | ||
| Fig. 10 Variation of the percentage of (a) HCP atoms and (b) amorphous atoms in the GNG model with different grain size gradients. | ||
4. Conclusion
In this article, we simulate the crack propagation of GNG Cu with different grain size gradients and the respective corresponding NG models using molecular dynamics. By comparing the crack propagation of the GNG model and the NG model, we can draw the following conclusions:(i) As the grain size gradient increases in the GNG model, under tensile loading, the central crack undergoes a transition from rapid propagation along grain boundaries to propagation by formation of pores aggregates at grain boundaries, and then to propagation along the inclined plastic shear zone when tensile strain occurs, indicating that grain boundaries can (1) provide the brittle fracture behavior of the material (2) be the location of the nucleation of nanopore formations and (3) increase the fracture toughness as well as the ductility of the material through the motion of grain boundaries. In the NG model, smaller grain size produces better resistance to crack propagation as well as greater plasticity.
(ii) The weak ability of each GNG model to resist crack propagation relative to its corresponding NG model implies that the introduction of material grain size gradients can accelerate crack propagation and reduce the plastic properties of the material.
(iii) The cracking behavior of the different GNG models is mainly influenced by the grain boundary (GB) correlation mechanism. The larger the grain size gradient, the greater the resistance of the material to crack propagation, i.e., the ability of gradient nanomaterials to resist crack propagation increases when the grain boundary-related activity is enhanced.
Conflicts of interest
There are no conflicts to declare.Acknowledgements
This study was financially supported by the National Natural Science Foundation of China under Grant No. 62071433 and the Open Research Fund Program of Key Laboratory of Industrial Internet and Big Data, China National Light Industry, Beijing Technology and Business University under Grant IIBD-2020-KF06.References
- T. H. Fang, W. L. Li, N. R. Tao and K. Lu, Science, 2011, 331, 1587–1590 CrossRef CAS PubMed.
- J. Li, Q. Zhang, R. Huang, X. Li and H. Gao, Scr. Mater., 2020, 186, 304–311 CrossRef CAS.
- X. Wu, P. Jiang, L. Chen, F. Yuan and Y. T. Zhu, Proc. Natl. Acad. Sci. U. S. A., 2014, 111, 7197–7201 CrossRef CAS PubMed.
- M. Yang, Y. Pan, F. Yuan, Y. Zhu and X. Wu, Mater. Res. Lett., 2016, 4, 145–151 CrossRef CAS.
- J. Li, G. J. Weng, S. Chen and X. Wu, Int. J. Plast., 2017, 88, 89–107 CrossRef CAS.
- N. Yan, X. Lu, Z. Lu, H. Yu, F. Wu, J. Zheng, X. Wang and L. Zhang, J. Magnesium Alloys, 2022, 10, 3542–3552 CrossRef CAS.
- J. Xue, S. Jiang, C. Lei, H. Chang, J. Gao, X. Liu, Q. Li and Q. Shen, Nano Res., 2022, 16, 2259–2270 CrossRef.
- K. S. Raja, S. A. Namjoshi and M. Misra, Mater. Lett., 2005, 59, 570–574 CrossRef CAS.
- S. Jelliti, C. Richard, D. Retraint, T. Roland, M. Chemkhi and C. Demangel, Surf. Coat. Technol., 2013, 224, 82–87 CrossRef CAS.
- K. Lu and J. Lu, Mater. Sci. Eng., A, 2004, 375–377, 38–45 CrossRef.
- S. Q. Deng, A. Godfrey, W. Liu and N. Hansen, Scr. Mater., 2016, 117, 41–45 CrossRef CAS.
- Z. Cheng, H. Zhou, Q. Lu, H. Gao and L. Lu, Science, 2018, 362, eaau1925 CrossRef PubMed.
- W. Qiang, Q. Wu and L. Long, Phys. Status Solidi A, 2023, 220, 2200762 CrossRef CAS.
- Z. Cheng, L. Bu, Y. Zhang, H. Wu, T. Zhu and L. Lu, Acta Mater., 2023, 246, 118673 CrossRef CAS.
- C.-Y. He, X.-F. Yang, H. Chen, Y. Zhang, G.-J. Yuan, Y.-F. Jia and X.-C. Zhang, Mater. Today Commun., 2022, 31, 103198 CrossRef CAS.
- Y. Zhu and X. Wu, Mater. Res. Lett., 2019, 7, 393–398 CrossRef.
- P. Cao, Nano Lett., 2020, 20, 1440–1446 CrossRef CAS PubMed.
- L. Jing, Q. Pan, J. Long, N. Tao and L. Lu, Scr. Mater., 2019, 161, 74–77 CrossRef CAS.
- L.-J. Jing, Q.-S. Pan and L. Lu, Adv. Eng. Mater., 2019, 22, 1900554 CrossRef.
- P. Wang, X. Yang and X. Tian, J. Mater. Res., 2015, 30, 709–716 CrossRef CAS.
- F. Yang and W. Yang, J. Mech. Phys. Solids, 2009, 57, 305–324 CrossRef CAS.
- X. Li, J. Zhao, X. Zhang and X. Jiang, Int. J. Solids Struct., 2019, 172–173, 1–9 Search PubMed.
- Y. Liu, F. Yang, X. Zhang, J. Zhang and Z. Zhong, Int. J. Fract., 2022, 233, 71–83 CrossRef.
- E. Asadi, M. Asle Zaeem, S. Nouranian and M. I. Baskes, Acta Mater., 2015, 86, 169–181 CrossRef CAS.
- Y. Mishin, M. J. Mehl, D. A. Papaconstantopoulos, A. F. Voter and J. D. Kress, Phys. Rev. B: Condens. Matter Mater. Phys., 2001, 63, 224106 CrossRef.
- A. Stukowski, Modell. Simul. Mater. Sci. Eng., 2010, 18, 015012 CrossRef.
- A. Stukowski, V. V. Bulatov and A. Arsenlis, Modell. Simul. Mater. Sci. Eng., 2012, 20, 085007 CrossRef.
- J. D. Honeycutt and H. C. Andersen, J. Phys. Chem., 1987, 91, 4950–4963 CrossRef CAS.
- D. Farkas, Metall. Mater. Trans. A, 2007, 38, 2168–2173 CrossRef.
| This journal is © The Royal Society of Chemistry 2024 |

