 Open Access Article
The use of banana peel as a low-cost adsorption material for removing hexavalent chromium from tannery wastewater: optimization, kinetic and isotherm study, and regeneration aspects†
Bereket Amehaa,
Talbachew Tadesse Nadew *b,
Tsegaye Sissay Tedlac,
Belay Getyed,
Destaw Agumass Mengiea and
Shiferaw Ayalnehc
aDepartment of Chemical Engineering, Faculty of Chemical and Food Engineering, Bahir Dar Institute of Technology, Bahir Dar University, Bahir Dar, Ethiopia
bDepartment of Chemical and Food Engineering, Kombolcha Institute of Technology, Wollo University, Dessie, Ethiopia. E-mail: talewtadesse4897@gmail.com
cDepartment of Chemical Engineering, College of Biological and Chemical Engineering, Addis Ababa Science and Technology University, Addis Ababa, Ethiopia
dDepartment of Industrial Chemistry, College of Applied Science, Addis Ababa Science and Technology University, Addis Ababa, Ethiopia
First published on 23rd January 2024
Abstract
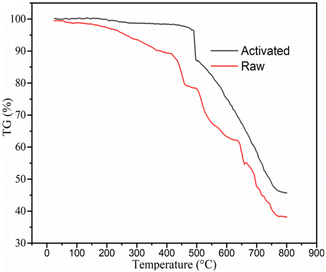
When the concentration of hexavalent chromium (Cr(VI)) in the environment is greater than a certain limit, it becomes a global concern. Thus, the aim of this study was to use banana peel as an adsorbent to remove heavy metals, specifically Cr(VI) ions from wastewater. Banana peel (BP) was activated in a furnace for 2 h (h) at 450 °C and 50% humidity. Subsequently, the activated BP was characterized by proximate analysis, elemental analysis, scanning-electron microscopy (SEM), X-ray diffraction (XRD), Fourier transform infrared spectroscopy (FTIR), Brunauer Emmett Teller (BET) analysis, and thermogravimetric analysis (TGA). According to the characterization results, the activated BP possessed a porous surface and high surface area of 200 m2 g−1, which are important adsorption parameters. Additionally, the removal efficiency for Cr(VI) was evaluated in terms of pH, contact time, initial concentration, and adsorbent dose. Consequently, the optimal operating conditions for removing 94% of Cr(VI) were found to be an adsorption time of 92 min, adsorbent dose of 1.5 g L−1, pH of 3, and initial Cr(VI) concentration of 38 mg L−1. In addition, the adsorption kinetics and isotherms were examined. The pseudo-first-order model with an R2 of 0.996 and the Langmuir isotherm with an R2 of 0.997 were found to be the most effective mathematical representations of the rate and nature of Cr(VI) adsorption on the surface of the activated BP, respectively. Furthermore, it was discovered that the activated BP could be reused six times before its removal efficiency was reduced to less than 70%.
1. Introduction
Hazardous compounds have spread in the aquatic environment at an unprecedented rate as a result of the global Industrial Revolution.1 Specifically, various manufacturing sites are responsible for polluting fresh water and the ecosystem with their wastewater containing different heavy metals,2 including the leather tanning, electronics, metal finishing, electroplating industries, if they discharge their effluents without treatment.3Heavy metals are also present in water bodies as a result of home and agricultural contaminants. Besides, various inorganic and organic contaminants are present in the effluents of industries. Heavy metals, for example, alter the chemical composition of diverse water sources, while also posing a major health risk due to their toxicity.4,5 Large amounts of heavy metals such as lead (Pb), zinc (Zn), copper (Cu), arsenic (As), cadmium (Cd), chromium (Cr), nickel (Ni), and mercury (Hg) are among the heavy metals from various industries that are the most concerning.6,7 Thus, contamination with these heavy metals has become a significant issue globally. Although humans require trace amounts of heavy metals such as copper and zinc, high levels of these metals can be dangerous.8
Naturally, heavy metals can be found immobilized in sediments and as ores. However, due to anthropogenic activity, there is an increase in heavy metal deposition in the aquatic and terrestrial environments as a result of these metals becoming mobilized and released as well as natural biogeochemical cycles being upset.9 Hexavalent chromium is one of the many heavy metals that contaminates water from the paint, alloying, animal hide tanning, textile, dye, pigment, ceramic glaze, refractory brick, and pressure-treated wood industries.10 Thus, because of the extensive anthropogenic use of chromium, its environmental pollution is increasing. This pollutant causes various diseases, including cancer, nephritis, gastrointestinal ulceration, and perforation in a partition of the nose, affect the central nervous system and cause respiratory issues and lung tumors when inhaled.8,11 Thus, chromium-containing effluents requires treatment before their discharge in the environment due to their carcinogenic and mutagenic properties. In this case, adsorption via activated carbon (AC) is a popular and effective method for treating wastewater that contains metals such as chromium.12
To date, a variety of methods have been developed for the removal of chromium from wastewater, including coagulation, flocculation, membrane processes, ion exchange, and chemical precipitation. However, these methods are limited, given that they often involve high capital and operational costs. Also, most of these methods are not suitable for application on a small scale because of their high operational costs and use of excess chemicals and disadvantages such as incomplete metal removal and production of sludge.13
Currently, most industries release wastewater containing heavy metals, which can be absorbed in living tissues, causing various disorders.14 There are numerous sources of waste biomass in nature with reported adsorption properties, including rice husk, sawdust, tea and coffee waste, orange peel, peanut shells, dry tree leaves, and bark.15 Among the different categories of adsorbents, BP seems to be a suitable adsorbent because of its low cost and environmentally friendly nature. Because of the excess BP waste worldwide, it is considered to be a low-cost adsorbent with promising application for the remediation of a variety of contaminants. BP has diverse functional groups, which enable the high sorption of various cationic and anionic substances on its surface active sites.16 However, although the use of BP for adsorption was previously studied, the potential of activated BP in treating actual tannery wastewater has not been reported to date. To the best of our knowledge, there are no studies in the literature on the removal of chromium from actual industrial wastewater using BP; however, the majority of current research has demonstrated the application of banana peel for the removal of specific heavy metals and dye from a standard solution.
An inexpensive and eco-friendly material for the possible removal of chromium from wastewater is activated BP. This study aimed to synthesize activated BP from BP and examine its potential application as an adsorbent for the removal of hexavalent chromium from tannery wastewater. The primary motivations for removing heavy metals from contaminated wastewater are to protect the environment and prevent human health concerns caused by direct emissions from various industrial processes. Furthermore, this study has the potential to reduce the threat of industrial wastewater polluted with Cr(VI) to human help and equip the community with a simple and cheap technique for treating water.
2. Materials and methods
2.1 Raw materials and chemicals
The raw BP sample was collected from the surrounding garbage using a polyethylene bag. The chromium-containing wastewater required for the study was obtained from the Batu Leather Industry, which is located around Akaki Kality Sub-city, Addis Ababa, Ethiopia. The chemicals used were sodium hydroxide (NaOH) (98%, Sigma-Aldrich, USA), hydrochloric acid (HCl) (37%, Sigma-Aldrich, USA), phosphoric acid (H3PO4), potassium dichromate (K2Cr2O7) (99.9%, Sigma-Aldrich, USA), and 1,5-diphenylcarbazide (C13H14N4O) (98.0%, Sigma-Aldrich, USA). These chemicals were purchased from commercial sources in Addis Ababa, Ethiopia, and used as received without further purification.2.2 Methods
| Varying parameter | Parameter level | Fixed parameter |
|---|---|---|
| Activation time (h) | 1–3 | 450 °C and 50% of acid concentration |
| Activation temperature (°C) | 350–550 | 2 h time and 50% of acid concentration |
| Acid concentration (%) | 10–90 | 2 h time and 450 °C temperature |
After carefully washing and rinsing each sample by vacuum filtration with hot distilled water to remove all the excess acid, the pH of the filtrate was roughly 7.0. Then, it was dried for 24 h at 105 °C in an oven and stored in a desiccator for additional analysis.17 To study the effect of the activation parameters on BP, 40 mg L−1 hexavalent chromium solution was absorbed on the surface of 1.5 g L−1 BP. The contact time and pH were kept at 90 min and 3, respectively. The removal efficacy was quantified using a UV-spectrophotometer and calibration curve.
2.3 Characterization
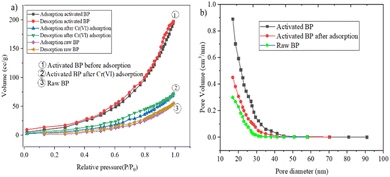
![[thin space (1/6-em)]](https://www.rsc.org/images/entities/char_2009.gif) 000 series) surface area analyzer was used to determine the surface area of the adsorbent. The procedure and operation involved using 0.8 g of sample, and then heating it at a temperature of 110 °C for 2 h to remove the moisture content. Then, the sample was weighed again after cooling, and its weight recorded. The prepared sample was transferred to the surface area test part of the BET. The pore size distribution was determined using the Barrett–Joyner–Halenda method. The surface area of the sample was calculated using the nitrogen adsorbed–desorbed multipoint data and the surface area of a single nitrogen molecule.19
000 series) surface area analyzer was used to determine the surface area of the adsorbent. The procedure and operation involved using 0.8 g of sample, and then heating it at a temperature of 110 °C for 2 h to remove the moisture content. Then, the sample was weighed again after cooling, and its weight recorded. The prepared sample was transferred to the surface area test part of the BET. The pore size distribution was determined using the Barrett–Joyner–Halenda method. The surface area of the sample was calculated using the nitrogen adsorbed–desorbed multipoint data and the surface area of a single nitrogen molecule.192.4 Batch adsorption experiments on activated BP
To investigate the chromium adsorption capacity of the activated BP under different operating conditions, one variable at a time (OVAT) and response surface methodology (RSM) experiments were performed. The results of OVAT were used as the feed for the interaction effects. The parameter interaction effects on the adsorption processes were investigated using RSM and CCD (central composite design).26After reviewing various articles in the literature, four parameters (contact time, adsorbent dose, pH, and initial chromium concentration) were considered to have a high influence on adsorption processes, and thus chosen to for the experiment. To analyze the effect of each variable, the chemicals used in UV-spectrophotometry were prepared following ASTM standard procedures.
2.5 Preliminary study on the effect of the adsorption parameters
Using the one variable-at-a-time approach, the effect of each parameter on the chromium adsorption uptake capacity of the activated carbon products was investigated. Specifically, adsorption times in the range of 30–210 min, pH values of 1–7, adsorbent load of 0.5 to 3.5 g L−1, and initial chromium concentration of 20–80 mg L−1 were considered. Only the effect of one variable was investigated in this approach, while the others were kept constant. Hence, by changing the adsorption time from 30 to 210 min at 30 min intervals and fixing the pH at 3, adsorbent dose at 1.5 g L−1, and chromium concentration at 40 mg L−1, the effect of the time on the adsorption process of chromium with activated BP was studied.28 Similarly, the effect of each adsorption process parameter under different conditions was investigated in their respective range (Table 2).| Factor | Level of parameters | ||||||
|---|---|---|---|---|---|---|---|
| Time (min) | 30 | 60 | 90 | 120 | 150 | 180 | 210 |
| pH | 1 | 2 | 3 | 4 | 5 | 6 | 7 |
| Adsorbent dose (g L−1) | 0.5 | 1 | 1.5 | 2 | 2.5 | 3 | 3.5 |
| Initial concentration (mg L−1) | 20 | 30 | 40 | 50 | 60 | 70 | 80 |
The adsorption process was performed in Erlenmeyer flasks, in which the adsorbate and adsorbent were allowed to contact at a fixed magnetic agitation of 300 rpm. After passing the filtrate through Whatman filter paper, the amount of residual chromium was measured. The removal efficiency of activated BP was determined using eqn (1). The concentration of hexavalent chromium (Cr(VI)) after the adsorption was determined using a UV-spectrophotometer and a calibration curve. Each experiment in the spectroscopy analyses was conducted by pouring the filtrate into a cuvette and adding diphenyl carbazide solution dropwise to specifically quantify the available hexavalent chromium in the solution.28
 | (1) |
2.6 Model evaluation using RSM-CCD to study interaction effects
Several experiments were carried out to determine the interaction effects of the operational parameters simultaneously. Consequently, the preliminary data screening was used to determine the appropriate range of parameters and develop the experimental design using RSM-CCD (Table 3). Subsequently, statistical evaluations were performed to determine the correctness of the model. Next, the system output was adjusted and optimized using the model to yield the best possible outcome given the available operational parameters, which was designed to highlight any potential relationships among the operating parameters.| Factor | Factor code | Level of parameters | |
|---|---|---|---|
| Lower | Upper | ||
| Adsorption time (min) | X1 | 60 | 120 |
| pH | X2 | 2 | 4 |
| Adsorbent dose (g L−1) | X3 | 1 | 2 |
| Initial conc. (mg L−1) | X4 | 30 | 50 |
The total number of experiments required for ‘n’ independent parameters is 2n + 2n + c, where c denotes the center point in the experiment.29 Therefore, a total of 30 experimental runs was conducted separately for the experimental response of chromium removal efficiency and to discover the optimum conditions with six center-point experiments. Each experiment was conducted twice and average results were utilized. A mathematical model was selected to correlate the removal efficiency with all the factors. A quadratic model created by the Design Expert software was used to analyze the response surface regression for the design response, as given in eqn (2).
| Y = β + α1X1 + α2X2 + α3X3 + α4X4 + b1X1X2 + b2X1X3 + b3X1X4 + b4X2X3 + b5X2X4 + b6X3X4 + c1X12 + c2X22 + c3X32 + c4X42 + ξ | (2) |
2.7 Parameter optimization and evaluation of model performance
Statistical tests were performed with analysis of variance (ANOVA) and correlation coefficient (R2) to evaluate the model equation performance and significance. To achieve a high removal efficiency using the activated BP, parameters such as time, adsorbent dose, pH, and Cr(VI) concentration were optimized through numerical optimization. The criteria set to solve the optimization are shown in Table 4. The optimal conditions were validated and confirmed with triplicate experimental data, and then the error was determined.| Parameter | Criteria | Lower limit | Upper limit | Importance |
|---|---|---|---|---|
| Time | Minimum | 60 | 120 | 3 |
| pH | In a range | 2 | 4 | 3 |
| Adsorbent dose | Minimum | 1 | 2 | 3 |
| Initial concentration | In a range | 30 | 50 | 3 |
| Removal efficiency | Maximum | 38 | 94 | 3 |
2.8 Kinetics of adsorption and isotherm studies
To examine the rate of Cr(VI) adsorption on the activated BP and to mathematically model the adsorption process, the kinetics and isotherm models of well-known models were studied.
 | (3) |
| qt = qe (1 − e−k1t) | (4) |
 | (5) |
k1 and k2 are the adsorption rate constant in min−1 and g mg−1 min−1, respectively. The adsorbate at equilibrium (qe) was calculated using eqn (6).35
 | (6) |
According to the non-linear curve of t versus qt, all the kinetic parameters (k1, k2 and qe) were determined.
In the adsorption isotherm experiments, 500 mL of various initial Cr(VI) concentrations of 20, 40, 60, 80, 100, and 120 mg L−1 as the adsorbate were mixed with 1.5 g L−1 of adsorbent at a pH of 3.0. The adsorption process was carried out by stirring for 5 h using a magnetic stirrer. Following each adsorption, the adsorbent was filtered, the equilibrium concentrations were ascertained by UV spectroscopy, and the analogous amount of adsorbate at equilibrium (qe) was computed. The non-linear equation for the Langmuir isotherm model is provided by eqn (7).
| qe = qmax (KLCe)/(1 + KLCe) | (7) |
Furthermore, eqn (8) represents the non-linear Freundlich isotherm model to which the experimental data was fitted.
| qe = KFCe1/n | (8) |
2.9 Recyclability study
Desorption and adsorbent regeneration studies were performed in a beaker, where 1.5 g adsorbent was mixed with 100 mL solution and shaken for 2 h at 300 rpm. The precipitate was collected and rinsed with distilled water repeatedly until the filtrate pH was 7.0. Subsequently, the Cr(VI)-loaded adsorbent was soaked for 2 h in a 400 mL, 0.05 M NaOH solution. Then, the adsorbent was collected and used again for adsorption. The UV-vis spectra at 540 nm were recorded to examine the supernatant solutions.40 The adsorption and desorption operations were repeated seven times in total.3 Results and discussion
3.1 The removal efficiency of activated BP
BP was activated at different activation times in the range of 1–3 h, with activation temperatures in the range of 350 °C to 550 °C and phosphorus acid concentration in the range of 10% to 90%. The activation process was conducted by changing one variable and keeping the other two parameters constant (Fig. 1(a)–(c)). The removal efficiency of the activated BP as a function of activation time of 1, 1.5, 2, 2.5, and 3 h at an activation temperature of 450 °C and 50% phosphoric acid is shown in Fig. 1(a). The results unequivocally demonstrate that when the activation time increased from 1 h to 2 h, the efficiency of the activated BP increased from 78% to 98.2%. After 2 h, the removal efficacy surged slightly, and then remained almost constant. This showed that the activation process improves the adsorption performance of the activated banana peel. This may be due to the removal of volatile components in BP as it was subjected to a prolonged activation time at 450 °C. Besides, it seems that the surface area of the activated BP increased as a result of the porosity created when the volatile components evaporated.41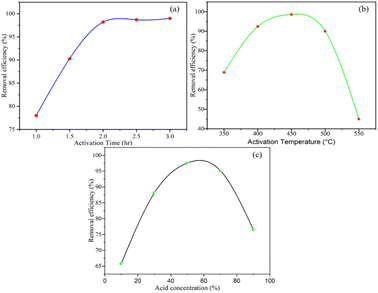 | ||
| Fig. 1 Removal efficiency as a function of (a) activation time, (b) activation temperature, and (c) acid concentration. | ||
The removal efficacy of the adsorbent with respect to activation temperature in the range of 350 °C to 550 °C at an activation time of 2 h and 50% acid concentration is described in Fig. 1(b). The effectiveness of the activated BP increased from 69% to 98.6% when the activation temperature varied from 350 °C to 450 °C and declined to 45% as the activation temperature further increased to 550 °C. This experiment revealed that the activation temperature has a positive and negative effect on the adsorption capacity of the activated BP. Activating BP at a temperature of 450 °C increased its surface area, and thus its removal ability. However, its performance declined at higher temperatures, as can be observed in Fig. 1(b). The lower removal efficiency of activated BP at higher temperatures can be attributed to the decomposition of the sample at activation temperatures higher than 450 °C.42
Fig. 1(c) depicts the removal efficacy of the activated BP as a function of phosphoric acid concentration. At a temperature of 450 °C and activation time of 2 h, the efficiency was determined in acid concentrations in the range of 10–90%. Fig. 1(c) shows that as the acid concentration changed from 10% to 50%, the removal efficiency of the activated BP increased from 66% to 97.6%. When the acid concentration increased to 90%, the performance of the activated BP dropped dramatically to 76.5%. The increased removal efficiency indicates that the acid reacts with the impurities and washes them out. However, due to the reactive nature of strong acid, BP lost its adsorption properties at higher acid concentrations, i.e., above 60%.43
Besides the interactive effect of each parameter of the activation process of BP, it can be deduced from these experiments that the best activated BP was produced at an activation time of 2 h, activation temperature of 450 °C, and acid concentration of 50%. Accordingly, BP specifically activated at 2 h, 450 °C, and 50% acid was characterized for further application.
3.2 Characteristics of adsorbent (activated BP) and raw BP
The raw and chemically and thermally activated BP were characterized using different techniques, namely, proximate analyses, SEM, BET, and FTIR.| Parameter | Result (%) | |
|---|---|---|
| Raw | Activated | |
| Moisture content | 9.2 ± 0.02 | 6.1 ± 0.02 |
| Volatile content | 18 ± 0.01 | 15.93 ± 0.03 |
| Ash content | 5 ± 0.04 | 4.5 ± 0.05 |
| Fixed carbon | 67.8 ± 0.03 | 73.47 ± 0.04 |
| Element | Elemental composition (%) | |
|---|---|---|
| Raw BP | Activated BP | |
| a diff. = 100 − (C + H + N + S). | ||
| Carbon (C) | 44.54 | 64.67 |
| Hydrogen (H) | 7.24 | 3.74 |
| Nitrogen (N) | 1.26 | 1.24 |
| Sulfur (S) | 0.053 | 0.048 |
| Oxygen (O)diff. | 46.91 | 30.302 |
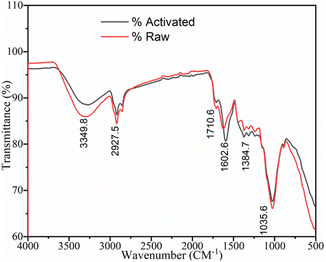
![[double bond, length as m-dash]](https://www.rsc.org/images/entities/char_e001.gif) C stretching group, O–H bending phenol, and C–N amine group in the sample is indicated by the medium-intensity peaks located at 1602.6, 1384.7, and 1035.6 cm−1, respectively. More precisely, the transition of one or more strong peak patterns to weak peak patterns may indicate that some or all the compounds, including water, were eliminated during the calcination process. The two spectra have a similar pattern but differ in the number of functional groups available. These results are also consistent with the recent studies by T. A. Aragaw and others, who recorded the spectra of raw and activated BP, matching with the spectra in the present study.48–50
C stretching group, O–H bending phenol, and C–N amine group in the sample is indicated by the medium-intensity peaks located at 1602.6, 1384.7, and 1035.6 cm−1, respectively. More precisely, the transition of one or more strong peak patterns to weak peak patterns may indicate that some or all the compounds, including water, were eliminated during the calcination process. The two spectra have a similar pattern but differ in the number of functional groups available. These results are also consistent with the recent studies by T. A. Aragaw and others, who recorded the spectra of raw and activated BP, matching with the spectra in the present study.48–50
3.3 RSM-CCD experiment and parameter optimization
An initial investigation was carried out on the one variable-at-a-time method for the removal of Cr(VI) by adsorption utilizing the activated BP and the interactive influence of process variables such as contact time, pH, adsorbent dosage, and initial concentration. Nature, especially regarding adsorption, does not work based on one set of parameters. Specifically, the parameters defining the process are interactive, with each variable influencing the others and the process as a whole. Thus, the effect of all the relevant parameters must be considered.The chromium adsorption capacity of the activated BP as parameterized by the variables was determined by conducting the adsorption process on its surface. Subsequently, the trace amount of Cr(VI) remaining was quantified using UV-spectroscopy. The concentration was determined based on the standard calibration curve.
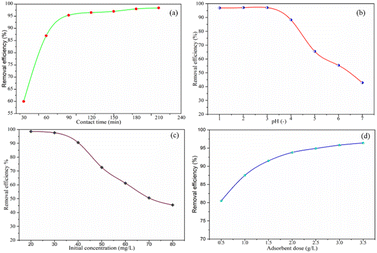 | ||
| Fig. 8 Cr(VI) removal efficiency of activated BP with (a) contact time, (b) pH, (c) initial concentration and (d) adsorbent dose. | ||
3.3.1.1 Effect of contact time. The effect of contact time on the hexavalent chromium adsorption process on the surface of the activated BP at various times in the range of 30–210 min at 30 min intervals was studied at a fixed adsorbent dose of 1.5 g L−1, pH of 3, and chromium initial concentration of 40 mg L−1. As depicted in Fig. 8(a), the chromium removal efficacy of the activated BP increased from 30% to 95% as the contact time increased from 20 to 60 min. However, as the adsorption duration was prolonged from 90 to 210 min, the removal efficiency increased slightly, and then tended to be constant. This may be the adsorption equilibrium point was approaching, and finally attained. This indicates that all, if not most of the surface available for hexavalent chromium is occupied. Moreover, the adsorption process is expected to slow down with time, and thus the driving force for adsorption decreases.41
3.3.1.2 Effect of pH. The effect of pH on the adsorption process of hexavalent chromium on the surface of the acid-activated BP at pH of 1.0, 2.0, 3.0, 4.0, 5.0, 6.0, 6.0, and 7.0 was studied at a fixed adsorbent dose of 1.5 g L−1, contact time of 90 min, and initial chromium concentration of 40 mg L−1. Fig. 8(b) shows that the activated BP has the highest chromium removal efficiency at around pH 1 and 3, which is approximately 98%. As the pH increased to 7, the removal efficiency decreased to 44%. Thereafter, the removal efficiency remained almost constant. The dependence of adsorption on pH is largely determined by the type and ionic state of the surface functional groups in the adsorbent and the metal chemistry in the solution.53
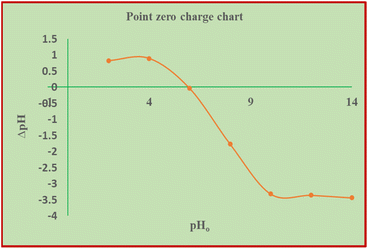
According to Afshin et al.,28 at low pH, bichromate and dichromate become the predominant species in solution. Given that the point of zero charge of the solution is 5.83 pH, the charge of the adsorbent is positive at low pH and negative at higher pH. Therefore, OH− ions seem to compete with the chromate ions when the pH increases, which causes the Cr(VI) adsorption capacity to decline sharply. Similarly, Gue et al. and other researchers discussed that Cr(VI) adsorption is more favorable at low pH values, preferably not more than pH 3.29,54–56 When the pH exceeds 5.83, the amount of hydroxyl ions in the solution increases and metal ions react and precipitate with the OH− ions, making biosorption impossible.57 Therefore, the optimum pH seems to be in the vicinity of pH 2 to 3, given that a recent article stated that Cr6+ adsorption is more effective in acidic solution.58
3.3.1.3 Effect of initial concentration. At a fixed time of 90 min, pH of 3, and adsorbent dose of 1.5 g L−1, the impact of the initial concentration of hexavalent chromium on the process of adsorption on the surface of the activated BP at 20, 30, 40, 50, 60, 70, and 80 mg L−1 was investigated. The chromium removal versus chromium initial concentration is shown in Fig. 8(c). As observed, when the initial concentration increased from 20 to 80 mg L−1, the chromium removal efficiency rapidly decreased from 98.2% to 45%. The apparent reason for this decrease in efficiency with concentration is the disproportionate amount of adsorbent available for the adsorption of chromium. The graph shows that 1.5 g L−1 adsorbent is capable of adsorbing about 90% of chromium molecules when the concentration is below 40 mg L−1. In this case, given that the amount of adsorbent remained constant at 1.5 g L−1, it is inevitable that the removal efficiency sharply decreased with an increase in the concentration of chromium beyond 45 mg L−1. This indicates that 1.5 g L−1 adsorbent at the given adsorption time and pH exceeds its adsorbing capacity limit at higher initial concentrations of chromium.
3.3.1.4 Effect of adsorbent dose. The impact of the dosage of the adsorbent on the adsorption process of hexavalent chromium using the activated BP at 0.5, 1.0, 1.5, 2.0, 2.5, 3.0, and 3.5 g L−1 was studied at a fixed contact time of 90 min, pH of 3 and chromium initial concentration of 40 mg L−1. Fig. 8(d) shows the removal efficiency with the adsorbent dose. The removal efficiency of the activated BP increased from 80% to 94% as the adsorbent dose increased from 1 to 2 g L−1. It is expected that the removal efficiency will increase with an increase in the adsorbent dose, where the amount of chromium adsorbed increases with the amount of adsorbent. This is because when the amount of adsorbent increases, there will be more space (surface) available for chromium molecules. Nevertheless, there are always limitations, including mass transfer and adsorption affinity, in this physical phenomenon to remove (adsorb) all the chromium in the solution. There was a decrease in the removal efficiency when the dosage was low. This may be owing to the small surface availability for adsorption. The adsorbent would adsorb proportional chromium and reach a point after which no further adsorption could occur. The excess chromium leftover certainly affects the efficiency. Thus, it can be inferred from the graph that it is uneconomical to use doses of 2.5 and 3 g L−1 given that the removal showed a change of less than 1%.
3.3.2.1 Model fitting and ANOVA. The Design Expert software builds a mathematical model that depicts the response as a function of the relevant variables using experimental data and non-linear regression. Next, process variables are optimized and 3D surface plots are produced using this model. The created mathematical model was statistically assessed considering the experimental data to determine whether it accurately captures the process in terms of the variables considered. The P-value and R2 (coefficient determination) values describe how significant the model fit is. A significant and close relationship between the model-predicted response and the experimental data is indicated by a model with P values less than 0.05 and an R2 near unity. Among the models proposed by the software, the quadratic model gave the best fit with a P-value of 0.0001 and R2 value of 0.983. Eqn (9) presents the equation in quadratic form that predicts the hexavalent chromium removal efficiency of the activated BP as a function of initial chromium concentration, adsorbent dose, pH, and contact time.
| RE (%) = 25.1554 + 0.6339 × A + 13.3566 × B + 88.1102 × C + 0.1560 × D − 0.0016 × AB − 0.0277 × AC + 0.0150 × AD + 2.6460 × BC + 0.2230 × BD + 0.0.3822 × CD − 0.0048 × A2 − 5.3104 × B2 − 33.1485 × C2 − 0.0418 × D2 | (9) |
The statistical significance of the main parameters and interaction terms was assessed using the P-values and F-values (Table 7). It can be seen from Table 7 that the independent variables are all significant and some of the interactive terms are also significant.
| Source | Sum of squares | df | Squares mean | F value | P-value prob > F | |
|---|---|---|---|---|---|---|
| Model | 7549.15 | 14 | 539.22 | 63.62 | <0.0001 | Significant |
| A | 2176.20 | 1 | 2176.20 | 256.78 | <0.0001 | |
| B | 797.83 | 1 | 797.83 | 94.14 | <0.0001 | |
| C | 529.22 | 1 | 529.22 | 62.44 | <0.0001 | |
| D | 853.00 | 1 | 853.00 | 100.65 | <0.0001 | |
| AB | 0.0384 | 1 | 0.0384 | 0.0045 | 0.9472 | |
| AC | 2.78 | 1 | 2.78 | 0.3275 | 0.5756 | |
| AD | 325.15 | 1 | 325.15 | 38.37 | <0.0001 | |
| BC | 28.01 | 1 | 28.01 | 3.30 | 0.0891 | |
| BD | 79.53 | 1 | 79.53 | 9.38 | 0.0079 | |
| CD | 58.43 | 1 | 58.43 | 6.89 | 0.0191 | |
| A2 | 520.18 | 1 | 520.18 | 61.38 | <0.0001 | |
| B2 | 773.49 | 1 | 773.49 | 91.27 | <0.0001 | |
| C2 | 1883.70 | 1 | 1883.70 | 222.26 | <0.0001 | |
| D2 | 480.02 | 1 | 480.02 | 56.64 | <0.0001 | |
| Residual | 127.13 | 15 | 8.48 | |||
| Lack of fit | 126.86 | 10 | 12.69 | 241.64 | 0.05141 | Not significant |
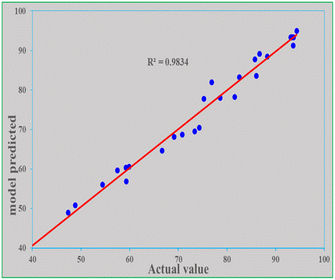
It is expected that the mathematical model-predicted response (removal efficiency) values and the actual values found from experimental data will be close. Both values were similar in this study because the R2 is close to unity (0.983) and the P-value is less than 0.0001. The adjusted R2 is 0.968 and the predicted R2 is 0.905. The actual and predicted values along the four parameters are shown in Table 8. To further compare both the model-predicted and actual values, a graph of predicted values as a function of actual values was drawn, as depicted in Fig. 9. The R2 of 0.983 of the graph indicates that the two values are reasonably close.
| Run | A: time (min) | B: pH | C: adsorbent dose (g L−1) | D: initial concentration (mg L−1) | Removal efficiency (%) | |
|---|---|---|---|---|---|---|
| Actual | Predicted | |||||
| 1 | 60 | 4 | 1 | 30 | 57.43 | 59.70 |
| 2 | 120 | 4 | 1 | 50 | 69.09 | 68.20 |
| 3 | 60 | 2 | 1 | 30 | 81.54 | 78.24 |
| 4 | 60 | 2 | 2 | 50 | 59.19 | 60.42 |
| 5 | 30 | 3 | 1.5 | 40 | 59.29 | 56.90 |
| 6 | 120 | 2 | 1 | 50 | 78.60 | 78.01 |
| 7 | 60 | 4 | 2 | 50 | 54.39 | 56.09 |
| 8 | 90 | 3 | 1.5 | 40 | 93.10 | 93.36 |
| 9 | 60 | 2 | 1 | 50 | 47.33 | 49.02 |
| 10 | 90 | 3 | 1.5 | 60 | 66.64 | 64.70 |
| 11 | 90 | 3 | 1.5 | 40 | 93.59 | 93.36 |
| 12 | 90 | 3 | 1.5 | 40 | 93.30 | 93.36 |
| 13 | 120 | 2 | 2 | 50 | 85.75 | 87.75 |
| 14 | 60 | 4 | 1 | 50 | 39.69 | 39.40 |
| 15 | 90 | 3 | 0.5 | 40 | 48.80 | 50.82 |
| 16 | 120 | 4 | 2 | 30 | 75.26 | 77.85 |
| 17 | 120 | 2 | 2 | 30 | 93.59 | 91.29 |
| 18 | 90 | 5 | 1.5 | 40 | 59.88 | 60.59 |
| 19 | 60 | 4 | 2 | 30 | 70.76 | 68.75 |
| 20 | 90 | 3 | 1.5 | 40 | 93.30 | 93.36 |
| 21 | 150 | 3 | 1.5 | 40 | 94.28 | 94.99 |
| 22 | 90 | 3 | 1.5 | 40 | 93.20 | 93.36 |
| 23 | 120 | 4 | 1 | 30 | 74.28 | 70.47 |
| 24 | 120 | 2 | 1 | 30 | 86.63 | 89.20 |
| 25 | 90 | 1 | 1.5 | 40 | 86.04 | 83.65 |
| 26 | 90 | 3 | 1.5 | 20 | 88.30 | 88.55 |
| 27 | 90 | 3 | 1.5 | 40 | 93.69 | 93.36 |
| 28 | 90 | 3 | 2.5 | 40 | 73.30 | 69.60 |
| 29 | 120 | 4 | 2 | 50 | 82.52 | 83.22 |
| 30 | 60 | 2 | 2 | 30 | 76.83 | 82.00 |
3.3.2.2 Interaction effect of variables. The relationship between pH and adsorption time and removal efficiency of the activated BP in the event of adsorbing hexavalent chromium solution is shown in Fig. 10(a)–(c). Fig. 10(a) shows the surface plot of removal efficiency versus pH and contact time. At an initial concentration of 40 mg L−1 and adsorbent dose of 1.5 g L−1, it displays the interaction effect of pH and contact time. It was found that when the pH decreased from 4 to 3 and the contact time increased from 60 to 90 min, the removal efficiency increased from 69% to 93.5%. Above pH 3 and contact time of 90 min, the removal efficiency remained slightly constant. Thus, it can be inferred that the removal efficiency seems to have favorable operating conditions with pH of 3 and adsorption time of 90 min for a solution that contains 40 mg L−1 of hexavalent chromium and adsorbent dose of 1.5 g L−1. The increase in removal efficiency as the adsorption process was extended for a prolonged time is apparent, which overcomes the mass transfer barrier and allows more adsorbate to be transferred from the high Cr(VI) concentration solution to the adsorbent.
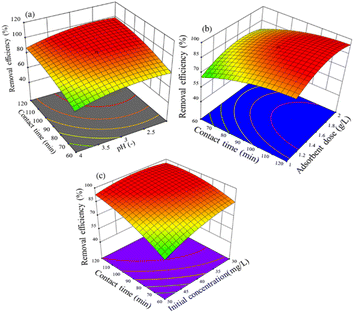 | ||
| Fig. 10 Effect of parameters on Cr(VI) removal: (a) contact time and pH, (b) adsorbent dose and contact time, and (c) contact time and initial concentration. | ||
In terms of a surface plot and contour plot, Fig. 10(b) shows the removal efficiency as a function of adsorption time and adsorbent dose. It reveals the interaction between the variables of adsorbent dose and contact time with the response (removal efficiency) at a pH of 3 and initial concentration of 40 mg L−1. The plot indicates that the removal efficiency increased from 67% to 94% as the adsorbent dose increased from 1 g L−1 to 1.5 g L−1 and the contact time increased from 60 to 92 min. It is evident that an increase in the adsorbent dose and contact time caused the removal efficiency to increase. An increment in adsorbent dose implies more surface for adsorption, and hence higher removal efficiency. Besides, the longer the adsorption time, the higher the removal efficiency as the adsorbate gets sufficient time to be adsorbed. Thus, more room and time imply an enhanced efficiency. However, it tended to remain constant when equilibrium was attained and when the hexavalent chromium molecules were uptaken exhaustively.
The impact of contact time and initial concentration on the chromium(VI) removal efficiency at a fixed adsorbent dose of 1.5 g L−1 and pH of 3 is shown in Fig. 10(c). With a decrease in the initial hexavalent chromium concentration from 60 mg L−1 to 38 mg L−1 and an increase in the contact time from 60 to 95 min, the removal efficiency increased from 65% to 97%, as illustrated in Fig. 10(c). However, a reduction in the initial concentration and longer contact times had little effect on the removal efficiency. The decrease in removal efficiency with an increase in initial concentration can be attributed to two apparent reasons. At an adsorbent dose of 1.5 g L−1, a higher concentration demands more surface for adsorption. In the case of a fixed available surface area, the efficiency tends to decline given that some molecules remain unabsorbed. Alternatively, the mass transfer restriction of the adsorption process becomes appreciable when most of the surface available is occupied. Also, the contact time has a remarkable effect on the adsorption efficiency as a step-wise process. On average, industrial wastewater contains no more than 30 mg L−1 Cr(VI).59 Therefore, this will be the threshold limit in terms of initial concentration.
The interaction effect between pH and the adsorbent dose is depicted in Fig. 11(a) for a 3D surface with an initial concentration of 40 mg L−1 and an adsorption time of 90 min. As can be seen, the highest removal efficiency was found at around pH 2 and towards a higher adsorbent dosing. Thus, considering the effects of the parameters considered, the removal efficiency varied from 88.3% to 95%. It seems that pH 2 is the key operating condition to enhance the adsorption procedure.
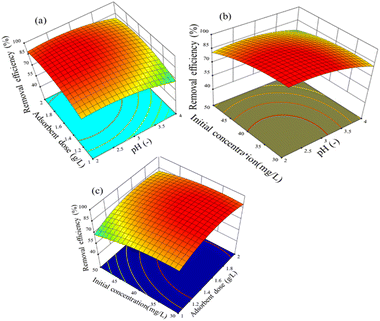 | ||
| Fig. 11 Effect of parameters on Cr(VI) removal efficiency: (a) adsorbent dose and pH, (b) pH and initial concentration, and (c) adsorbent dose and initial concentration. | ||
The removal efficiency of hexavalent chromium by adsorption on the activated BP surface from aqueous chromium solutions is indicated in Fig. 11(b), which is displayed as a function of pH and initial concentration for 90 min with an adsorbent dose of 1.5 g L−1. When the pH and initial concentration decreased from 4 to 2.5 and 50 mg L−1 to 36 mg L−1, respectively, the removal efficiency increased from 75% to 97%. Fig. 11(b) presents evidence that the operating parameters for the maximum hexavalent chromium adsorption are low pH and low initial concentration. Generally, the wastewater from industries has low pH and chromium concentration (30 mg L−1). Thus, the need for pre-treatment or pH adjustment can be avoided.54
Fig. 11(c) depicts the interaction effect of adsorbent dose and initial concentration on the removal efficiency at 90 min adsorption time and pH 3. As presented in Fig. 11(c), the removal efficiency increased from 69% to 95% when the adsorbent dose decreased from 2 g L−1 to 1.5 g L−1 and the initial concentration decreased from 50 mg L−1 to 36 mg L−1.
3.3.2.3 Parameter optimization. The removal efficacy decreased with respect to initial concentration, with the adsorbent dose and time it increased, and at pH 3, the maximum efficiency was observed, while above pH 3 it tended to decrease sharply. Due to the trade-off among the parameters, this pattern requires optimization, which results in two-way effects. The variables were set in the study range to optimize the adsorption process, and the optimum value was adsorption time of 92 min, adsorbent dose of 1.5 g L−1, pH of 3, and initial concentration of 38 mg L−1. The best predictions of the model were verified by triplicate experiments conducted under the optimal conditions determined by numerical optimization (Table 9). The difference between the actual and predicted values was 0.05%. Consequently, it can be concluded that the fitted model significantly and reliably predicts the response.
| Contact time (min) | Adsorbent dose (g L−1) | pH | Initial concentration (mg L−1) | Removal efficiency (%) | |
|---|---|---|---|---|---|
| Predicted | 92 | 1.5 | 3 | 38 | 94.6 |
| Actual | 92 | 1.5 | 3 | 38 | 95.1 |
3.4 Isotherm models and adsorption kinetics
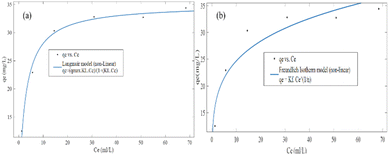
In both the Langmuir and Freundlich isotherm models, the Ce versus qe data were regressed using the MATLAB nonlinear regression method, as shown in Fig. 13(a) and (b) with the curve fitting coefficient of determination (R2), respectively. The R2 values were found to be 0.988 and 0.897 for the Langmuir and Freundlich isotherm models, respectively. Besides, the maximum sorption capacity at equilibrium was found to be 36.09 mg g−1 using the Langmuir isotherm model.
Based on the R2 values determined using the Langmuir isotherm model and Freundlich isotherm model curve fittings, it seems that the behavior of hexavalent chromium adsorption on the activated BP surface is described best by the Langmuir isotherm model. Thus, it can be stated that the Cr(VI) adsorption on the activated carbon follows a monolayer pattern, and subsequently multilayer adsorption.60 The adsorption capacity of the adsorbent was more than 35 mg g−1, where 1 g of adsorbent could adsorb more than 35 mg of adsorbate. This is comparable to the adsorption capacity of 31.3 mg g−1 of activated carbon synthesized from coconut shell.61 A summary of the results of the adsorption kinetics and isotherm models is presented in Table 10.
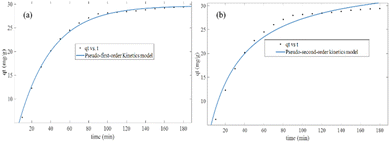
| Kinetic model | qe (mg g−1) | K1 (min−1) | K2 (g (mg)−1 min−1) | R2 |
|---|---|---|---|---|
| Pseudo-first-order | 29.67 | 0.00285 | 0.996 | |
| Pseudo-second-order | 36.09 | — | 0.00085 | 0.973 |
| Isotherm models | qm (mg g−1) | KL (L mg−1) | KF (mg g−1) | n | R2 |
|---|---|---|---|---|---|
| Langmuir | 35.01 | 0.41 | 0.988 | ||
| Freundlich | — | — | 15.8 | 4.9 | 0.895 |
3.5 Reusability of the adsorbent
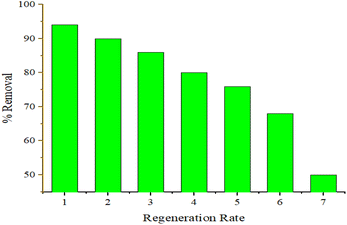
As shown in Fig. 14, the removal efficiency decreased from 94% to 58% from run one to run seven due to the presence of a reduced amount of adsorbent compared with the initial removal efficiency for Cr(VI). The results display that the BP adsorbent presented a good cyclic adsorption performance with easy separation characteristics after adsorption due to its excellent regeneration properties, which can better meet the treatment requirements for industrial wastewater.4. Conclusion
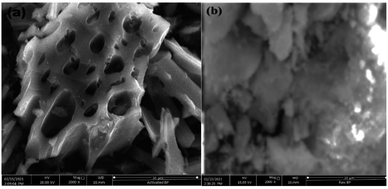
A promising activated carbon material was prepared from waste BP and shown to have potential as an adsorbent for the removal of Cr(VI) from tannery wastewater containing chromium and other heavy metals. The characterization methods revealed that the produced activated BP is a good adsorbent with considerable surface area, as determined by the BET analysis, and high porosity, as seen in the SEM images. The batch adsorption experiments revealed that the adsorbent was capable of removing most of the Cr(VI) from aqueous solution under the optimum operating conditions. It seems that the rate of adsorption of Cr(VI) on the adsorbent surface can mathematically be best modelled by the pseudo-first-order kinetic model and the behavior of adsorption follows the Langmuir isotherm model. Besides the experimental results for a synthetic aqueous solution of Cr(VI), the real wastewater study showed that the adsorbent has good potential for the removal of hexavalent chromium from effluents to the extent that it fulfils the standards. All the results showed that the adsorbent made from waste BP to remove Cr(VI), which is an efficient and cheap material, can be used repeatedly and keep the concentration of chromium in wastewater effluents within permissible limits.Data availability
Most of data used in this study are presented in the article and if further data are required, it can be provided upon request.Author contributions
Bereket Ameha – conceptualization, methodology, writing draft formal analysis, investigation, Tsegaye Sissay – resources, and data curation, software, validation; Belay Getye – writing – review and editing; Shiferaw Ayalneh – revision and supervision, Talbachew Tadesse Nadew – visualization, and supervision; Destaw Agumass – manuscript revising and editing. After reading the manuscript, all authors have given their approval to publish it.Conflicts of interest
The authors declare that there are no conflicts of interest regarding this article.Acknowledgements
The authors would like to thank the Department of Chemical and Food Engineering, Faculty of Food and Chemical Engineering, Wollo University, Kombolcha, Ethiopia, Bahir Dar University, Bahir Dar, Ethiopia, and Addis Ababa Science Technology University, Addis Ababa, Ethiopia for their assistance in the research laboratory work.References
- F. M. Henretig, M. A. Kirk and C. A. McKay, Hazardous Chemical Emergencies and Poisonings, N. Engl. J. Med., 2019, 380, 1638–1655 CrossRef CAS PubMed.
- T. Wee, C. Kim and M. Hanif, Review on Wastewater Treatment Technologies, Int. J. Appl. Environ. Sci., 2016, 11, 111–126 Search PubMed.
- R. P. Singh and P. Singh, Advances in Biological Treatment of Industrial Waste Water and Their Recycling for a Sustainable Future, Springer Singapore, 2019, DOI:10.1007/978-981-13-1468-1.
- M. Mokarram, A. Saber and V. Sheykhi, Effects of heavy metal contamination on river water quality due to release of industrial effluents, J. Clean. Prod., 2020, 277, 123380 CrossRef CAS.
- S. Renu, M. Agarwal and K. Singh, Heavy metal removal from wastewater using various adsorbents: a review, J. Water Reuse Desalin., 2017, 7, 387–419 CrossRef.
- S. Mehdipour, V. Vatanpour and H.-R. Kariminia, Influence of ion interaction on lead removal by a polyamide nanofiltration membrane, Desalination, 2015, 362, 84–92 CrossRef CAS.
- C. Zamora-Ledezma, et al., Heavy metal water pollution: a fresh look about hazards, novel and conventional remediation methods, Environ. Technol. Innov., 2021, 22, 101504 CrossRef CAS.
- A. Singh, et al., Heavy metal contamination of water and their toxic effect on living organisms, in The Toxicity of Environmental Pollutants, IntechOpen, 2022, vol. 34, pp. 57–67 Search PubMed.
- E. Kassahun, et al., The Application of the Activated Carbon from Cordia africana Leaves for Adsorption of Chromium (III) from an Aqueous Solution, J. Chem., 2022, 2022, 1–11 CrossRef.
- T. T. Nadew, M. Keana, T. Sisay, B. Getye and N. G. Habtu, Synthesis of activated carbon from banana peels for dye removal of an aqueous solution in textile industries: optimization, kinetics, and isotherm aspects, Water Pract. Technol., 2023, 18, 947–966 CrossRef.
- M. L. Brusseau and J. F. Artiola, Chemical contaminants, in Environmental and Pollution Science, Elsevier, 2019, pp. 175–190, DOI:10.1016/B978-0-12-814719-1.00012-4.
- M. Owlad, M. K. Aroua, W. A. W. Daud and S. Baroutian, Removal of hexavalent chromium-contaminated water and wastewater: a review, Water. Air. Soil Pollut., 2009, 200, 59–77 CrossRef CAS.
- D. Mohan, K. Singh and V. Singh, Trivalent chromium removal from wastewater using low cost activated carbon derived from agricultural waste material and activated carbon fabric cloth, J. Hazard. Mater., 2016, 135, 280–295 CrossRef PubMed.
- S. Jha, R. Gaur, S. Shahabuddin and I. Tyagi, Biochar as Sustainable Alternative and Green Adsorbent for the Remediation of Noxious Pollutants: A Comprehensive Review, Toxics, 2023, 11, 1–23 CrossRef PubMed.
- S. Sharma and A. Bhattacharya, Drinking water contamination and treatment techniques, Appl. Water Sci., 2017, 7, 1043–1067 CrossRef CAS.
- V. S. Munagapati, et al., Adsorptive removal of anionic dye (Reactive Black 5) from aqueous solution using chemically modified banana peel powder: kinetic, isotherm, thermodynamic, and reusability studies, Int. J. Phytoremediation, 2020, 22, 267–278 CrossRef CAS.
- F. Pourramezani, F. Akrami Mohajeri, M. H. Salmani, A. Dehghani Tafti and E. Khalili Sadrabad, Evaluation of heavy metal concentration in imported black tea in Iran and consumer risk assessments, Food Sci. Nutr., 2019, 7, 4021–4026 CrossRef CAS PubMed.
- U. I. Aletan and H. A. Kwazo, Analysis of the Proximate Composition, Anti-Nutrients and Mineral Content of Maerua Crassifolia Leaves, Niger. J. Basic Appl. Sci., 2020, 27, 89–96 CrossRef.
- Y. Chen, X. Mu, E. Lester and T. Wu, High efficiency synthesis of HKUST-1 under mild conditions with high BET surface area and CO2 uptake capacity, Prog. Nat. Sci. Mater. Int., 2018, 28, 584–589 CrossRef CAS.
- A. Turki, A. El Oudiani, S. Msahli and F. Sakli, Infrared Spectra for Alfa Fibers Treated with Thymol, J. Glycobiol., 2018, 7, 1–8 Search PubMed.
- J. F. Nohl, et al., Low-voltage SEM of air-sensitive powders: from sample preparation to micro/nano analysis with secondary electron hyperspectral imaging, Micron, 2022, 156, 103234 CrossRef CAS PubMed.
- Z. Xie, W. Guan, F. Ji, Z. Song and Y. Zhao, Production of Biologically Activated Carbon from Orange Peel and Landfill Leachate Subsequent Treatment Technology, J. Chem., 2014, 2014, 1–9 Search PubMed.
- N. Saadatkhah, et al., Experimental methods in chemical engineering: thermogravimetric analysis—TGA, Can. J. Chem. Eng., 2020, 98, 34–43 CrossRef CAS.
- V. Kumar, V. Rehani, S. Saruchi and B. S. Kaith, Screening and optimization through response surface methodology for synthesis of pH, temperature and salt-sensitive Aloe vera –acrylic acid-based biodegradable hydrogel: its evaluation as dye adsorbent, Polym. Eng. Sci., 2019, 59, 2323–2334 CrossRef CAS.
- E. N. Bakatula, D. Richard, C. M. Neculita and G. J. Zagury, Determination of point of zero charge of natural organic materials, Environ. Sci. Pollut. Res., 2018, 25, 7823–7833 CrossRef CAS.
- M. O. Saeed, K. Azizli, M. H. Isa and M. J. K. Bashir, Application of CCD in RSM to obtain optimize treatment of POME using Fenton oxidation process, J. Water Process Eng., 2015, 8, e7–e16 CrossRef.
- K. K. Onchoke and S. A. Sasu, Determination of Hexavalent Chromium (Cr(VI)) Concentrations via Ion Chromatography and UV-Vis Spectrophotometry in Samples Collected from Nacogdoches Wastewater Treatment Plant, East Texas (USA), Adv. Environ. Chem., 2016, 2016, 1–10 CrossRef.
- S. Afshin, et al., Application of Box–Behnken design for optimizing parameters of hexavalent chromium removal from aqueous solutions using Fe3O4 loaded on activated carbon prepared from alga: kinetics and equilibrium study, J. Water Process Eng., 2021, 42, 102113 CrossRef.
- C. Guo, L. Ding, X. Jin, H. Zhang and D. Zhang, Application of response surface methodology to optimize chromium (VI) removal from aqueous solution by cassava sludge-based activated carbon, J. Environ. Chem. Eng., 2021, 9, 104785 CrossRef CAS.
- S. Behboudi-Jobbehdar, C. Soukoulis, L. Yonekura and I. Fisk, Optimization of Spray-Drying Process Conditions for the Production of Maximally Viable Microencapsulated L. acidophilus NCIMB 701748, Dry. Technol., 2013, 31, 1274–1283 CrossRef CAS.
- P. Kumar and M. S. Chauhan, Adsorption of chromium (VI) from the synthetic aqueous solution using chemically modified dried water hyacinth roots, J. Environ. Chem. Eng., 2019, 7, 103218 CrossRef CAS.
- A. H. Shobier, M. M. El-Sadaawy and G. F. El-Said, Removal of hexavalent chromium by ecofriendly raw marine green alga Ulva fasciata: kinetic, thermodynamic and isotherm studies, Egypt. J. Aquat. Res., 2020, 46, 325–331 CrossRef.
- C. Bai, L. Wang and Z. Zhu, Adsorption of Cr(III) and Pb(II) by graphene oxide/alginate hydrogel membrane: characterization, adsorption kinetics, isotherm and thermodynamics studies, Int. J. Biol. Macromol., 2020, 147, 898–910 CrossRef CAS PubMed.
- R. Khosravi, et al., Chromium adsorption from aqueous solution using novel green nanocomposite: adsorbent characterization, isotherm, kinetic and thermodynamic investigation, J. Mol. Liq., 2018, 256, 163–174 CrossRef CAS.
- Y. Zhang, et al., Recycling spent lithium-ion battery as adsorbents to remove aqueous heavy metals: adsorption kinetics, isotherms, and regeneration assessment, Resour. Conserv. Recycl., 2020, 156, 104688 CrossRef.
- I. C. Afolabi, S. I. Popoola and O. S. Bello, Modeling pseudo-second-order kinetics of orange peel-paracetamol adsorption process using artificial neural network, Chemom. Intell. Lab. Syst., 2020, 203, 104053 CrossRef CAS.
- S. Han, et al., Co-monomer polymer anion exchange resin for removing Cr(VI) contaminants: adsorption kinetics, mechanism and performance, Sci. Total Environ., 2020, 709, 136002 CrossRef CAS PubMed.
- M. A. Al-Ghouti and D. A. Da'ana, Guidelines for the use and interpretation of adsorption isotherm models: a review, J. Hazard. Mater., 2020, 393, 122383 CrossRef CAS PubMed.
- Y. Zhang, et al., Waste eggshell membrane-assisted synthesis of magnetic CuFe2O4 nanomaterials with multifunctional properties (adsorptive, catalytic, antibacterial) for water remediation, Colloids Surfaces A Physicochem. Eng. Asp., 2021, 612, 125874 CrossRef CAS.
- H. B. Yang, et al., Atomically dispersed Ni(i) as the active site for electrochemical CO2 reduction, Nat. Energy, 2018, 3, 140–147 CrossRef CAS.
- J. Yang, et al., Effects of Activation Temperature and Densification on Adsorption Performance of MOF MIL-100(Cr), J. Chem. Eng. Data, 2019, 64, 5814–5823 CrossRef CAS.
- P. Gong, et al., Extraction methods, chemical characterizations and biological activities of mushroom polysaccharides: a mini-review, Carbohydr. Res., 2020, 494, 108037 CrossRef CAS PubMed.
- J. Zhu, et al., Effect of acid activation of palygorskite on their toluene adsorption behaviors, Appl. Clay Sci., 2018, 159, 60–67 CrossRef CAS.
- V. V. Kramarenko, A. N. Nikitenkov, I. A. Matveenko, V. Y. Molokov and Y. S. Vasilenko, Determination of water content in clay and organic soil using microwave oven, IOP Conf. Ser. Earth Environ. Sci., 2016, 43, 012029 CrossRef.
- A. Arefnia, E. Momeni, D. J. Armaghani, K. A. Kassim and K. Ahmad, Effect of tire derived aggregate on maximum Dry Density of Kaolin, J. Teknol. (Sciences Eng.), 2013, 66, 19–23 Search PubMed.
- I. Hammouda and D. Mihoubi, Thermodynamic and mechanical characterisation of kaolin clay, Polish J. Chem. Technol., 2014, 16, 28–35 CrossRef CAS.
- M. K. Rai, et al., Removal of hexavalent chromium Cr (VI) using activated carbon prepared from mango kernel activated with H3PO4, Resour. Technol., 2016, 2, S63–S70 Search PubMed.
- H. E. Shuma, L. L. Mkayula and Y. M. M. Makame, Assessment of the Effect of Acid Activation of Kaolin from Malangali on Water Defluoridation, Tanzania J. Sci., 2019, 45, 279–296 Search PubMed.
- T. A. Aragaw and F. Kuraz, Advances of Science and Technology, Springer International Publishing, 2019, vol. 274 Search PubMed.
- T. A. Aragaw and F. T. Angerasa, Synthesis and characterization of Ethiopian kaolin for the removal of basic yellow (BY 28) dye from aqueous solution as a potential adsorbent, Heliyon, 2020, 6, e04975 CrossRef CAS.
- N. A. Rashidi, S. Yusup, A. Borhan and L. H. Loong, Experimental and modelling studies of carbon dioxide adsorption by porous biomass derived activated carbon, Clean Technol. Environ. Policy, 2014, 16, 1353–1361 CrossRef CAS.
- E. Mosaddegh, A. Hassankhani and H. Karimi-Maleh, Synthesis and characterization of ES/Cu(OH)2 nanocomposite: a novel and high effective catalyst in the green synthesis of pyrano[4,3-b]pyrans, Mater. Sci. Eng. C, 2015, 46, 264–269 CrossRef CAS PubMed.
- C. Luo, Z. Tian, B. Yang, L. Zhang and S. Yan, Manganese dioxide/iron oxide/acid oxidized multi-walled carbon nanotube magnetic nanocomposite for enhanced hexavalent chromium removal, Chem. Eng. J., 2013, 234, 266–275 CrossRef.
- A. A. Attia, S. A. Khedr and S. A. Elkholy, Adsorption of chromium ion (VI) by acid activated carbon, Brazilian J. Chem. Eng., 2010, 27, 183–193 CrossRef CAS.
- T. Ravi and S. Sundararaman, Synthesis and characterization of chicken eggshell powder coated magnetic nano adsorbent by an ultrasonic bath assisted co-precipitation for Cr(VI) removal from its aqueous mixture, J. Environ. Chem. Eng., 2020, 8, 103877 CrossRef CAS.
- D. Pathania, A. K. Srivastava and A. Sharma, Bio-inspired fabrication of Cu–ZrO2 nanocomposites for the remediation of Cr(VI) from water system, Curr. Res. Green Sustain. Chem., 2021, 4, 100073 CrossRef CAS.
- R. R. De. Chimie, Recent advances in biosorption of heavy metals: support tools for biosorption equilibrium, kinetics and mechanism, Rom. Acad., 2014, 59(6–7), 527–538 Search PubMed.
- Y. Xu, et al., Adsorption and reduction of chromium(VI) from aqueous solution using polypyrrole/calcium rectorite composite adsorbent, Water Res, 2019, 160, 148–157 CrossRef CAS PubMed.
- V. Dhiman and N. Kondal, ZnO Nanoadsorbents: a potent material for removal of heavy metal ions from wastewater, Colloid Interface Sci. Commun., 2021, 41, 100380 CrossRef CAS.
- A. Blanco-Flores, et al., Efficient removal of crystal violet dye from aqueous solutions by vitreous tuff mineral, Environ. Technol., 2014, 35, 1508–1519 CrossRef CAS PubMed.
- M. D. Vedenyapina, A. Y. Kurmysheva, S. A. Kulaishin and Y. G. Kryazhev, Adsorption of Heavy Metals on Activated Carbons (A Review), Solid Fuel Chem, 2021, 55, 83–104 CrossRef CAS.
Footnote |
| † Electronic supplementary information (ESI) available. See DOI: https://doi.org/10.1039/d3ra07476e |
| This journal is © The Royal Society of Chemistry 2024 |

