 Open Access Article
A comparison of the determination of multiple pesticide residues in fruits, vegetables, and edible fungi using gas chromatography combined with filtration purification and solid-phase extraction
Yan Zeng a,
Tao Lanb,
Xiaxue Lia,
Ya Chena,
Qiaohui Yanga,
Bin Quc,
Yu Zhanga and
Canping Pan
 *d
*d
aYa'an Agricultural Food Quality Monitoring and Testing Center, Ya'an 625000, China
bChina National Institute of Standardization, Beijing 100191, China
cBeijing KNORTH Technology Co., Ltd, Beijing 102299, China
dCollege of Science, China Agricultural University, No. 2, Yuanmingyuan West Road, Haidian District, Beijing 100193, China. E-mail: 276874503@qq.com; canpingp@cau.edu.cn; Tel: +86-18080598805
First published on 24th May 2024
Abstract
The multiplug filtration clean-up (m-PFC) and solid-phase extraction (SPE) pretreatment methods were employed to process 8 representative matrices in fruits, vegetables, and edible fungi, respectively. 37 pesticide residues were determined using gas chromatography equipped with ECD and FPD detectors. The measurement data were compared and analyzed following m-PFC purification and gas chromatography analysis, and both accuracy and precision met the (EU) 2021/808 requirements, achieving recovery rates for the 8 matrices ranging from 67.0% to 112.8% (averaging over 83.8% recovery), and RSDs between 0.2% and 15.2%. The 37 pesticides exhibited good linearity between 0.05 and 1.6 μg mL−1, and the matrix effect was found to be weaker compared to that of the Florisil solid-phase extraction method. The detection limits ranged from 0.0001 to 0.03 μg kg−1, with 31 pesticides showing lower detection limits compared to the SPE method. The application of this method to 150 real samples resulted in the detection of 17 pesticides across all samples. Fewer pigments were detected in m-PFC purified solutions compared to Florisil PR SPE when analyzed by liquid chromatography. m-PFC achieved more thorough adsorption of endogenous substances like pigments, reducing instrument contamination, utilizing less organic solvent, and simplifying the operation. This purification step offers clear advantages, allowing for the processing of larger sample batches in a short time. It can serve as a replacement for SPE methods like Florisi PR in batch detection of fruit and vegetable samples.
Introduction
Food is considered the cornerstone of life, with agricultural products like vegetables, fruits, and edible fungi being essential components of daily sustenance. However, in agricultural production, the growing dependence on chemical inputs to boost yields and improve harvests has resulted in escalating concerns regarding pesticide residue levels.1,2 Excessive pesticide residues pose potential risks to human health. Therefore, formulating maximum residue limits (MRLs) standards for pesticides has become crucial for many countries and organizations to strengthen risk management and control of pesticide residues in fruits and vegetables.3–5 Common methods for testing pesticide residues include gas chromatography (GC),6 liquid chromatography (LC),7 gas chromatography-tandem mass spectrometry (GC-MS/MS),8,9 liquid chromatography-tandem mass spectrometry (LC-MS/MS).10,11 Mass spectrometry, known for its high selectivity and sensitivity, is particularly suited for detecting trace substances. However, its high equipment cost poses significant operational financial pressures on small and medium-sized laboratories. In contrast, gas chromatography, with its excellent qualitative and quantitative capabilities and ease of operation, also offers the advantage of relatively low equipment costs. Therefore, it has become the preferred method for pesticide residue testing in small to medium-sized laboratories.By employing appropriate instruments, equipment, and pre-treatment methods, the requirements for determining specific compounds can be met by researchers. Many organic phosphorus compounds, characterized by their thermal stability and volatility, are found particularly suitable for analysis using gas chromatography.12,13 IIn the determination of pesticide residues in fruits, vegetables, and edible fungi by gas chromatography (GC), sample pretreatment is recognized as a key step to ensure accurate qualitative and quantitative analysis. Purification, a crucial core step in the pretreatment process, is utilized to eliminate interference from various sample matrices. Fruits, vegetables, and edible fungi, which contain different amounts of water, pigments, sugars, lipids, organic acids, vitamins, and other components, are subjected to traditional methods such as solid-phase extraction (SPE),14 liquid–liquid extraction (LLE),15,16 solid-phase microextraction (SPME),17 gel permeation chromatography (GPC) cleanup,18 matrix solid-phase dispersion (MSPD),19 and disperse-SPE (d-SPE).20,21 These methods often suffer from low efficiency and incomplete removal of impurities, leading to inaccurate quantification and false-positive results. Conversely, excessive purification is often found to result in significant pesticide adsorption, leading to false-negative results. Moreover, these processes, which are cumbersome and time-consuming, fail to quickly qualify and quantify contaminants. Consequently, the detection report may be issued long after the products have been sold, falling short of the goal of risk prevention and control.
In 2013, Zhao and colleagues22 first utilized multi-walled carbon nanotubes (Multi-Walled Carbon Nanotubes, MWCNTs) as a purification material to establish a method for analyzing 186 kinds of pesticide residues in tomatoes and tomato products. MWCNTs are a kind of novel carbonaceous material composed of multiple layers of graphene curled and closely stacked to form concentric cylindrical layers of carbon atoms. Their highly ordered nanometer–diameter structure provides a large specific surface area, extremely high mechanical strength, and elasticity, as well as excellent thermal and electrical conductivity. These characteristics endow MWCNTs with superior adsorption capabilities compared to other adsorbent materials, enabling them to effectively remove a variety of interfering substances in pesticide residue analysis, including pigments, organic acids, sugars, and sterols. Furthermore, MWCNTs address the issue of adsorption of planar pesticides, improving upon the limitations observed with graphitized carbon black (GCB).23–28 Han et al.29 established a pesticide residue analysis method for 124 pesticides in liquor, sorghum, and rice hulls by combining m-PFC with GC-MS/MS. Qin et al.30 established an m-PFC clean-up method for 25 pesticides in six typical matrices, including wheat, spinach, and carrot, and compared it with the QuEChERS method, which stands for quick, easy, cheap, effective, rugged, and safe. Song et al.31 established a pesticide residue analysis method for 48 pesticides in green tea by combining m-PFC with LC-MS/MS.
Currently, existing reports show that the rapid filtration purification technology, known as multiplug filtration clean-up (m-PFC), has been applied as a pretreatment in detecting various pesticide residues in fruits, vegetables, and edible fungi using mass spectrometry analyses such as GC-MS/MS and LC-MS/MS.32–34 There have been no reports of applying this method as a pretreatment for gas chromatography (GC) alone. To address the needs of small and medium-sized laboratories and enterprises lacking mass spectrometers and requiring rapid monitoring results, this experiment introduces m-PFC, primarily utilizing MWCNTs, to establish a rapid detection method for 37 pesticide residues, including organophosphates (OPPs), organochlorines (OCs), and pyrethroids (PYs), in eight representative matrices of fruits, vegetables, and edible fungi, combined with gas chromatography detectors (GC-FPD, GC-ECD). Compared to solid-phase extraction (SPE), m-PFC eliminates the activation and elution steps of SPE,22 significantly shortening the purification time and effectively addressing the problems associated with SPE, such as numerous purification steps, large reagent consumption, and lengthy processes.
To the best of our knowledge, this study is first to establish a rapid method for the determination of organophosphorus and organochlorine (pyrethroids) in fruits, vegetables and edible mushrooms using m-PFC clean-up combined with GC-FPD/ECD. This is intended to provide a method reference for small and medium-sized micro-laboratories and enterprises to detect multi-pesticide residues in plant source samples in large quantities. These conditions are designed to ensure optimal recovery, minimize potential matrix effects, and adhere as closely as possible to the principles of green analytical chemistry, which emphasize reducing time, cost, the number of steps, and the amount of reagents used. Our study also seeks to validate the proposed method for various fruits, vegetables, and edible mushrooms in accordance with European legislation.
Experiments
Instruments and reagents
| Name | CAS | R/T (min) | Name | CAS | R/T (min) |
|---|---|---|---|---|---|
| Dichlorvos | 62-73-7 | 4.84 | α-BHC | 319-84-6 | 7.31 |
| Methamidophos | 10265-92-6 | 5.83 | β-BHC | 319-85-7 | 7.76 |
| Acephate | 30560-19-1 | 8.39 | γ-BHC | 58-89-9 | 7.94 |
| Diazinon | 333-41-5 | 10.58 | δ-BHC | 319-86-8 | 8.46 |
| Dimethoate | 60-51-5 | 13.06 | Vinclozolin | 50471-44-8 | 9.07 |
| Parathion-methyl | 298-00-0 | 15.13 | Triadimefon | 43121-43-3 | 10.11 |
| Fenitrothion | 122-14-5 | 15.75 | Procymidone | 32809-16-8 | 10.90 |
| Isofenphos-methyl | 99675-03-3 | 16.37 | Fenpropathrin | 39515-41-8 | 13.99 |
| Triazophos | 24017-47-8 | 19.37 | Cyfluthrin | 68359-37-5 | 14.33 |
| Phosmet | 732-11-6 | 21.28 | Flucythrinate | 70124-77-5 | 16.44–16.54 |
| Phorate | 298-02-2 | 9.45 | Tau-fluvalinate | 102851-06-9 | 16.95–17.17 |
| Omethoate | 1113-02-6 | 10.53 | Deltamethrin | 52918-63-5 | 17.95–18.03 |
| Monocrotophos | 6923-22-4 | 12.64 | Dicofol | 115-32-2 | 18.85 |
| Chlorpyrifos | 2921-88-2 | 14.967 | Iprodione | 36734-19-7 | 10.218–14.411 |
| Malaoxon | 121-75-5 | 15.62 | Bifenthrin | 82657-04-3 | 14.14 |
| Parathion | 56-38-2 | 16.22 | Cyhalothrin | 91465-08-6 | 15.11 |
| Isocarbophos | 24353-61-5 | 16.63 | Cypermethrin | 52315-07-8 | 16.78–16.97 |
| Profenofos | 41198-08-7 | 17.42 | Fenvalerate | 51630-58-1 | 17.82–18.08 |
| Phosalone | 2310-17-0 | 22.22 |
Sample pretreatment
![[thin space (1/6-em)]](https://www.rsc.org/images/entities/char_2009.gif) :
:![[thin space (1/6-em)]](https://www.rsc.org/images/entities/char_2009.gif) 1 (v/v) mixture of n-hexane and acetone, pack it respectively into 2 bottles for testing OPPs and OCs (including PYs), after filtering through a 0.22 μm filter head. Fig. 1 illustrates the specific clean-up procedures.
1 (v/v) mixture of n-hexane and acetone, pack it respectively into 2 bottles for testing OPPs and OCs (including PYs), after filtering through a 0.22 μm filter head. Fig. 1 illustrates the specific clean-up procedures.
![[thin space (1/6-em)]](https://www.rsc.org/images/entities/char_2009.gif) :
:![[thin space (1/6-em)]](https://www.rsc.org/images/entities/char_2009.gif) n-hexane, V
n-hexane, V![[thin space (1/6-em)]](https://www.rsc.org/images/entities/char_2009.gif) :
:![[thin space (1/6-em)]](https://www.rsc.org/images/entities/char_2009.gif) V = 1
V = 1![[thin space (1/6-em)]](https://www.rsc.org/images/entities/char_2009.gif) :
:![[thin space (1/6-em)]](https://www.rsc.org/images/entities/char_2009.gif) 9) and 5 mL of n-hexane, activate the Florisi PR-SPE column, collect and dispose of the waste according to the safety regulations for chemical reagents. Inject the sample into the Florisi PR-SPE column. Take 10 mL of a solvent mixture (acetone
9) and 5 mL of n-hexane, activate the Florisi PR-SPE column, collect and dispose of the waste according to the safety regulations for chemical reagents. Inject the sample into the Florisi PR-SPE column. Take 10 mL of a solvent mixture (acetone![[thin space (1/6-em)]](https://www.rsc.org/images/entities/char_2009.gif) :
:![[thin space (1/6-em)]](https://www.rsc.org/images/entities/char_2009.gif) n-hexane, V
n-hexane, V![[thin space (1/6-em)]](https://www.rsc.org/images/entities/char_2009.gif) :
:![[thin space (1/6-em)]](https://www.rsc.org/images/entities/char_2009.gif) V = 1
V = 1![[thin space (1/6-em)]](https://www.rsc.org/images/entities/char_2009.gif) :
:![[thin space (1/6-em)]](https://www.rsc.org/images/entities/char_2009.gif) 9) into the sample tube, vortex for 1 minute to dissolve the residue. Then, inject all the dissolved solution from the sample tube into the Florisi PR-SPE column, elute, and repeat process once. Collect all eluates in a 15 mL centrifuge tube, and evaporate to near dryness with nitrogen at 55 °C. Dissolve 1.6 mL of acetone
9) into the sample tube, vortex for 1 minute to dissolve the residue. Then, inject all the dissolved solution from the sample tube into the Florisi PR-SPE column, elute, and repeat process once. Collect all eluates in a 15 mL centrifuge tube, and evaporate to near dryness with nitrogen at 55 °C. Dissolve 1.6 mL of acetone![[thin space (1/6-em)]](https://www.rsc.org/images/entities/char_2009.gif) :
:![[thin space (1/6-em)]](https://www.rsc.org/images/entities/char_2009.gif) n-hexane (V
n-hexane (V![[thin space (1/6-em)]](https://www.rsc.org/images/entities/char_2009.gif) :
:![[thin space (1/6-em)]](https://www.rsc.org/images/entities/char_2009.gif) V = 1
V = 1![[thin space (1/6-em)]](https://www.rsc.org/images/entities/char_2009.gif) :
:![[thin space (1/6-em)]](https://www.rsc.org/images/entities/char_2009.gif) 1) mixture, vortex mix, and filter through a 0.22 μm × 13 mm PTFE membrane into a 2 mL sample vial for detection of OPPs by GC-FPD, and detection of OCs and PYs by GC-ECD.
1) mixture, vortex mix, and filter through a 0.22 μm × 13 mm PTFE membrane into a 2 mL sample vial for detection of OPPs by GC-FPD, and detection of OCs and PYs by GC-ECD.The use of the C18-SPE column for solid phase extraction complies with the established protocol.
![[thin space (1/6-em)]](https://www.rsc.org/images/entities/char_2009.gif) :
:![[thin space (1/6-em)]](https://www.rsc.org/images/entities/char_2009.gif) toluene, V
toluene, V![[thin space (1/6-em)]](https://www.rsc.org/images/entities/char_2009.gif) :
:![[thin space (1/6-em)]](https://www.rsc.org/images/entities/char_2009.gif) V = 3
V = 3![[thin space (1/6-em)]](https://www.rsc.org/images/entities/char_2009.gif) :
:![[thin space (1/6-em)]](https://www.rsc.org/images/entities/char_2009.gif) 1) for activation of the GCB-SPE column, collect and dispose of the waste according to the safety regulations for chemical reagents. Inject the sample solution from tube B into the GCB-SPE column. Next, dissolve the sample in tube B with 25 mL of a solvent mixture (acetonitrile
1) for activation of the GCB-SPE column, collect and dispose of the waste according to the safety regulations for chemical reagents. Inject the sample solution from tube B into the GCB-SPE column. Next, dissolve the sample in tube B with 25 mL of a solvent mixture (acetonitrile![[thin space (1/6-em)]](https://www.rsc.org/images/entities/char_2009.gif) :
:![[thin space (1/6-em)]](https://www.rsc.org/images/entities/char_2009.gif) toluene, V
toluene, V![[thin space (1/6-em)]](https://www.rsc.org/images/entities/char_2009.gif) :
:![[thin space (1/6-em)]](https://www.rsc.org/images/entities/char_2009.gif) V = 3
V = 3![[thin space (1/6-em)]](https://www.rsc.org/images/entities/char_2009.gif) :
:![[thin space (1/6-em)]](https://www.rsc.org/images/entities/char_2009.gif) 1) to dissolve the sample tube B, and then inject it into the GCB-SPE column. Elute, and evaporate the eluate to near dryness with nitrogen at 55 °C. Dissolve the residue in 1.6 mL of an acetone
1) to dissolve the sample tube B, and then inject it into the GCB-SPE column. Elute, and evaporate the eluate to near dryness with nitrogen at 55 °C. Dissolve the residue in 1.6 mL of an acetone![[thin space (1/6-em)]](https://www.rsc.org/images/entities/char_2009.gif) :
:![[thin space (1/6-em)]](https://www.rsc.org/images/entities/char_2009.gif) n-hexane mixture (V
n-hexane mixture (V![[thin space (1/6-em)]](https://www.rsc.org/images/entities/char_2009.gif) :
:![[thin space (1/6-em)]](https://www.rsc.org/images/entities/char_2009.gif) V = 1
V = 1![[thin space (1/6-em)]](https://www.rsc.org/images/entities/char_2009.gif) :
:![[thin space (1/6-em)]](https://www.rsc.org/images/entities/char_2009.gif) 1), mix well, then filter through a 0.22 μm × 13 mm PTFE membrane into a sample vial. Use this for the detection of OPPs by GC-FPD and OCs and PYs by GC-ECD.
1), mix well, then filter through a 0.22 μm × 13 mm PTFE membrane into a sample vial. Use this for the detection of OPPs by GC-FPD and OCs and PYs by GC-ECD.The use of the carbon-SPE column for solid phase extraction aligns with the GCB-SPE step in the protocol.
Due to the strong toxicity of toluene, it is combined with acetonitrile to serve as the eluent for GCB-SPE and carbon-SPE, enabling the exploration of their purification efficiency and recovery rates.
The above purification methods each utilize 2.4, 2.8, 3.2, 3.6, and 4 mL of the supernatant, passed through various solid-phase extraction columns, to explore the impact of different purification volumes on purification efficiency and recovery rates.
The operator maintains controls over the flow rate throughout the process, ensuring that the solid-phase extraction column remains wet. All waste chemical reagents are disposed of properly in accordance with chemical safety regulations and are stored for recycling by a professional organization.
Ref. 35 discusses taking 3.2 mL of the upper clear liquid, evaporating it to dryness using a nitrogen evaporator, then dissolving it in 1.6 mL of an acetone![[thin space (1/6-em)]](https://www.rsc.org/images/entities/char_2009.gif) :
:![[thin space (1/6-em)]](https://www.rsc.org/images/entities/char_2009.gif) n-hexane mixture, mixing well, and filtering through an organic membrane before bottling. This solution can be directly analyzed using GC-FPD for OPPs and GC-ECD for OCs and PYs.
n-hexane mixture, mixing well, and filtering through an organic membrane before bottling. This solution can be directly analyzed using GC-FPD for OPPs and GC-ECD for OCs and PYs.
Instrument conditions
GC-FPD: DB-1701 MS chromatography column, 30 m × 0.32 mm × 0.25 μm; gasification temperature: 230 °C; detector temperature: 250 °C, hydrogen 75 mL min−1, air 100 mL min−1; column heating program: begin at 120 °C, hold for 0.5 minutes, then ramp up at a rate of 10 °C min−1 of 10 °C min−1 to 200 °C, hold for 2 minutes, followed by an increase at 15 °C min−1 to 275 °C, and hold for 5 minutes; carrier gas: 99.999% nitrogen; flow rate: 1.5 mL min−1.
GC-ECD: DB-5 MS chromatography column: 30 m × 0.32 mm × 0.25 μm; gasification temperature: 250 °C; detector temperature: 310 °C; column heating program: begin at 80 °C, hold for 1 minute, then increase at a rate of 15 °C min−1 to 300 °C, and hold for 6 min; carrier gas: 99.999% nitrogen; flow rate: 1.5 mL min−1.
Method validation and comparison
Following the requirements of (EU) 2021/808,38 it is necessary to validate the accuracy, precision, limit of detection (LOD), linear range, and matrix effects (MEs) of the established m-PFC method. Using spinach and Chinese cabbage as representatives of dark and light matrices, the accuracy and precision of the m-PFC method were validated at three addition levels: 0.05, 0.1, and 0.5 mg kg−1. MRL standard solutions at 0.25 times were added to blank matrix samples (0.05 mg kg−1 added into MRL-free pesticides). The formula LOD = 3.3 × (SDMRL × 0.25/S)39 was used to calculate the quantitative limit of each matrix. The ME40 was determined by slope ratio between the matrix-matched and the comparing the slope ratio between the matrix-matched and the solvent calibration curves. Additionally, the method established was also used to analyze 150 real samples.Comparisons between the two methods were made regarding pretreatment, clean-up effects, blank sample chromatograms, device contamination, and method performance. Additionally, the matrix effects (MEs) of the eight samples and the accuracy and precision of the eight matrices treated by the two methods at the 0.1 mg kg−1 level were also compared.
Results and discussion
Comparison of pretreatment procedures
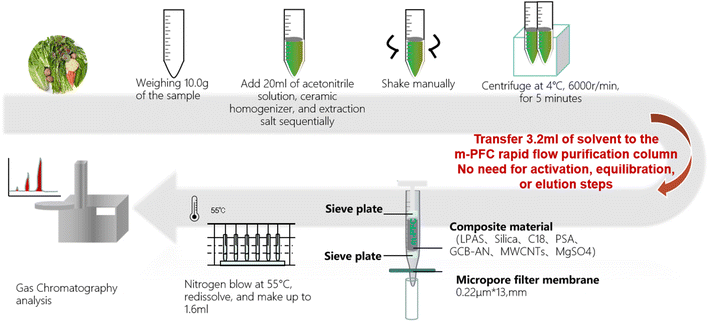
Numerous reports have identified the optimal extraction solvent for pesticide residues in fruits and vegetables.41–43 Based on this literature, we chose acetonitrile as the extraction solvent for this experiment.Comparisons were made on the reagent consumption, time consumption, and waste liquid generated amount (Table 2). Among them, the m-PFC filtration purification method demonstrated higher efficiency in reagent consumption, vessel usage, and experiment duration compared to the other four pre-treatment methods. Additionally, this method produced the least amount of waste, at 15 mL, compared to the other four methods, indicating a significant advantage in reducing pollution emissions. The operation is simpler; after homogenization and centrifugation extraction, only the sample application step is required to complete the purification. Compared to the complex process of SPE single-sample consumption, which can take 200 minutes or more, m-PFC purification does not require steps such as activation, equilibration, or multiple rinses. Fig. 1 illustrates the process: the supernatant was removed and introduced into an m-PFC injector; the solution was transported to a centrifuge tube after one-by-one filtration and clean-up (1 drop per s). The one-stop clean-up procedure was completed in just 2 minutes. The subsequent within-laboratory testing was conducted by concentrating and replacing solutions; the time required for performing a single-sample test was less than 30 min. Thus, the m-PFC method outperforms the SPE method in clean-up efficiency, processing a larger volume of samples in less time, which potentially benefits inspectors' health and promotes environmental sustainability.
| Project | m-PFC | FLorisi PR SPE | C18 SPE | GCB SPE | Carbon SPE |
|---|---|---|---|---|---|
| Sample dosage | 10.0 g | 10.0 g | 10.0 g | 10.0 g | 10.0 g |
| Acetonitrile dosage | 20 mL | 20 mL | 20 mL | 42.5 mL | 42.5 mL |
| Hexane dosage | 1.0 mL | 22.5 mL | 22.5 mL | 1.0 mL | 1.0 mL |
| Acetone dosage | 1.0 mL | 2.5 mL | 2.5 mL | 1.0 mL | 1.0 mL |
| Toluene | — | — | — | 7.5 mL | 7.5 mL |
| Liquid waste | 15 mL | 22.0 mL | 22.0 mL | 25 mL | 25 mL |
| Utensil consumption | Less 50 mL PP tube × 1-pk, 10 mL PP tube × 1-pk | Multiple (such as funnels, plug measuring cylinder, etc.) | Multiple (such as funnels, plug measuring cylinder, etc.) | Multiple (such as funnels, plug measuring cylinder, etc.) | Multiple (such as funnels, plug measuring cylinder, etc.) |
| Average processing time/sample | Approx.30 min | Approx. 100 min | Approx. 100 min | Approx. 200 min | Approx. 150 min |
Comparison of different purification methods
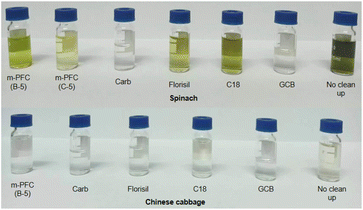
The experiment compared the purification effects and recovery rates of commonly used solid phase extraction (SPE) methods including Florisi PR-SPE, carbon-SPE, GCB-SPE, and C18-SPE in pesticide residue detection. As shown in Fig. 2 and 4. It was found that spinach, after purification with m-PFC C-5, appeared clearer than when purified with Florisi PR-SPE and C18-SPE, exhibiting a significant decrease in visible pigment content. In contrast, after purification with carbon-SPE and GCB-SPE, it was almost colorless. Similarly, Chinese cabbage, representing light-colored vegetables, appeared colorless after purification with all five methods. The purified solutions were further analyzed using high-performance liquid chromatography (HPLC) to determine the residual plant pigments at a wavelength of 425 nm (Fig. 3). Six distinct natural pigments were detected in the unpurified spinach solution, while none were detected in the GCB-SPE and m-PFC (C-5) purification solutions. A small amount of lutein was detected in the carbon-SPE purification solution, whereas phacophytin b, phacophytin a, and β-carotene were detected in the Florisi PR-SPE purification solution, albeit with significantly reduced content. Lutein, these pigments were also detected in the C18-SPE purification solution. No pigments were detected in the Chinese cabbage after purification using any of the five methods. In summary, GCB-SPE, carbon-SPE, and m-PFC (C-5) showed significant advantages in pigment adsorption.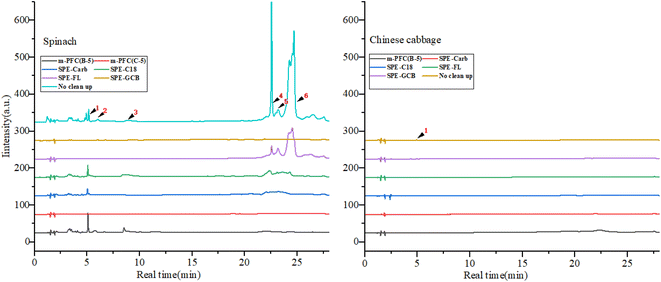 | ||
| Fig. 3 Natural colours after cleanup using different cleanup columns. Note: (1) lutein; (2) chlorophyll b; (3) chlorophyll a; (4) phacophytin b; (5) phacophytin a; (6) β-carotene. | ||
Interestingly, we from that although Carbon-SPE and GCB-SPE effectively recovery most pigments after purification, the recovery rates for most pesticides remained relatively high, especially for organochlorine and pyrethroid pesticides. Conversely, the overall recovery rate after C18-SPE purification was relatively low, suggesting poorer performance. This might be related to the presence of four pigments not completely removed during pigment detection in spinach. After purification with Florisi PR-SPE, six organophosphorus pesticides showed no recovery, whereas other pesticides demonstrated good recovery effects. This finding was further verified by subsequent experiments, as depicted in Fig. 4 and 5. Florisi PR-SPE and m-PFC (C-5) exhibited clear advantages in pesticide recovery rates in these experiments.
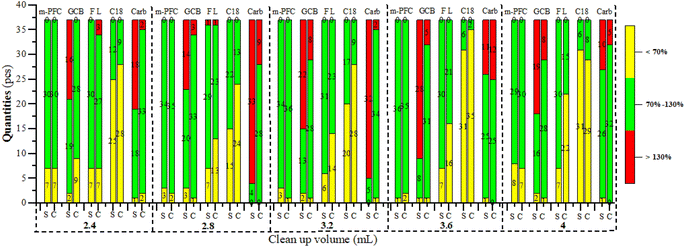 | ||
| Fig. 4 The effect of different purification column on the recovery rates at different purification volumes. | ||
Optimization of m-PFC purification volume
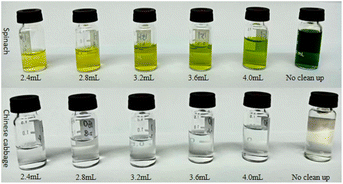
Commercial clean-up columns were selected because filler contents could be fixed. Therefore, the clean-up effect depended on the volume of clean-up liquid added. Clean-up volumes were optimized for spinach and Chinese cabbage, representatives dark and light matrices respectively. The spiking amount of pesticides was 0.1 mg kg−1, (n = 3). Filtration clean-up was conducted at the five-volume gradients, which were 2.4, 2.8, 3.2, 3.6, and 4 mL; Fig. 4 and 6 illustrate the clean-up effects, while Table 3 summarizes the recovery rates. Fig. 4 reveals that the larger the clean-up volume was, the darker the color was after clean-up; Table 3 shows that the recovery rate of multi-pesticides was also increased. In the range of 3.2 mL to 3.6 mL of purification volume, both Chinese cabbage and spinach showed good pesticide recovery rates (70–130%), and the results were relatively stable. Especially when the purification volume reached 3.2 mL, the recovery rates of 59.5% (22 pesticides) in spinach and 48.6% (18 pesticides) in Chinese cabbage reached their highest levels. However, when the clean-up volume exceeded 3.6 mL, the recovery rates of 4 pesticides (iprodione, dicofol, acephate, and fenitrothion) in spinach and 2 pesticides (procymidone and cyfluthrin) in Chinese cabbage continued to increase. Conversely, the recovery rates of the remaining pesticides began to decline. Therefore, when the clean-up volume was smaller (2.4 and 2.8 mL), the clean-up volumes of most pesticides were not enough and a small amount of pesticide residues was on the m-PFC clean-up column. Conversely, when the volume was expanded to 3.6 or 4 mL, the m-PFC clean-up column became overloaded, leading to incomplete clean-up and compromised recovery rates (Fig. 6). Additionally, the clean-up liquid darkened with larger volumes, further indicating inadequate clean-up. Therefore, the 3.6 mL extraction liquid was selected for clean-up in the experiment.| Pesticide name | m-PFC | SPE | |
|---|---|---|---|
| Spinach | Chinese cabbage | ||
| Dichlorvos | 0.01 | 0.01 | 0.01 |
| Methamidophos | 0.005 | 0.005 | 0.01 |
| Acephate | 0.01 | 0.01 | 0.03 |
| Diazinon | 0.01 | 0.01 | 0.02 |
| Dimethoate | 0.01 | 0.01 | 0.02 |
| Parathion-methyl | 0.01 | 0.01 | 0.02 |
| Fenitrothion | 0.01 | 0.01 | 0.02 |
| Isofenphos-methyl | 0.01 | 0.01 | — |
| Triazophos | 0.01 | 0.01 | 0.01 |
| Phosmet | 0.03 | 0.03 | 0.06 |
| Phorate | 0.01 | 0.01 | 0.02 |
| Omethoate | 0.01 | 0.01 | 0.02 |
| Monocrotophos | 0.02 | 0.01 | 0.03 |
| Chlorpyrifos | 0.02 | 0.01 | 0.02 |
| Malaoxon | 0.02 | 0.01 | 0.03 |
| Parathion | 0.01 | 0.01 | 0.02 |
| Isocarbophos | 0.01 | 0.01 | 0.03 |
| Profenofos | 0.01 | 0.01 | 0.04 |
| Phosalone | 0.03 | 0.03 | 0.05 |
| α-BHC | 0.0001 | 0.0001 | 0.0001 |
| β-BHC | 0.0001 | 0.0001 | 0.0004 |
| γ-BHC | 0.0001 | 0.0001 | 0.0002 |
| δ-BHC | 0.0001 | 0.0001 | 0.0001 |
| Vinclozolin | 0.0002 | 0.0002 | 0.0004 |
| Triadimefon | 0.0002 | 0.0002 | 0.001 |
| Procymidone | 0.0006 | 0.0005 | 0.002 |
| Fenpropathrin | 0.0004 | 0.0004 | 0.002 |
| Cyfluthrin | 0.0006 | 0.0005 | 0.002 |
| Flucythrinate | 0.0007 | 0.0006 | 0.001 |
| Tau-fluvalinate | 0.0005 | 0.0005 | 0.002 |
| Deltamethrin | 0.0004 | 0.0004 | 0.001 |
| Dicofol | 0.0005 | 0.0004 | 0.0008 |
| Iprodione | 0.0015 | 0.0023 | 0.001 |
| Bifenthrin | 0.0005 | 0.0004 | 0.0006 |
| Cyhalothrin | 0.0002 | 0.0002 | 0.0005 |
| Cypermethrin | 0.001 | 0.0009 | 0.003 |
| Fenvalerate | 0.0005 | 0.0004 | 0.002 |
Solid phase extraction purification volume optimization
When purified with Florisi PR-SPE, the pesticides acephate, dichlorvos, acetamiprid, oxydemeton-methyl, and diazinon showed no recovery across all tested gradients in both spinach and Chinese cabbage. The recovery rates for spinach remained within the method validation requirements (70–130%), with little variation as the purification volume increased. The highest recovery count (30) with rates within 70–130% was observed at 3.2 mL, for Chinese cabbage, the overall trend of recovery rates decreased as the purification volume increased, with the highest number of good recovery rates (27) at 2.4 mL. This resulted from using the same Florisi PR-SPE column amount of 1000 mg/6 mL for both dark and light matrices.When purified with C18-SPE both spinach and Chinese cabbage exhibited a pattern where recovery rates initially increased and then decreased, peaking at 2.8 mL. For purification with carbon-SPE, spinach reached its maximum recovery rates at 4 mL (34 recoveries), while Chinese cabbage showed its highest recovery at 3.2 mL (34 recoveries) without significant fluctuations. Conversely, with GCB purification, both spinach and Chinese cabbage displayed a general decline in recovery effectiveness, with spinach peaking at 2.8 mL (20 recoveries) within a range of 70–120%, and Chinese cabbage achieving its best at 3.6 mL (31 recoveries).
When purified with m-PFC from 2.4 mL to 4 mL, the method demonstrated higher recovery rates and greater effectiveness compared to the other four solid phase extraction methods. Notably, at 3.2 mL and 3.6 mL, both Chinese cabbage and spinach exhibited high recovery rates, with minimal variation between the two. Specifically, Chinese cabbage showed 34 and 36 recoveries, respectively, while spinach showed 36 and 35. Given the superior purification performance of Florisi PR-SPE at 3.2 mL, this volume was selected for further experiments.
Comparison of purification methods
Due to the adsorption of planar pesticides by GCB-SPE and carbon-SPE, 25% toluene (3![[thin space (1/6-em)]](https://www.rsc.org/images/entities/char_2009.gif) :
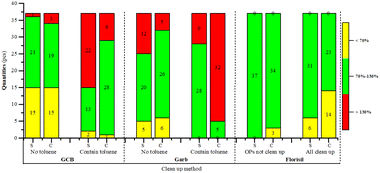
:![[thin space (1/6-em)]](https://www.rsc.org/images/entities/char_2009.gif) 1) was initially added to the acetonitrile eluent in preliminary experiments for protection. However, due to toluene is highly toxicity and environmental impact, the experiment was further conducted using only acetonitrile without toluene. The results indicated that omitting toluene generally increased the recovery rates of organophosphorus and organochlorine pesticides with GCB-SPE and carbon-SPE. Nonetheless, the results. Whether with or without toluene, were not ideal. These results are illustrated in Fig. 5.
1) was initially added to the acetonitrile eluent in preliminary experiments for protection. However, due to toluene is highly toxicity and environmental impact, the experiment was further conducted using only acetonitrile without toluene. The results indicated that omitting toluene generally increased the recovery rates of organophosphorus and organochlorine pesticides with GCB-SPE and carbon-SPE. Nonetheless, the results. Whether with or without toluene, were not ideal. These results are illustrated in Fig. 5.
In preliminary experiments, it was found that six organophosphorus pesticides had no recovery when purified with Florisi PR-SPE. Literature review revealed that Florisi PR-SPE is not suitable for purifying organophosphorus pesticides consequently, the experiment was limited to using Florisi PR-SPE for purification organochlorine and pyrethroid pesticides. It was observed that when organophosphorus pesticides were not subjected to purification, their recovery rates increased significantly. Recovery rates for spinach and cabbage ranged between 70% and 120%, with a total of 34 pesticides recovered. Research using GC-FPD to detect organophosphorus pesticides (OPPs) has indicated that matrix purification is unnecessary, aligning with findings from ‘Determination of Multiple Residues of Organophosphorus, Organochlorine, Pyrethroid, and Carbamate Pesticides in Vegetables and Fruits: NY/T 761-2008’.35 However, there are significant differences in matrices among fruits, vegetables, and edible fungi. Leafy vegetables have higher contents of N, P, and K;44 Sweet cherries have higher contents of anthocyanins and sugars;45 Mushrooms have polysaccharides as their main active components.46 The presence of these substances enhances the matrix effect, making the recovery rates of pesticides such as malathion, dichlorvos, acephate, oxydemeton-methyl, and prothiofos normal after purification. Therefore, in subsequent experiments, the Florisi PR-SPE solid-phase extraction method was used, and the organophosphorus pesticides were not purified, following the method described.
Comparison of clean-up effects
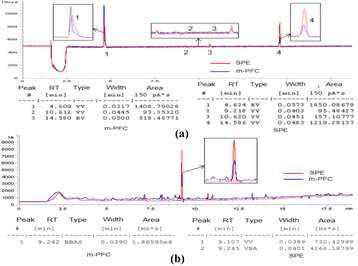
As shown in Fig. 4a, displays the detection of organophosphorus in the radish sample, after purification by the m-PFC method, the chromatogram revealed only three impurity peaks (No. 1, 3, and 4 in Fig. 8a). However, after purification using the SPE method, the chromatogram showed four impurity peaks, with both peak areas and heights greater than those observed after purification using the m-PFC method. The same effect also occurred in chromatograms of organochlorine (Fig. 8b): the matrix impurity peak height of the blank samples of Pleurotus ostreatus was reduced by half after m-PFC treatment and the area was reduced by five times compared to the samples treated with SPE. Accordingly, m-PFC clean up more thoroughly, has a stronger capacity to remove impurities, and is more conducive to reducing false positives.
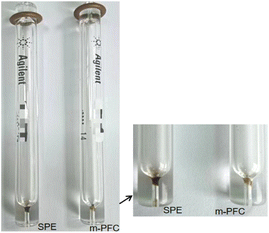 | ||
| Fig. 9 Comparison of liner tubes for 100 qrganophosphorus injections after processing by two methods. | ||
Fig. 9 (the enlarged figure on the right) reveals that the liner tube was clean after m-PFC treatment but dirty with many contaminants after SPE treatment. The accumulation of contaminants directly impacted the accuracy and sensitivity of test results, leading to contamination at the gasification end of the chromatographic column. Frequent replacement of liner tubes increased testing costs and further compromised the accuracy and sensitivity of test results due to column contamination. This suggests that m-PFC treatment results in less contamination to instruments compared to SPE treatment, reduces maintenance frequency and costs, and is more instrument-friendly.
Comparison of method performance
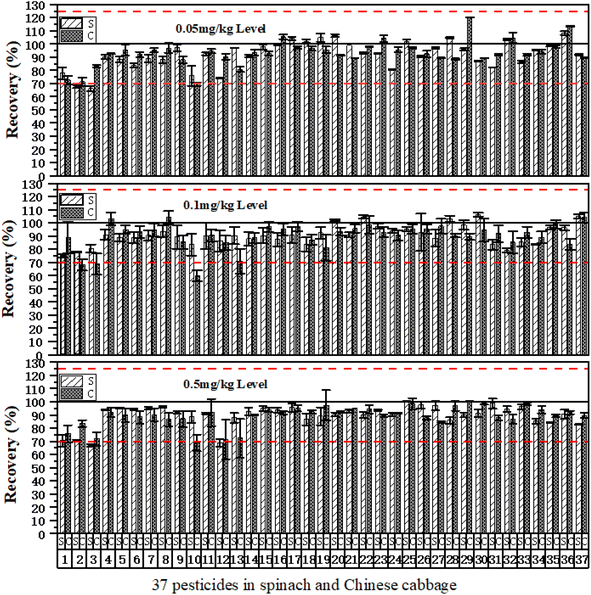 | ||
| Fig. 10 The relative standard deviations for 37 pesticides in spinach and Chinese cabbage were determined using the m-PFC method at three supplemental levels (n = 3). Note. S is spinach; C is Chinese cabbage. Table 1 lists the 37 pesticide names. | ||
Table 3 shows the LOD as quoted from a document by FLorisi PR-SPE;35 For each pesticide tested in spinach and Chinese cabbage using m-PFC, the LODs indicated that iprodione was 0.0015 mg kg−1 in spinach and 0.0023 mg kg−1 in Chinese cabbage, slightly higher than the SPE value of 0.001 mg kg−1. The LODs of five pesticides – dichlorvos, isofenphos-methyl (unavailable in SPE), triazophos, α-BHC, and δ-BHC – were identical to those form SPE; and the LODs of the other 31 pesticides were lower than their corresponding SPE values. Thus, the method meets the requirements for multi-pesticide residue testing in various plant products.
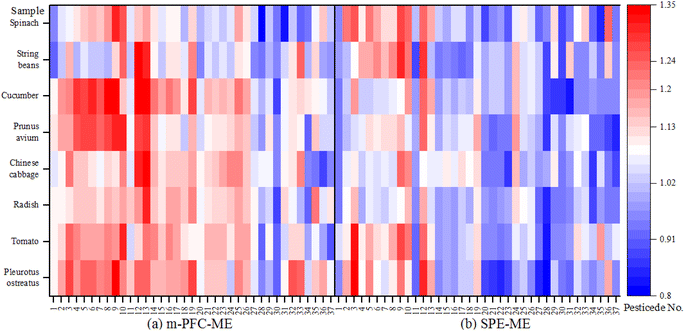
Herein, 0.1 mg L−1 standard solutions were prepared using the blank matrices of eight samples after they had been treated with m-PFC and SPE. Additionally, identical standard solutions were prepared with acetone and n-hexane. The slope ratio of the calibration curve generated using blank matrix solutions (k1) was compared with that of the reagent calibration (k2) to calculate the matrix effect (ME = k1/k2). It is commonly accepted that no ME occurs when ME = 1, matrix enhancement occurs when ME > 1, matrix attenuation occurs when ME < 1. ME values are typically found within the range of 0.8–1.2, which is considered an acceptable range.44 In the experiment, the MEs of 37 pesticides in 8 types of plants were compared (Fig. 11).
Fig. 11 shows that the ME values for the eight matrices determined using FLorisi PR-SPE ranged from 0.8 to 1.2. However, the ME values obtained using the m-PFC method were more varied. Matrix enhancement of organophosphorus pesticides was observed in 89.5% of cases (except for phorate, dichlorvos, and chlorpyrifos) across eight matrices in both m-PFC and FLorisi PR-SPE treatments. Matrix effects, whether enhancement or attenuation, occurred simultaneously for the same pesticide, such as methamidophos, acephate, and, omethoate, when pretreated in the same matrix under both Florisi PR-SPE and m-PFC. Additionally, the MEs of 6 pesticides (phorate, dichlorvos, triazophos, chlorpyrifos, phosalone, and phosmet) among the 19 tested organophosphorus pesticides were lower in m-PFC than in FLorisi PR-SPE. In contrast, the MEs of 15 organochlorine pesticides after m-PFC treatment were smaller than those in FLorisi PR-SPE. This shows that after using m-PFC, organophosphorus demonstrated strong matrix enhancement effects, but organochlorine demonstrated weak matrix attenuation effects and had weaker MEs after the treatment in m-PFC than SPE. Therefore, the blank matrix-matched standard curve was used to test samples to remove MEs.
Comparison of multi-sample accuracy and precision
Given that different MEs are exhibited by different samples and various interfering substances are contained, the testing results of the eight samples (the additive amount was 0.1 mg kg−1, n = 3) after treatment in m-PFC and SPE to verify the clean-up effects of m-PFC in different matrices, and calculated their average recoveries and RSDs.Table 4 shows good recovery effects were obtained in the eight samples in m-PFC; the average recoveries were 67.0–112.8%, and the RSDs were 0.2–15.2%. The average recoveries and mean values show that the average recoveries of the eight samples were above 83.8%, and this declared that the determination result deviations of the method were small, the precision was good, and the recovery rate was high. The recoveries of SPE testing were 60.2–111.2%, and RSDs were 0.5–14.2%; there were no significant differences in the average recovery rate and RSD after comparing the two methods. The multi-type fruit and vegetable sample results revealed that m-PFC could replace SPE to determine multi-pesticide residues of organophosphorus, organochlorine, and pyrethroids in multiple agricultural products.
| No. | Sample name | Method | Average recovery rate (%) | Median recovery rate (%) | Range of recovery rates (%) | RSD (%) |
|---|---|---|---|---|---|---|
| 1 | Pleurotus ostreatus | SPE | 85.4 | 85.8 | 67.0–103.6 | 1.4–13.5 |
| m-PFC | 87.6 | 87.3 | 72.1–103.0 | 0.9–9.6 | ||
| 2 | Tomato | SPE | 88.0 | 88.6 | 72.5–105.2 | 1.1–10.1 |
| m-PFC | 90.0 | 90.9 | 69.4–104.0 | 0.5–9.5 | ||
| 3 | Radish | SPE | 90.1 | 91.5 | 71.9–105.4 | 1.3–15.2 |
| m-PFC | 90.3 | 90.3 | 73.5–110.1 | 1.1–11.9 | ||
| 4 | Chinese cabbage | SPE | 88.1 | 90.4 | 69.4–102.8 | 0.5–8.5 |
| m-PFC | 90.3 | 93.2 | 60.2–104.3 | 1.4–11.9 | ||
| 5 | Sweet cherry | SPE | 84.7 | 83.8 | 68.3–102.8 | 0.5–9.5 |
| m-PFC | 83.3 | 83.1 | 67.4–102.7 | 1.1–6.9 | ||
| 6 | Cucumber | SPE | 87.5 | 86.6 | 77.3–108.5 | 0.2–9.1 |
| m-PFC | 88.2 | 87.0 | 73.4–107.8 | 0.6–8.3 | ||
| 7 | String beans | SPE | 92.7 | 93.7 | 77.3–108.5 | 1.0–15.5 |
| m-PFC | 88.9 | 89.2 | 66.7–111.1 | 0.7–12.2 | ||
| 8 | Spinach | SPE | 95.8 | 97.7 | 73.7–112.8 | 0.6–13.2 |
| m-PFC | 91.1 | 90.6 | 75.4–105.2 | 0.4–14.2 |
Real sample testing
Using m-PFC, tests was conducted on 150 agricultural product derived from plants, randomly selected from cultivation bases and market. The samples comprised 75 vegetable (including 10 bulbs, 10 brassicas, 45 leafy, 6 solanaceous, and 4 root vegetables), 15 edible fungi (6 Lentinula edodes and 9 Pleurotus ostreatus), and 60 fruit (10 citruses, 15 cherries, 15 strawberries, and 25 loquats). The results indicated that among 37 pesticides, 17 pesticides were detected from 258 sample times; 3 restricted drugs were detected from 12 sample times; 13 common pesticides were detected from 242 sample times; 2 prohibited pesticides (dicofol and fenvalerate) were detected from 4 sample times, and no other pesticides were detected. The predominant pesticides are the low-toxicity pyrethroid but with low toxicity levels, which met the National Food Safety Standard-Maximum Residue Limits for Pesticides in Food (China Limit Standard GB2763-2021).48 Therefore, the overall pass percent of the 150 samples was 100.0%; consequently, the fruit and vegetable samples in the batch were of quality safety.Conclusion
In total, 37 pesticides, comprising 19 organophosphorus, 9 organochlorine, and 9 pyrethroids, were analyzed in 8 agricultural products utilizing m-PFC combined with GC-ECD. The results were compared with those obtained using the traditional SPE method. Additionally, the method was applied to testing 150 real samples.It has been shown by the results that the accuracy and precision of the samples treated with m-PFC at three addition levels have been confirmed by GC-ECD to meet the requirements of (EU) 2021/808. The recoveries of the eight samples were 67.0–112.8%, the RSDs were 0.2–15.2%, and the average recoveries were above 83.8%. Furthermore, strong linearity was observed for 37 pesticides in the range of 0.05–1.6 μg mL−1; it was found that the matrix effects (MEs) of most pesticides treated with m-PFC were weaker than those treated with SPE, and the MEs for the eight matrices ranged from 0.8 to 1.2. LODs were recorded from 0.0001 to 0.03 μg kg−1, and for 31 pesticides, they were found to be lower than those obtained via SPE. The m-PFC method was successfully employed to test 150 real samples; resulting in the detection of 17 pesticides with low detected contents, and a pass rate of 100% was achieved. Therefore, the pretreatment method of m-PFC can replace SPE for testing multi-pesticide residues in multiple agricultural products in GC-ECD.
Impurities such as proteins and fats can be removed by hydroxyl (–OH), which can also react with both acids and bases to form salts and water, effectively improving hydrophilicity and salinization. Acidified substances such as saturated fatty acids, unsaturated fatty acids, and amino acids can be removed by alkyl (CnH2n+2), a long-chain alkyl carboxylic acid consisting of carbon and hydrogen atoms. Sterols and pigments are highly absorbed by hollow MWCNTs, which are hydrophobic. The conductivity and stability are further enhanced by magnetic MWCNTs, which are prevented from agglomeration or oxidation in organic solvents and aqueous environments. The m-PFC purification tube was introduced with the above bifunctional groups (–OH and CnH2n+2) as purification materials, around which the magnetic MWCNTs containing Fe+ were wrapped. The capture and adsorption of specific molecular impurities in the matrix are facilitated by the introduction of the above three substances.
Compared with the SPE method, liquid pigments were cleaned up more thoroughly by m-PFC, achieve fewer impurity peaks in blank matrices and higher multi-pesticide separation, and misjudgments of false positives were effectively reduced. Contamination to instruments was lighter, instrument maintenance times and costs were lowered, and it was made more instrument friendly by m-PFC. Meanwhile, fewer solvent reagents, utensils, and significantly fewer organic solvents were consumed by m-PFC than by SPE, and higher safety was achieved in eradicating result errors caused by component volatilization. The amount of waste liquid generated by m-PFC was only 1/10 of that generated by SPE; therefore, pollution emissions were significantly reduced. With much easier operation, compared to 200 min for a single-sample test in SPE, a one-stop clean-up was completed by m-PFC in only 2 minutes; the single-sample test time for m-PFC was less than 30 minutes, indicates a significant advantage in clean-up procedures. A larger batch of samples could be processed by m-PFC in a shorter period, which was beneficial for inspectors' physical health and was environmentally friendly. The m-PFC has been recognized as an effective testing method for primary testing laboratories that are only equipped with GC-ECD and lack funds, and do not have GC-MS/MS for conducting risk monitoring of pesticide residues in agricultural products, substantially improving the testing efficiency.
Nearly 100 articles on m-PFC technology have been published by researchers. It a new way of thinking for analysing trace substances by mass spectrometry and Raman spectroscopy is provided by it. Through extensive experiments conducted over one year, it has been determined that m-PFC can achieve a significant breakthrough in the field of chromatographic analysis, which is considered to be an unprecedented innovation.
Author contributions
Data curation, Yu Zhang; formal analysis, Xiaxue Li; funding acquisition, Xiaxue Li and Yan Zeng; validation, Bin Qu, Qiao Hui Yang, and Yan Zeng; investigation, Bin Qu; methodology, CanPing Pan and Tao Lan; resources, Ya Chen; supervision, Ya Chen; writing – original draft, Yan Zeng; writing – review & editing, CanPing Pan and Tao Lan. All authors have read and agreed to the published version of the manuscript.Conflicts of interest
There are no conflicts to declare.Acknowledgements
This work was funded by the Ya'an Municipal School Co-operation Program (No. 22SXHZ0075), the Agricultural Product Quality Safety Risk Monitoring Project of Sichuan Province of China in 2023 (Chuan Agricultural Letter [2023] No. 69), and the Guangxi Key Research and Development Program (No. AB21196039). We are grateful for the above funding.References
- S. A. Mir, B. N. Dar, M. M. Mir, S. A. Sofi, M. A. Shah, T. Sidiq, K. V. Sunooj, A. M. Hamdani and A. M. Khaneghah, Current strategies for the reduction of pesticide residues in food products, J. Food Compos. Anal., 2022, 106, 104274, DOI:10.1016/j.jfca.2021.104274.
- K. Sh. Krishan, T. Vandana, Sh. Khushbu, G. Ruchi, Y. Rajbir, D. Suneeta and W. Suresh, Long–term monitoring of 155 multi–class pesticide residues in Indian vegetables and their risk assessment for consumer safety, Food Chem., 2021, 373, 131518, DOI:10.1016/j.foodchem.2021.131518.
- X. Jing, W. Zhang and J. Xie, Monitoring and risk assessment of pesticide residue in plant-soil-groundwater system about medlar planting in Golmud, Environ. Sci. Pollut. Res., 2021, 28, 26413–26426, DOI:10.1007/s11356-021-12403-0.
- C. C. Luis, D. P. Giulio, D. Bruno and M. P. Paula, The 2021 European Union report on pesticide residues in food, EFSA J., 2023, 21(4), e07939, DOI:10.2903/j.efsa.2023.7939 , EFSA-Q-2022-00769..
- C. Amélie, M. L. The, B. Janis, E. B. Polly, E. Julie, K. Marc, M. Isabelle, M. David, N. Steve, R. Rainer, J. Y. Hae and V. Philippe, An international probabilistic risk assessment of acute dietary exposure to pesticide residues in relation to codex maximum residue limits for pesticides in food, Food Control, 2021, 121, 107563, DOI:10.1016/j.foodcont.2020.107563.
- A. S. Haizarul, M. Ahmad and S. Bahruddin, Determination of organophosphorus pesticide residues in vegetables using solid phase micro-extraction coupled with gas chromatography–flame photometric detector, Arabian J. Chem., 2019, 12, 1934–1944, DOI:10.1016/j.arabjc.2014.12.001.
- L. L. Ma, L. H. Cao, Y. C. Feng, L. Jia, C. Liu, Q. Ding, J. Liu, P. Shao and C. P. Pan, Automatic multi-plug filtration cleanup tip-filtration with ultra-performance liquid chromatography/tandem mass spectrometry detection for 22 pesticide residues in typical vegetables, J. Chromatogr. Sci., 2023, 61(6), 559–568, DOI:10.1093/chromsci/bmac104.
- Y. Y. Wang, Zh. J. Meng, Ch. Y. Su, S. F. Fan, Y. Li, H. Y. Liu, X. Zhang, P. P. Chen, Y. Y. Geng and Q. Li, Rapid screening of 352 pesticide residues in chrysanthemum flower by gas chromatography coupled to quadrupole-orbitrap mass spectrometry with sin-QuEChERS nanocolumn extraction, J. Anal. Methods Chem., 2022, 17, 7684432, DOI:10.1155/2022/7684432.
- C. Yu, D. Hao, Q. Chu, T. Wang, S. Liu and T. Lan, A one adsorbent QuEChERS method coupled with LC-MS/MS for simultaneous determination of 10 organophosphorus pesticide residues in tea, Food Chem., 2020, 321, 126657, DOI:10.1016/j.foodchem.2020.126657.
- Y. T. Liao, Y. H. Zhang, Q. Y. Zhao, W. Xiang, B. N. Jiao and X. S. Su, MIL-101(Cr) based d-SPE/UPLC-MS/MS for determination of neonicotinoid insecticides in beverages, Microgram J., 2022, 175, 107091, DOI:10.1016/j.microc.2021.107091.
- T. Lan, Q. Chu, D. Y. Hao, S. N. Liu, X. J. Xi, C. P. Pan and W. B. Zhang, Simultaneously Detection of 10 organophosphorus pesticides residues in tea by sin-QuEChERS with UPLC-MS/MS, J. Chin. Mass Spectrom., 2019, 40, 268–279, DOI:10.7538/zpxb.2018.0123.
- T. Cang, C. Sun, H. Zhao, T. Tang, C. Zhang, R. Yu, X. Wang, Q. Wang, F. Dai and X. Zhao, Residue behavior and risk assessment of imidacloprid applied on greenhouse cultivated strawberries under different application conditions, Environ. Sci. Pollut. Res., 2018, 25(5), 5024–5032 CrossRef CAS PubMed.
- D. B. Alcântara, T. S. M. Fernandes, H. O. Nascimento, A. F. Lopes, M. G. G. Menezes, A. C. A. Lima, T. V. Carvalho, P. Grinberg, L. Aparecida, M. H. B. Milhome, A. Oliveira, H. Becker, G. J. Zocolo and R. F. Nascimento, Diagnostic detection systems and QuEChERS methods for multiclass pesticide analyses in different types of fruits: An overview from the last decade, Food Chem., 2019, 124958, DOI:10.1016/j.foodchem.2019.124958.
- Q. Hu and C. Zhang, Screening of multi-pesticide residues in edible fungi by SPE and GC-MS, Food Sci., 2015, 36, 171–175 CAS . https://kns.cnki.net/kcms/detail/detail.aspx?FileName=SPKX201514041%26DbName=CJFQ2015.
- M. Shamsipur, N. Yazdanfar and M. Ghambarain, Combination of solid-phase extraction with dispersive liquid-liquid microextraction followed by GC-MS for determination of pesticide residues from water, milk, honey and fruit juice, Food Chem., 2016, 204, 289–297, DOI:10.1016/j.foodchem.2016.02.090.
- N. Pallarés, G. Font, J. Mañes and E. Ferrer, Multimycotoxin LC-MS/MS analysis in tea beverages after dispersive liquid-liquid microextraction (DLLME), J. Agric. Food Chem., 2017, 65(47), 10282–10289, DOI:10.1021/acs.jafc.7b03507.
- S. H. Zhang, Q. Yang, X. M. Yang, W. C. H. Wang, Z. H. Li, L. H. Zhang, C. H. Wang and Z. H. Wang, A zeolitic imidazolate framework based nanoporous carbon as a novel fiber coating for solid-phase microextraction of pyrethroid pesticides, Talanta, 2017, 166, 46–53, DOI:10.1016/j.talanta.2017.01.042.
- Y. B. Luo, H. B. Zheng, X. Y. Jiang, X. Li, H. F. Zhang, F. P. Zhu, Y. Q. Pang and Y. Q. Feng, Determination of pesticide residues in tobacco using modified QuEChERS procedure coupled to online gel permeation chromatography-gas chromatography/tandem mass spectrometry, Chin. J. Anal. Chem., 2015, 43, 1538–1544, DOI:10.1016/S1872-2040(15)60870-2.
- S. Ireneusz, W. K. Magdalena, S. Maciej, S. Jan, S. Michał, D. Sławomir, S. Wojciech, M. Jarosław and M. L. Silica, Modified with polyaniline as a potential sorbent for matrix solid phase dispersion (MSPD) and dispersive solid phase extraction (d-SPE) of plant samples, Mater, 2018, 11(4), 467, DOI:10.3390/ma11040467.
- L. Hyosub, C. Yuran, J. Geonhee, K. Hyanghee and J. Wontae, Comparison of recovery efficiency and matrix effect reduction in pesticide residue analysis: QuEChERS with d-SPE, SPE, and FaPEx in apples and korean cabbage, Anal. Methods, 2023, 15, 3709–3716, 10.1039/d3ay00612c.
- T. M. Rizzetti, M. Kemmerich, M. L. Martins, O. D. Prestes, M. B. Adaime and R. Zanella, Optimization of a QuEChERS based method by means of central composite design for pesticide multiresidue determination in orange juice by UHPLC−MS/MS, Food Chem., 2016, 196, 25–33, DOI:10.1016/j.foodchem.2015.09.010.
- P. Y. Zhao, S. F. Fan, C. Sh. Yu, J. Y. Zhang and C. P. Pan, Multiplug filtration clean-up with multiwalled carbon nanotubes in the analysis of pesticide residues using LC-ESI-MS/MS, J. Sep. Sci., 2013, 36(20), 3379–3386, DOI:10.1002/jssc.201300411.
- Z. J. Meng, Q. Li, J. H. Cong, Y. X. Huang, D. Wang, C. P. Pan, S. F. Fan and Y. Zhang, Rapid screening of 350 pesticide residues in vegetable and fruit juices by multi-plug filtration cleanup method combined with gas chromatography-electrostatic field orbitrap high resolution mass spectrometry, Foods, 2021, 10(7), 1651, DOI:10.3390/foods10071651.
- N. Zou, Y. T. Han, Y. J. Li, Y. H. Qin, K. J. Gu, J. R. Zhang, C. P. Pan and X. S. Li, Multiresidue method for determination of 183 pesticide residues in leeks by rapid multiplug filtration cleanup and gas chromatography–tandem mass spectrometry, J. Agric. Food Chem., 2016, 64(31), 6061–6070, DOI:10.1021/acs.jafc.5b05132.
- Y. Wu, Q. An, J. Wu, P. Li, J. He and C. Pan, Development and evaluation of an automated multi-channel multiplug filtration cleanup device for pesticide residue analysis on mulberry leaves and processed tea, RSC Adv., 2020, 10, 2589–2597, 10.1039/C9RA09660D.
- R. M. Asensio, B. J. Hernández, M. T. Borges and D. M. Rodríguez, Evaluation of multi-walled carbon nanotubes as solid-phase extraction adsorbents of pesticides from agricultural, ornamental and forestal soils, Anal. Chim. Acta, 2009, 647(2), 167–176, DOI:10.1016/j.aca.2009.06.014.
- R. M. Asensio, G. L. D'Orazio, B. J. Hernández, A. Rocco and S. Fanali, Multi-walled carbon nanotubes–dispersive solid-phase extraction combined with nano-liquid chromatography for the analysis of pesticides in water samples, Anal. Biochem., 2011, 400(4), 1113–1123, DOI:10.1007/s00216-011-4885-7.
- P. Y. Zhao, B. Huang, Y. J. Li, Y. T. Han, N. Zou, K. J. Gu and C. P. Pan, Rapid multiplug filtration cleanup with multiple-walled carbon nanotubes and gas chromatography–triple-quadruple mass spectrometry detection for 186 pesticide residues in tomato and tomato products, J. Agric. Food Chem., 2014, 62(17), 3710–3725, DOI:10.1021/jf405240j.
- Y. T. Han, L. Song, S. W. Liu, N. Zou, Y. J. Li, Y. Qin, X. S. Li and C. P. Pan, Simultaneous determination of 124 pesticide residues in Chinese liquor and liquor-making raw materials (sorghum and rice hull) by rapid Multi-plug Filtration Cleanup and gas chromatography-tandem mass spectrometry, Food Chem., 2018, 15(241), 258–267, DOI:10.1016/j.foodchem.2017.08.103.
- Y. H. Qin, P. Y. Zhao, S. F. Fan, Y. T. Han, Y. J. Li, N. Zou, S. Y. Song, Y. Zhang, F. B. Li, X. S. Li and C. P. Pan, The comparison of dispersive solid phase extraction and multi-plug filtration cleanup method based on multi-walled carbon nanotubes for pesticides multi-residue analysis by liquid chromatography tandem mass spectrometry, J. Chromatogr. A, 2015, 13(1385), 1–11, DOI:10.1016/j.chroma.2015.01.066.
- L. Song, W. B. Zeng, A. Li, C. P. Pan and L. G. Pan, Automated multi-plug filtration cleanup method for analysis of 48 pesticide residues in green tea using liquid chromatography-tandem mass spectrometry, Food Control, 2022, 131, 108436, DOI:10.1016/j.foodcont.2021.10843.
- Y. H. Qin, J. R. Zhang, Y. N. He, Y. T. Han, N. Zou, Y. J. Li, H. CR, X. S. Li and C. P. Pan, Automated multiplug filtration cleanup for pesticide residue analyses in kiwi fruit (Actinidia chinensis) and kiwi juice by gas chromatography–mass spectrometry, J. Agric. Food Chem., 2016, 64, 6082–6090, DOI:10.1021/acs.jafc.5b06027.
- Y. H. Qin, F. Jatamunua, J. R. Zhang, Y. J. Li, Y. T. Han, N. Zou, J. H. Shan, Y. B. Jiang and C. P. Pan, Analysis of sulfonamides, tilmicosin and avermectins residues in typical animal matrices with multi-plug filtration cleanup by liquid chromatography−tandem mass spectrometry detection, J. Chromatogr. B: Anal. Technol. Biomed. Life Sci., 2017, 1053, 27–33, DOI:10.1016/j.jchromb.2017.04.006.
- Y. Wang, T. J. Huang, T. Zhang, X. P. Ma, G. S. Zhou, M. Y. Chi, X. J. Geng, C. H. Yuan and N. Zou, Residue levels and dietary intake risk assessments of 139 pesticides in agricultural produce using the m-PFC method based on SBA-15-C18 with GC-MS/MS, Molecules, 2023, 28, 2480, DOI:10.3390/molecules28062480.
- X. W. Liu, G. X. Mai, L. Y. Li, W. J. Li, L. Wang, J. G. Lv, F. Z. Liu, C. W. Liu and Y. R. Wang, NY/T 761-2008 Pesticide multiresidue screen methods for determination of organophosphorus, pesticides, organochlorine pesticides, pyrethroid pesticides and carbamate pesticides in vegetables and fruits, Min. Agri. Peo’s China, 2008, vol. 04–30, p. 32 Search PubMed.
- S. H. S. H. Pan, J. L. Lu, X. l. Yang, X. Q. Zheng, Y. Y. Du, B. Devijat and Y. R. Liang, Study on HPLC Method for the Analysis of trace pigments in ready-to-drink tea, J. Tea Sci., 2007, 27(4), 343–348, DOI:10.13305/j.cnki.jts.2007.04.014.
- Q. Q. Cao, G. S. H. Chen, Y. Q. Xu and J. F. Yin, Studies on the color change and internal mechanism of the huangjinya fresh tea leaves during tea processing, J. Chin. Inst. Food Sci. Technol., 2020, 20(04), 125–133, DOI:10.16429/j.1009-7848.2020.04.017.
- Commission implementing regulation (EU) 2021/808 of 22 march 2021 on the performance of analytical methods for residues of pharmacologically active substances used in food-producing animals and on the interpretation of results as well as on the methods to be used for sampling and repealing Decisions 2002/657/EC and 98/179/EC (text with EEA relevance), Off. J. Eur. Communities: Legis. 2021, 5, 21, 180 Search PubMed.
- Y. S. Jung, D. B. Kim, T. G. Nam, D. W. Seo and M. Y. Yoo, Identification and quantification of multi-class veterinary drugs and their metabolites in beef using LC-MS/MS, Food Chem., 2022, 15, 382, DOI:10.1016/j.foodchem.2022.132313.
- A. D. Jaime, M. G. David, G. L. Bienvenida, M. D. Antonio and F. G. Juan, Matrix-effect free multi-residue analysis of veterinary drugs in food samples of animal origin by nanoflow liquid chromatography high resolution mass spectrometry, Food Chem., 2018, 245, 29–38, DOI:10.1016/j.foodchem.2017.10.083.
- M. T. Selim, M. M. Almutari, H. I. Shehab and M. H. Elsaeid, Risk assessment of pesticide residues by GC-MSMS and UPLC-MSMS in edible vegetables, Molecules, 2023, 28(3), 1343, DOI:10.3390/molecules28031343.
- M. Tankiewicz and A. Berg, Improvement of the QuEChERS method coupled with GC–MS/MS for the determination of pesticide residues in fresh fruit and vegetables, Microchem. J., 2022, 181, 107794, DOI:10.1016/j.microc.2022.107794.
- Y. Su, J. Lu and J. Liu, et al., Optimization of a QuEChERS–LC–MS/MS method for 51 pesticide residues followed by determination of the residue levels and dietary intake risk assessment in foodstuffs, J. Food Chem., 2024, 434, 137467, DOI:10.2139/ssrn.4476401.
- S. H. Z. H. Liang, P. Shi, W. D. Ma, Q. G. Xing and L. J. Yu, Relational analysis of spectra and red-edge characteristics of plantleaf and leaf biochemical constituent, J.Chin. Eco-Agri., 2010, 18(4), 804–809, DOI:10.3724/SP.J.1011.2010.00804.
- Y. Chen, F. Cai, J. Y. Ai, M. L. He, M. Wu and Q. J. Zhang, Advances in sweet cherry fruit quality research, Chin. Fruit Tree, 2024,(2), 6–11, DOI:10.16626/j.cnki.issn1000-8047.2024.02.002.
- X. Y. Liu, X. J. Liang, J. G. Ma and F. Wei, Biological activities of mushroom polysaccharides and their application in chicken and pig farming, Chin. J. Anim. Sci., 2024, 02(08), 1–12, DOI:10.19556/j.0258-7033.20230602-03.
- P. Panuwet, R. E. Hunter, P. E. D'Souza, X. Y. Chen, S. A. Radford, J. R. Cohen, M. E. Marder, K. Kartavenka, P. B. Ryan and D. B. Barr, Biological matrix effects in quantitative tandem mass spectrometry-based analytical methods: advancing biomonitoring, Crit. Rev. Anal. Chem., 2016, 46(2), 93–105, DOI:10.1080/10408347.2014.980775.
- GB 2763-2021 National food safety standard- Maximum residue limits for pesticides in food, CNHSC&SAMSAR&Min. Agri. Rural China, 2021, vol. 09, 03 Search PubMed.
| This journal is © The Royal Society of Chemistry 2024 |

