 Open Access Article
New insight into the plastic deformation mechanisms during the SiO2 phase transition process†
Zhenlun
Wei
a,
Yubiao
Li
 *ab,
Peiyue
Li
cd,
Li
Pan
d,
Wanqing
Li
a,
Xianglin
Hu
a and
Yunxiang
Gu
a
aSchool of Resources and Environmental Engineering, Wuhan University of Technology, 122, Luoshi Road, Hongshan District, Wuhan 430070, Hubei, China. E-mail: yubiao.li@whut.edu.cn
bKey Laboratory of Green Utilization of Critical Non-metallic Mineral Resources, Ministry of Education, Wuhan 430070, Hubei, China
cNational Innovation Center for Advanced Glass Materials, Bengbu, Anhui 233018, PR China
dCNBM Research Institute for Advanced Glass Materials Group Co., Ltd, Bengbu, 233018, PR China
First published on 19th February 2024
Abstract
The removal of lattice impurities is the key to the purification of high-purity quartz (HPQ), especially for the intracell lattice impurities. Generally, the intracell lattice impurities can be migrated to the quartz surface via roasting, then removed by acid leaching. In order to reveal the phase transition of quartz during the roasting process, the evolution of structure, bond length, volume, lattice parameter and lattice stress in original, Ti4+, Al3+/Li+ and 4H+ substituted SiO2 phases were employed to investigate the mechanisms of plastic deformation based on density functional theory calculations. Results showed that the evolution of bond lengths and volumes were mainly dominated by phase transition, and the interstitial volume in high temperature SiO2 phases was higher than that in low temperature, indicating that the phase transition from α-quartz to β-cristobalite was beneficial to the migration of interstitial impurities. In addition, the phase transition from α-quartz to β-cristobalite needs to overcome the energy barriers while the phase transition from α-cristobalite to β-cristobalite needs to overcome the lattice stress. This study therefore provides an excellent theoretical basis for the plastic deformation mechanism, for the first time, beneficial to understanding the removal mechanisms of lattice impurities.
1 Introduction
The quartz crucible prepared using high-purity quartz (HPQ) is a necessary container for monocrystalline silicon,1,2 significantly influencing the healthy development of semiconductors, 5G communications, new energy and other industrial fields.3 The key to the purification of HPQ, especially for 5N HPQ (SiO2 content ≥ 99.999%) is to remove the lattice impurities.4–6 Normally, the lattice impurities can be divided into lattice substitution impurity and lattice interstitial impurities based on their location.7,8 In terms of substitution configuration of a single Si atom, lattice impurities can be divided into three kinds, i.e., simple substitution (such as the substitution of Si4+ by Ti4+), substitution with interstitial charge compensator (such as the substitution of Si4+ by Al3+/Li+), and silanol groups (the substitution of Si4+ by 4H+).9–13Generally, the lattice impurities can be removed via roasting and leaching process.10,14–16 Within which, the leaching process can only remove the surface impurities,10 while the lattice impurities can migrate from the intracell to surface during high-temperature roasting process. For instance, Wei et al.16 investigated the migration mechanisms during phase transition from α-quartz to β-quartz, suggesting that the lattice impurity of Al3+ and Li+ migrated from intracell to quartz sand surface via the c axis. Wu et al.17 indicated that the lattice impurities of Al3+, Fe3+, K+ and Ti4+ migrated from intracell to surface during the NH4Cl roasting process.
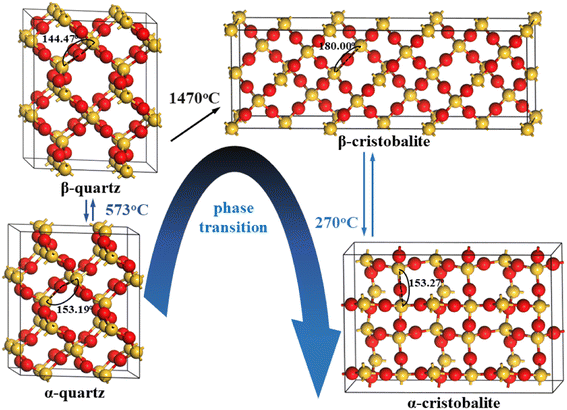
In addition, quartz normally undergoes phase transition process during roasting. Götze et al.18 reported 15 polymorph SiO2 phases, e.g., the most common phases were α-quartz, β-quartz, β-cristobalite and α-cristobalite, etc. The phase transition from α-quartz to β-quartz, from β-quartz to β-cristobalite and from β-cristobalite to α-cristobalite occurred at 573 °C, 1470 °C and 270 °C, respectively.19–23 However, the plastic deformation mechanisms during these phase transitions were still unclear, which significantly affected the properties of SiO2 lattice and the removement of lattice impurities. For instance, Wei et al.16 indicated that the interstitial volume was increased during the phase transition from α-quartz to β-quartz, beneficial to the migration of lattice interstitial impurities, such as Li+. Blankenburg et al.24 found that the defects or twinning formed during the phase transition from α-quartz to β-quartz influenced the distribution of lattice impurities.
In this case, the phase transition of original and substitution SiO2 phases were employed to investigate the plastic deformation mechanism during roasting process based on the density functional theory (DFT) calculation. Specifically, α-quartz, β-quartz, β-cristobalite and α-cristobalite were considered as the original SiO2 phases, and Ti4+, Al3+/Li+ and 4H+ were considered as the impurity ion substituted in the crystal of quartz. This study, for the first time, clearly revealed the evolution of structure, bond length, volume, lattice parameter, lattice stress and energy in original, and substituted (Ti4+, Al3+/Li+ and 4H+) SiO2 phases, therefore providing an excellent theoretical basis for the plastic deformation during the phase transition process, beneficial to understanding the removal mechanisms of lattice impurities.
2 Methodology
Similar to our previous research,16 the generalized gradient approximation (GGA) with PW91 correlation potential was considered to perform the DFT calculation through Materials Studio in CASTEP package.25 A kinetic energy cutoff of 360 eV was chosen for the geometric optimization calculation, and the Monkhorst–Pack scheme k-point meshes were 3 × 3 × 4, 2 × 2 × 3, 1 × 2 × 2 and 1 × 1 × 2 for α-quartz, β-quartz, β-cristobalite and α-cristobalite. The interstitial volume was calculated through the methods in our previous research.16 And the lattice stress was calculated viaeqn (1):26,27| SL = −B × (ΔV/V) | (1) |
| Ef = Etol − aESi − bEO − cETi − dEAl − eELi − fEH | (2) |
3 Results and discussion
3.1 Structure of original SiO2 phases
In order to better compare the plastic deformation mechanisms between typical SiO2 phases, the supercells with the same number of atoms (all in 72 atoms) of 2 × 2 × 2 α-quartz, 2 × 2 × 2 β-quartz, 3 × 1 × 1 β-cristobalite and 3 × 2 × 1 α-cristobalite were employed to perform the geometric optimization calculation, and the optimized structures were shown in Fig. 1.These typical SiO2 phases had similar arrangement of atoms, e.g., each Si atom was boned with four surrounding O atoms to form a silica tetrahedron (i.e., four Si–O bonds), and each O atom was boned with two surrounding Si atoms to connect silica tetrahedron.16,29,30 However, the specific Si–O bond length and Si–O–Si angle were different for these typical SiO2 phases, i.e., the Si–O bond length were 1.619/1.625 Å, 1.614 Å, 1.608 Å and 1.615/1.619 Å in α-quartz, β-quartz, β-cristobalite and α-cristobalite, while the Si–O–Si angle were 153.19°, 144.47°, 180.00° and 153.27°, respectively (Table 1), resulting in different crystal systems for these typical SiO2 phases, i.e., trigonal, hexagonal, cubic and tetragonal for α-quartz, β-quartz, β-cristobalite and α-cristobalite, respectively.18,20–23
| Lattice parameters | α-Quartz | β-Quartz | β-Cristobalite | α-Cristobalite |
|---|---|---|---|---|
| Supercell size | 2 × 2 × 2 | 2 × 2 × 2 | 3 × 1 × 1 | 3 × 2 × 1 |
| Atomic number | 72 | 72 | 72 | 72 |
| a (Å) | 9.923 | 10.097 | 22.278 | 15.377 |
| b (Å) | 9.923 | 10.097 | 7.425 | 10.247 |
| c (Å) | 10.945 | 11.214 | 7.425 | 7.141 |
| Volume (Å3) | 933.224 | 990.088 | 1228.300 | 1125.240 |
| Si–O bond (Å) | 1.619/1.625 | 1.614 | 1.608 | 1.615/1.619 |
| O–Si–O angle (°) | 153.19 | 144.47 | 180.00 | 153.27 |
In addition, the bulk volumes were 933.224 Å3, 990.088 Å3, 1228.300 Å3 and 1125.240 Å3 for α-quartz, β-quartz, β-cristobalite and α-cristobalite (Table 1), giving an order of bulk volume in β-cristobalite > α-cristobalite > β-quartz > α-quartz, indicating that the bulk volumes in cristobalite phases were greater than that in quartz phases. Moreover, the bulk volume in high temperature SiO2 phases were higher than that in low temperature SiO2 phases. In this case, the bulk volume of these typical SiO2 phases was related to the temperature of the phase transition.
3.2 Evolution of bond length
The substitution of Si4+ by Ti4+, Al3+/Li+ and 4H+ were performed to investigate the influence of impurity ion to the plastic deformation process from α-quartz to α-cristobalite. The structures of original and substitution 2 × 2 × 2 α-quartz, 2 × 2 × 2 β-quartz, 3 × 1 × 1 β-cristobalite and 3 × 2 × 1 α-cristobalite were shown in Fig. 2, S1, S2 and S3,† respectively. From Fig. 2, four Ti–O, Al–O and H–O bonds were formed when Si4+ was substituted by Ti4+, Al3+/Li+ and 4H+, while the Li in the interstitial of the lattice did not bonded with the surrounding O atoms (Fig. 2(c)). In addition, the changes of structure caused by impurity ion substitution (Fig. 2) were significant smaller than that caused by phase transition (Fig. 1), the impurity substitution only affected the length of the surrounding Si–O bonds. Similar structure changes were observed in β-quartz, β-cristobalite and α-cristobalite, thus the bond lengths in these original and substitution typical SiO2 phases were investigated to clarify the plastic deformation caused by impurity ion substitution and phase transition.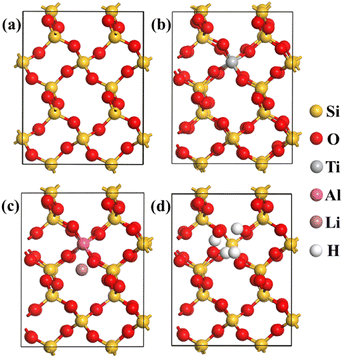 | ||
| Fig. 2 Structures of optimized original and Ti4+, Al3+/Li+ and 4H+ substituted 2 × 2 × 2 α-quartz supercells: (a) Si24O48; (b) Si23TiO48; (c) Si23AlLiO48; (d) Si23H4O48. | ||
The average bond lengths of Si–O, Ti–O, Al–O and H–O bonds in original and substituted SiO2 phases were shown in Fig. 3. Overall, the average bond lengths were in an order of Ti–O > Al–O > Si–O > H–O bonds, since the ionic radius for Ti4+, Al3+, Si4+ and H+ were 0.61 Å, 0.54 Å, 0.40 Å and 0.24 Å.18,31 For the Si–O bonds, the average Si–O bond lengths for α-quartz, β-quartz, β-cristobalite and α-cristobalite in the original phases were 1.622 Å, 1.614 Å, 1.608 Å and 1.617 Å, respectively. It was clearly that the average Si–O bond lengths in β-quartz (or β-cristobalite) were shorter than that in α-quartz (or α-cristobalite).16 Same evolution rules for average Si–O bond lengths were presented in Ti4+, Al3+/Li+ and 4H+ substituted SiO2 phases, indicating that the average Si–O bond lengths in high temperature were shorter than that in low temperature for all original and substituted SiO2 phases. In addition, the average Si–O bond length changes caused by phase transition were more significant than that due to substitution, e.g., the changes caused by the phase transition were −0.008 Å (i.e., 1.614–1.622 Å), −0.014 Å (i.e., 1.608–1.622 Å) and −0.005 Å (i.e., 1.617–1.622 Å) from α-quartz to β-quartz, β-cristobalite and α-cristobalite, respectively, while caused by Ti4+, Al3+/Li+ and 4H+ substitution for α-quartz were −0.002 Å (i.e., 1.620–1.622 Å), 0.002 Å (i.e., 1.624–1.622 Å) and −0.004 Å (i.e., 1.618–1.622 Å), respectively (Fig. 3(a)).
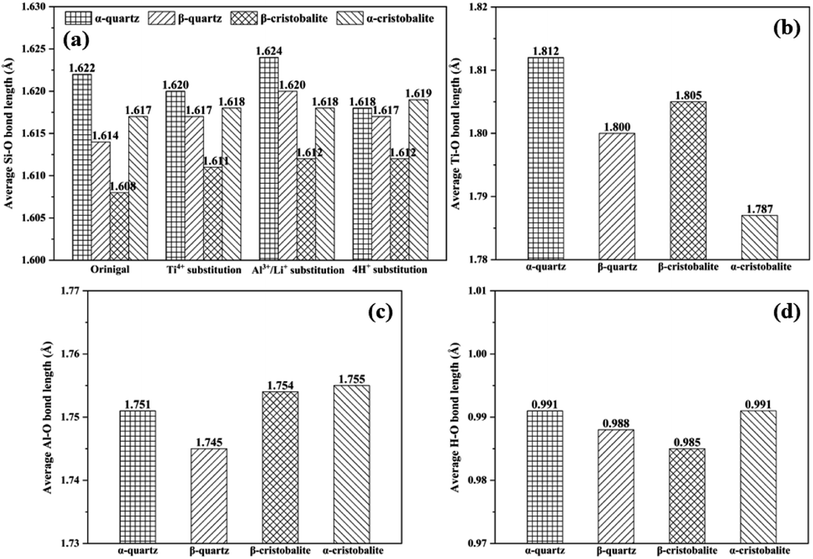 | ||
| Fig. 3 Average bond length of original and substituted SiO2 phases: (a) Si–O bonds; (b) Ti–O bonds; (c) Al–O bonds; (d) H–O bonds. | ||
The evolution rules of Al–O and H–O bonds were similar to Si–O bonds during the plastic deformation process, i.e., the average bond lengths in high temperature SiO2 phases were shorter than that in low temperature. However, the evolution rule was only applied to the phase transition of α-quartz to β-quartz for the Ti–O bonds. In contrast, the average Ti–O bond length in β-cristobalite was longer than that in α-cristobalite, i.e., the average Ti–O bond lengths were 1.812, 1.800, 1.805 and 1.787 Å for Ti4 substitution α-quartz, β-quartz, β-cristobalite and α-cristobalite, respectively, may due to the higher fusion point of Ti than Si and Al (i.e., 1668 °C, 1410 °C and 660 °C for Ti, Si and Al). Overall, the evolution of bond length was mainly dominated by phase transition rather than impurity ion substitution.
3.3 Evolution of volume
Fig. 4 showed the bulk and interstitial volume of original and substituted SiO2 phases. Both the phase transition and the impurity ion substitution increased the bulk volume. Similar to the original SiO2 phases as discussed in Section 3.1, the bulk volumes for the phase transformed SiO2 phases were larger than that of the ion substituted phase, giving an order of bulk volume in β-cristobalite > α-cristobalite > β-quartz > α-quartz, further indicating greater bulk volume in high temperature SiO2 phases than that in low temperature for all SiO2 phases. For instance, the bulk volume changes caused by phase transition were 56.864 Å3 (i.e., 990.088–933.224 Å3), 295.076 Å3 (i.e., 1228.300–933.224 Å3) and 192.016 Å3 (i.e., 1125.240–933.224 Å3) from α-quartz to β-quartz, α-cristobalite and β-cristobalite, while the bulk volume changes caused by Ti4+, Al3+/Li+ and 4H+ substitution for α-quartz were 43.336 Å3 (i.e., 976.560–933.224 Å3), 51.130 (i.e., 984.354–933.224 Å3) and 55.651 Å3 (i.e., 988.875–933.224 Å3), respectively. In this case, the evolution of bulk volume was mainly dominated by phase transition rather than substitution due to impurity ions.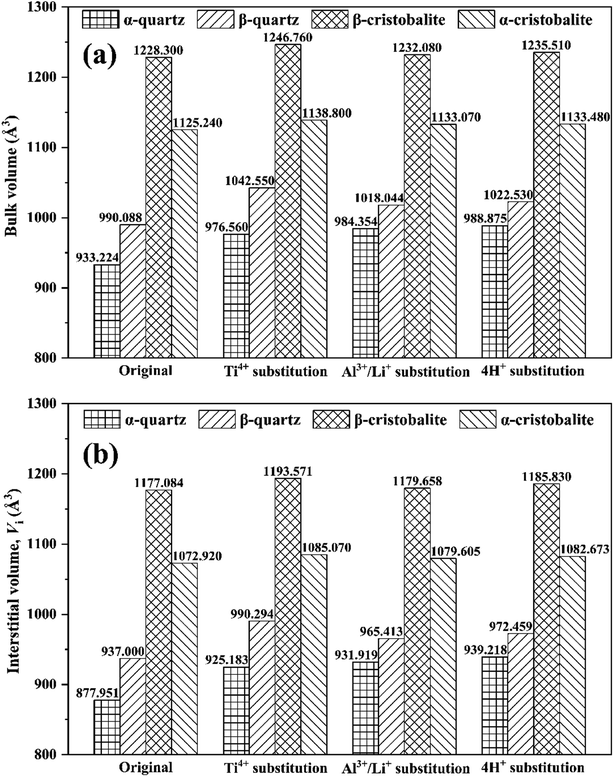 | ||
| Fig. 4 (a) Bulk volume and (b) interstitial volume of original and substituted SiO2 phases during phase transition process. | ||
The interstitial volume was closely related to the migration of interstitial impurity such as Li+, Na+, K+, etc.16 Thus the evolution of interstitial volume was calculated (Fig. 4(b)). Similar to the evolution of bulk volume, the interstitial volume changes caused by phase transition were more significant than that by impurity ion substitution, e.g., the interstitial volume changes caused by phase transition were 59.049 Å3 (i.e., 937.000–877.951 Å3), 299.133 Å3 (i.e., 1177.084–877.951 Å3) and 194.969 Å3 (i.e., 1072.920–877.951 Å3) from α-quartz to β-quartz, α-cristobalite and β-cristobalite, respectively, while caused by Ti4+, Al3+/Li+ and 4H+ substitution for α-quartz were 47.232 Å3 (i.e., 925.183–877.951 Å3), 53.968 Å3 (i.e., 931.919–877.951 Å3) and 61.267 Å3 (i.e., 939.218–877.951 Å3), respectively (Fig. 3(b)). These indicated that the evolution of interstitial volume was mainly dominated by phase transition rather than substitution due to impurity ions.
In addition, the interstitial volume changes caused by the phase transition was greater than that of bulk volume, possibly due to bigger bulk volume and shorter average bond lengths for the high temperature SiO2 phases. Moreover, the interstitial volume change from β-quartz to α-cristobalite was significant greater than that from α-quartz to β-quartz, i.e., 240.084 Å3 (i.e., 1177.084–937.000 Å3) vs. 59.049 Å3, indicating that the migration of interstitial impurities was proportional to temperature.16
3.4 Evolution of lattice parameter
Since the evolution of bulk volume was mainly dominated by phase transition, the changes of lattice parameters (Δai, Δbi and Δci) were employed to evaluate the contribution of lattice parameters to the changes of bulk volume (ΔV). As shown in Fig. 5(a) the Δai increased with the increase of ΔV for original SiO2 phases, while Δbi and Δci decreased with the increased ΔV, indicating that Δai positively contributed to the increase of bulk volume. In contrast, Δbi and Δci exhibited negative contributes. The values of Δai/ΔV, Δbi/ΔV and Δci/ΔV of 0.0370, −0.0052 and −0.0138 indicated that the bulk volume of original SiO2 phases were increased via a axis, but decreased mainly via c axis during the phase transition process.26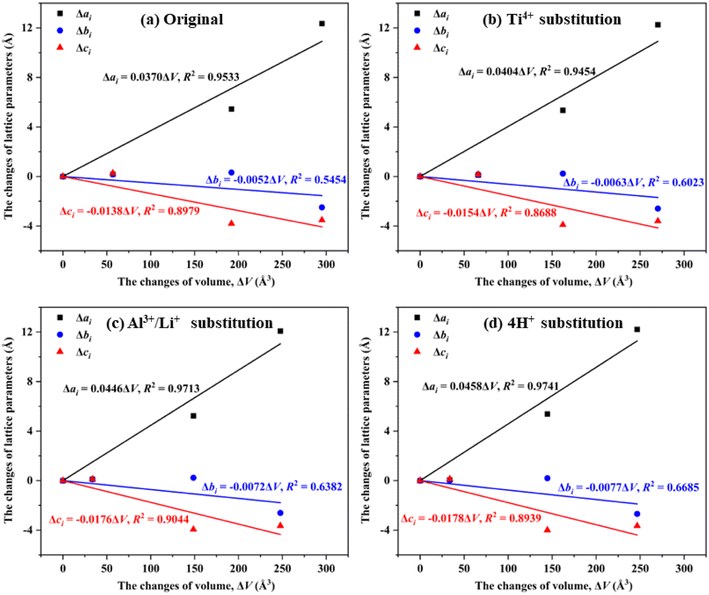 | ||
| Fig. 5 The contribution of Δai, Δbi and Δci to ΔV in (a) original, (b) Ti4+ substituted, (c) Al3+/Li+ substituted and (d) 4H+ substituted SiO2 phases. | ||
Similar contribution rules were observed for Ti4+, Al3+/Li+ and 4H+ substitution, i.e., the bulk volume of substituted SiO2 phases increased via a axis, but decreased mainly via c axis during the phase transition process. In this case, the substitution of impurity ion did not change the contribution rule between lattice parameters to bulk volume, but changing the specific Δai/ΔV, Δbi/ΔV and Δci/ΔV values. For instance, the Δai/ΔV values in Ti4+, Al3+/Li+ and 4H+ substituted SiO2 phases (i.e., 0.0404, 0.0446 and 0.0458, respectively) were greater than that of original SiO2 phases (i.e., 0.0370), giving a Δai/ΔV value order in 4H+ > Al3+/Li+ > Ti4+ > original SiO2 phases. Same orders were observed for the absolute values of Δbi/ΔV and Δci/ΔV, indicating that the contribution of lattice parameters to bulk volumes was related to the number of substitution atoms.
3.5 Evolution of lattice stress
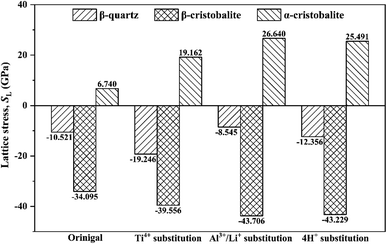
Normally, the change of bulk volume needs to overcome the lattice stress, thus lattice stress of original and substituted SiO2 phases were calculated based on eqn (1). Overall, the lattice stresses were negative for original and substituted β-quartz and β-cristobalite (Fig. 6), but positive for α-cristobalite, e.g., the lattice stresses were −10.521 GPa, −34.095 GPa and 6.740 GPa for original β-quartz, β-cristobalite and α-cristobalite, indicating that the phase transition from α-quartz to β-quartz and from β-quartz to α-cristobalite occurred spontaneously. However, the evolution from α-cristobalite to β-cristobalite needs to overcome lattice stress.Furthermore, the substitution of impurity ion did not change the lattice stress of SiO2 phases during the phase transition process, but changing the specific lattice stress values. For instance, the lattice stresses for original, Ti4+, Al3+/Li+ and 4H+ substituted β-quartz were −10.521 GPa, −19.246 GPa, −8.454 GPa and −12.356 GPa, respectively, indicating that the substitution of Ti4+ and 4H+ drived the phase transition from α-quartz to β-quartz easily. However, the substitution of Al3+/Li+ occurred difficultly. Differently, the substitution of Ti4+, Al3+/Li+ and 4H+ promoted the phase transition from β-quartz to α-cristobalite easily. In contrast, the phase transition from α-cristobalite to β-cristobalite need to overcome greater lattice stress due to the substitution of Ti4+, Al3+/Li+ and 4H+.
3.6 Evolution of energy
In order to better reveal the energy evolution during the phase transition process, the energy barriers were calculated (Fig. 7(a) and Tables S1–S5†). It was clearly that the energy barriers for β-quartz and β-cristobalite were positive, but negative for α-cristobalite in all SiO2 phases, e.g. the energy barriers were 0.489, 0.333 and −1.973 eV for original β-quartz, β-cristobalite and α-cristobalite, respectively, indicating that the phase transitions from α-quartz to β-quartz and from β-quartz to α-cristobalite need to overcome energy barriers. In contrast, the phase transition from α-cristobalite to β-cristobalite occurred spontaneously from thermodynamic point of view. In other words, the phase transition from α-quartz to β-quartz and further to α-cristobalite were endothermic process but the phase transition from α-cristobalite to β-cristobalite was exothermic process, consistent with the phase transition temperature results shown in Fig. 1.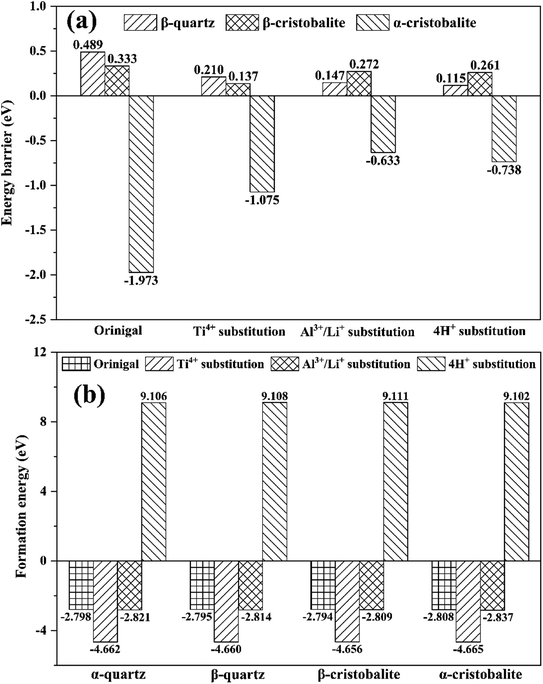 | ||
| Fig. 7 (a) Energy barrier and (b) formation energy of original and substituted SiO2 phases during phase transition. | ||
In addition, the substitution of lattice impurity significantly reduced the energy barriers for the phase transition from α-quartz to β-quartz and further to α-cristobalite, e.g., the energy barriers for original, Ti4+, Al3+/Li+ and 4H+ substituted SiO2 phases were 0.489, 0.210, 0.147 and 0.115 eV, respectively, indicating that the present of lattice impurities promoted phase transition from thermodynamic point of view.
The formation energy of original and substituted SiO2 phases were calculated to evaluate the stability of lattice impurity substituted structure (Fig. 7(b)). The original, Ti4+ and Al3+/Li+ substituted SiO2 phases exhibited negative formation energies, e.g., −2.798, −4.662 and −2.821 eV for α-quartz phases, respectively. However, 4H+ substituted SiO2 phases exhibited positive formation energies, e.g., 9.106 eV for α-quartz, indicating that the original, Ti4+ and Al3+/Li+ substituted SiO2 phases can exist stably, while the 4H+ substituted SiO2 phases were structurally unstable. In addition, the formation energies were in an order of Ti4+ substitution < Al3+/Li+ substitution < original < 4H+ substitution. In this case, the lattice impurities Ti and Al were hardly to be removed due to their lower formation energies than that of original SiO2 phases.18
4 Conclusions
This study investigated the plastic deformation mechanisms for the phase transition between α-quartz, β-quartz, β-cristobalite and α-cristobalite based on the evolution of supercell structures, bond lengths, volumes, lattice parameters, lattice stresses and energies in original, Ti4+, Al3+/Li+ and 4H+ substituted SiO2 phases. Overall, the evolution of bond lengths and volumes were mainly dominated by phase transition rather than substitution due to impurity ions. The average Si–O bond lengths in high temperature SiO2 phases were shorter than that in low temperature for original and substituted SiO2 phases. In contrast, the bulk volume in high temperature SiO2 phases were higher than that in low temperature. Thus, the interstitial volume changes caused by the phase transition was greater than that of the bulk volume, beneficial to the migration of interstitial impurities. In addition, the bulk volume of original and substituted SiO2 phases increased via a axis, but decreased mainly via c axis during the phase transition process. In addition, the contribution of lattice parameters to bulk volumes was related to the number of substitution atoms. Moreover, the phase transition from α-quartz to β-quartz and further to α-cristobalite need to overcome energy barriers, while the evolution from α-cristobalite to β-cristobalite needs to overcome a lattice stress.Author contributions
Methodology, Zhenlun wei, Wanqing Li, Xianglin Hu, software, Zhenlun Wei, Xianglin Hu, Yunxiang Gu, writing—original draft preparation, Zhenlun Wei, Peiyue Li, Li Pan, writing—review and editing, Yubiao Li, supervision, Yubiao Li.Conflicts of interest
There are no conflicts of interest to declare.Acknowledgements
The authors would like to acknowledge the financial support from the Key Research and Development Program of Hubei Province (2021BCA127).References
- G. K. Warden, M. Juel, B. A. Gaweł and M. Di Sabatino, Open Ceram., 2023, 13, 100321 CrossRef CAS.
- M. D. Sabatino, F. W. Thorsen, A. Lanterne, Y. Hu, J. A. Bones and E. Øvrelid, Energy Technol., 2017, 387–394 Search PubMed.
- M. Xia, C. Sun, X. Yang and J. Chen, Minerals, 2023, 13, 261 CrossRef CAS.
- J. Götze, Quartz:Deposits, Mineralogy and Analytics, 2012 Search PubMed.
- J. A. Weil, Phys. Chem. Miner., 1984, 10, 149–165 CrossRef CAS.
- B. Perny, P. Eberhardt, K. Ramseyer, J. Mullis and R. Pankrath, Am. Mineral., 1992, 77, 534–544 CAS.
- R. Stalder, A. Potrafke, K. Billström, H. Skogby, G. Meinhold, C. Gögele and T. Berberich, Am. Mineral., 2017, 102, 1832–1842 CrossRef.
- A. Potrafke, R. Stalder, B. C. Schmidt and T. Ludwig, Contrib. Mineral. Petrol., 2019, 174, 98 CrossRef PubMed.
- A. N. Müller, J. E. Wanvik and P. M. Ihlen, Springer Geology, 2012, pp. 71–118 Search PubMed.
- M. Lin, Z. Pei, Y. Li, Y. Liu, Z. Wei and S. Lei, Miner. Eng., 2018, 125, 42–49 CrossRef CAS.
- A. Müller and M. Koch-Müller, Mineral. Mag., 2009, 73, 569–583 CrossRef.
- M. Shen, M. Huang, Z. Lu and X. He, RSC Adv., 2023, 13, 25571–25577 RSC.
- B. A. Gaweł, A. Ulvensøen, K. Łukaszuk, B. Arstad, A. M. F. Muggerud and A. Erbe, RSC Adv., 2020, 10, 29018–29030 RSC.
- J. S. Li, X. X. Li, Q. Shen, Z. Z. Zhang and F. H. Du, Environ. Sci. Technol., 2010, 44, 7673–7677 CrossRef CAS.
- K. B. Loritsch and R. D. James, US Pat., US4983370A, 1990 Search PubMed.
- Z. Wei, Y. Li, P. Li, L. Pan, X. Hu, Y. Gu and Y. Tian, Minerals, 2023, 13, 1280 CrossRef CAS.
- X. Wu, MSc thesis, Southwest University of Science and Technology, 2016.
- J. Götze, Y. Pan and A. Müller, Mineral. Mag., 2021, 85, 639–664 CrossRef.
- B. Lawn, D. Marshall, R. Raj, G. Hirth, T. Page and J. Yeomans, J. Am. Ceram. Soc., 2021, 104, 23–26 CrossRef CAS.
- R. A. Young, P. E. Mackie and R. B. Von Dreele, J. Appl. Crystallogr., 1977, 10, 262–269 CrossRef.
- A. F. Wright and M. S. Lehmann, J. Solid State Chem., 1981, 36, 371–380 CrossRef CAS.
- T. Barth, Am. J. Sci., 1932, 23, 350–356 CrossRef CAS.
- W. DOLLASE, Z. Kristallog., 1965, 121, 369–377 CrossRef CAS.
- H.-J. Blankenburg, Quarzrohstoffe, 1978 Search PubMed.
- J. P. Perdew and Y. Wang, Phys. Rev. B: Condens. Matter Mater. Phys., 1992, 45, 13244 CrossRef.
- G. Zhu, Z. Wei, X. Wu and Y. Li, Sci. Total Environ., 2023, 904, 166273 CrossRef CAS.
- M. Hong, J. Xu and H. H. Teng, Geochim. Cosmochim. Acta, 2016, 172, 55–64 CrossRef CAS.
- P. Elstnerová, M. Friák, H. O. Fabritius, L. Lymperakis, T. Hickel, M. Petrov, S. Nikolov, D. Raabe, A. Ziegler, S. Hild and J. Neugebauer, Acta Biomater., 2010, 6, 4506–4512 CrossRef.
- M. L. Keith and O. F. Tuttle, Am. J. Sci., 1952, 250, 203–280 Search PubMed.
- W. H. Baur, Z. Kristallog., 2010, 224, 580–592 CrossRef.
- R. D. Shannon, Acta Crystallogr., Sect. A, 1976, 32, 751–767 CrossRef.
Footnote |
| † Electronic supplementary information (ESI) available. See DOI: https://doi.org/10.1039/d3ra07633d |
| This journal is © The Royal Society of Chemistry 2024 |

