 Open Access Article
Tuning phosphorene and MoS2 2D materials for detecting volatile organic compounds associated with respiratory diseases
Alaa Allosh†
ab,
Calin-Andrei Pantis-Simut†abc,
Nicolae Filipoiuab,
Amanda Teodora Predaabc,
George Neculaa,
Ioan Ghitiubd,
Dragos-Victor Anghelabc,
Mihnea Alexandru Duleaa and
George Alexandru Nemnes *abc
*abc
aHoria Hulubei National Institute for Physics and Nuclear Engineering, Magurele-Ilfov 077126, Romania
bUniversity of Bucharest, Faculty of Physics, Magurele-Ilfov 077125, Romania. E-mail: nemnes@solid.fizica.unibuc.ro
cResearch Institute of the University of Bucharest (ICUB), 90 Panduri Street, Bucharest 050663, Romania
dNational Institute for Laser, Plasma and Radiation Physics, Magurele-Ilfov 077125, Romania
First published on 8th January 2024
Abstract
Efficient identification of volatile organic compounds (VOCs) is essential for the rapid diagnostication of respiratory diseases. By detecting specific biomarkers associated with different pathologies one may distinguish between tuberculosis, nosocomial pneumonia, Aspergillus fumigatus, influenza and SARS-CoV-2 virus infections. Phosphorene and MoS2 are potential candidates from the class of 2D graphene-like materials, which can be used as active layers for sensing elements. However, as the target molecules poorly adhere to the pristine layers, binding centers are created by introducing substitutional impurities. The adsorbed VOCs induce modifications in the electrical properties of the customized active layers. For each biomarker and a sequence of substitutional impurities, a pattern of conductivities is obtained, which enables the detection of an unknown test specimen. Exploring multiple biosensor configurations we find an optimal design yielding a considerable selectivity for the five biomarker compounds.
1 Introduction
Rapid diagnostication of respiratory diseases is of major interest for reducing both time and resources for clinical investigations. It relies on identifying specific biomarkers as volatile organic compounds (VOCs) from the exhaled air,1 which have been identified for specific diseases and are preferred due to their non-invasive character. VOCs analysis has been used in the diagnostication of pneumonia,2 lung cancer,3 interstitial lung diseases,4 microbial infections5 and other pathologies via systemic circulation.6The standard methods for identifying VOCs include techniques based on mass spectroscopy, like the high-sensitivity, high-selectivity gas chromatography-mass spectrometry (GC-MS),7–9 selected ion flow tube technique mass spectrometry (SIFT-MS)10 and proton-transfer-reaction mass spectrometry (PTR-MS),11 as well as laser spectroscopical methods,12 which are rather complex and costly techniques. Besides these physical detection methods, the chemical routes are gaining attention along with the development of new nanomaterials suitable for biomolecule sensing. These methods are summarized in a recent review.13
Recent studies indicate the possibility to identify organic molecules absorbed on graphene or graphene-like materials, based on the modifications induced in the electronic properties of the active layers, which can be evidenced in the conduction properties, capacitive effects and optical absorption.14–17 Pristine graphene is known for its remarkable conductive properties, which can be only slightly influenced by adsorbed molecules. In contrast, finite-gap graphene-like materials like phosphorene (BP) and MoS2 offer better prospects. However, just like graphene, these van der Waals materials have a binding deficit due to the relatively weak interaction between the monolayers and the targeted molecules. In this case, the typical strategy is to induce binding centers by introducing point-defects like vacancies or substitutions. Several theoretical studies were focused on modifying graphene (GR), for instance, using transition metal substitutions for sensing glucose14 or graphene oxide for VOC detection.16 Electrochemical sensors and biosensors using various forms of graphene have been developed, such as noncovalently or covalently functionalized GR composites, structurally engineered GR, vertical and porous GR, hydrogels, aerogels and etched GR.18 Also, other carbon-based structures like the B4C3 monolayer were employed in the detection of various VOCs such as methanol (CH3OH), formaldehyde (H2CO), toluene (C7H8) and acetone (C3H6O).19
Besides graphene, several families of graphene-like materials are in the focus as active layers in nanoelectronic devices, owing to their finite and tunable band gaps. In particular, BP and MoS2 have intermediate band gaps of ∼0.3–1.5 eV20 and 0.9–1.6 eV,21 respectively. This variation is attributed to the differences in the number of layers, where the largest band gap corresponds to the monolayer form of each material. In contrast, the hexagonal boron nitride (hBN) with a wide band gap of ∼5.9 eV can be used as an insulating support layer.22
An early study employing first-principles calculations has indicated the potential of phosphorene for selective adsorption and distinct I–V response for detecting CO, CO2, NH3, NO, and NO2 gas molecules.23 Soon after, the realization of phosphorene-based gas sensors was experimentally proved for NO2 detection.24 Afterwards, various modifications of phosphorene and other phosphorene allotropes were investigated for sensing specific organic molecules. Pt-decorated phosphorene was shown to provide a propitious room temperature VOC gas sensor response for the targeted molecules, such as acetone, ethanol, formaldehyde, methanol, toluene, CO2, and H2O.25 Ultrahigh-sensitive gas sensors were proven for NO, NO2, NH3, and CO molecules, based on Si- and S- doped phosphorene.26 Also, novel green phosphorene was investigated as a potential chemical gas sensing material for inorganic gas molecules and water, under doping with extrinsic impurities27 and as a promising biosensor for detection of furan and p-xylene biomarkers.28 In addition, theoretical studies indicated that phosphorene and phosphorene oxides are suitable for toxic gas detection.29 Several other applications of bulk black phosphorus, few-layer black phosphorus, and phosphorene are detailed in a recent review.30
The transition metal dichalcogenites (TMDs) is yet another class of 2D materials that has proven its effectiveness in molecule sensing: defect-engineered VSe2 for ammonia sensing,31 SnS monolayers for the detection of VOCs like ethylene, ethane and benzene,15 Al-doped MoSe2 monolayer as a promising biosensor for exhaled breath analysis, specific to lung cancer compounds, like isoprene, acetone and 2-propenal.17
In this paper we investigate the possibility of tuning the active layers based on two graphene-like materials, namely BP and MoS2, in order to differentiate between biomarkers specific to five respiratory diseases: influenza, SARS-CoV-2 virus, nosocomial pneumonia, tuberculosis and Aspergillus fumigatus. We choose a set of five biomarkers, namely thiirane associated with influenza A, subtypes H1N1 (human), H6N2 (avian) and H9N2 (avian);32 acetone associated with Streptococcus pyogenes and influenza A infections,33 but also identified in breath samples from SARS-CoV-2 patients;34 N-methyl-2-methylpropylamine associated with Pseudomonas aeruginosa nosocomial infections;35 cyclohexanone identified in breath samples of patients infected with Mycobacterium tuberculosis,36 and 2-Pentylfuran identified in breath samples from SARS-CoV-2 patients37 and breath samples of patients with Aspergillus fumigatus.38 Two types of device structures are considered, which comprise BP and MOS2 monolayers on top of insulating hBN support. Binding centers are created by doping the active layers with group-IV, group-VI and transition metals (TMs). Using high throughput calculations we determine the electronic structure modifications induced by the presence of the biomarkers. For each biomolecule and doping sequence a specific pattern emerges for the electrical conductivity. We propose a scheme for enhanced detection based on identifying patterns rather than single values and show that the biomarkers can still be discerned in spite of some statistical changes in the molecule configurations induced by thermal noise.
2 Device models and methods
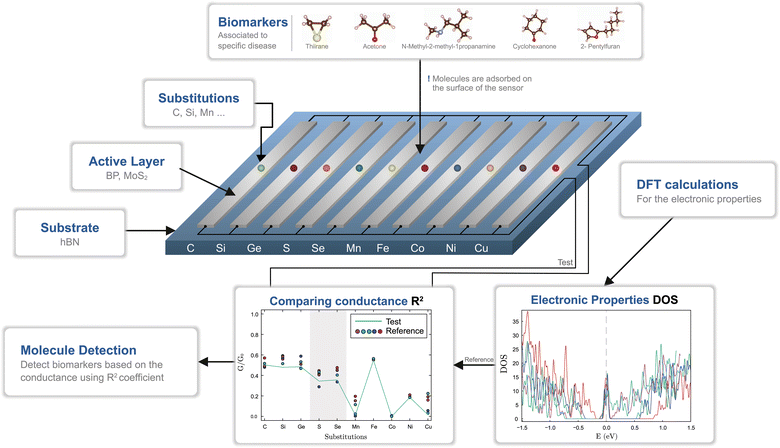
Modified 2D graphene-like materials have been widely used as biosensing elements and the intermediate gap BP and MoS2 semiconductors have a good potential to be used as active layers. However, the pristine monolayers are less chemically reactive, which results in a poor binding capacity of the biomolecules. Therefore, inducing point defects by creating vacancies or by substitutions with foreign elements is typically employed. We take the latter approach and investigate three groups of substitutions, corresponding to group-IV (C, Si, Ge), group-VI (S, Se) and TMs (Mn, Fe, Co, Ni, Cu). The substitutions are expected to provide binding centers to biomarkers, though the binding strength needs to be determined.We pursue the identification of five VOCs, associated with respiratory diseases: thiirane (influenza), acetone (SARS-CoV-2, influenza), N-methyl-2-methyl-1-propanamine (nosocomial pneumonia), cyclohexanone (tuberculosis) and 2-pentylfuran (Aspergillus fumigatus, SARS-CoV-2). The process of biomarker detection is summarized in Fig. 1. For each of the two materials, BP and MoS2, a number of ten customized layers are considered, corresponding to a substitution type. Each group of substitutions has a different chemical behavior, which enhances the overall selectivity of the biosensor. The changes in the density of states (DOS) induce modifications of the electrical conductances, which are grouped into patterns that should be matched with the test case. To this end, we employ ab initio calculations, from which we obtain the electrical behavior and, subsequently, the test patterns are matched against the reference ones.
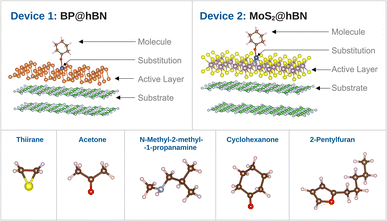
The individual sensor elements consist of rather extended segments of the active layers (BP and MoS2) on top of hBN substrate as depicted in Fig. 2. It has been established that the mere presence of an hBN supporting layer reduces the band gap of phosphorene39,40 and a similar effect takes place in the MoS2@hBN system, previously found due to the interaction with several dielectric environments.41,42 This has to be taken into account, as the reduction of the band gap enhances the conductivity of the active layers, which is further influenced by the different doping elements.
The electronic properties of BP@hBN and MoS2@hBN with substitutional point defects are investigated by density functional theory (DFT) calculations. The supercells are constructed such that mismatch between the active- and the supporting layers is minimized, retaining the 2D periodicity of both layers. Specifically, for BP@hBN system, the resulting supercell was formed using 3 × 5 BP unit cells and 4 × 5 unit cells for hBN. Post-adjustments led to mismatches of 1.6% and 4.2% in the ![[a with combining right harpoon above (vector)]](https://www.rsc.org/images/entities/i_char_0061_20d1.gif) and
and ![[b with combining right harpoon above (vector)]](https://www.rsc.org/images/entities/i_char_0062_20d1.gif) directions, respectively. The subsequent heterostructure portrayed tightly knit interlayer interactions, with interlayer spacings of ∼2.5 Å between the phosphorene and the hBN substrate. Multi-layered hBN exhibit an interlayer distance of ∼3.85 Å under AA′ type stacking, corresponding to a 60° interlayer rotation. For MoS2@hBN system, the supercell was constructed from 4 × 5 MoS2 unit cells and 3 × 4 hBN unit cells. Minimal mismatches were obtained with a near-perfect alignment in the
directions, respectively. The subsequent heterostructure portrayed tightly knit interlayer interactions, with interlayer spacings of ∼2.5 Å between the phosphorene and the hBN substrate. Multi-layered hBN exhibit an interlayer distance of ∼3.85 Å under AA′ type stacking, corresponding to a 60° interlayer rotation. For MoS2@hBN system, the supercell was constructed from 4 × 5 MoS2 unit cells and 3 × 4 hBN unit cells. Minimal mismatches were obtained with a near-perfect alignment in the ![[b with combining right harpoon above (vector)]](https://www.rsc.org/images/entities/i_char_0062_20d1.gif) direction, with a difference of 0.12% and a slightly larger one, ∼4.6%, in the
direction, with a difference of 0.12% and a slightly larger one, ∼4.6%, in the ![[a with combining right harpoon above (vector)]](https://www.rsc.org/images/entities/i_char_0061_20d1.gif) direction.
direction.
The ab initio DFT calculations were performed using the SIESTA package,43 which employs strictly localized basis sets to achieve a linear scaling of the computational time with the system size. For the exchange-correlation functional, the generalized gradient approximation (GGA) was used adopting the parametrization proposed by Perdew–Burke–Ernzerhof (PBE)44 with VDW Grimme-D2 correction.45 Troullier–Martins norm-conserving pseudopotentials46 were employed, the real space grid was set by a mesh cutoff parameter of 150 Ry and a strict 10−4 convergence criterium was used for the density matrix convergence. For the sampling of the Brillouin zone the Monkhorst–Pack scheme with a 5 × 5 × 1 grid was employed. All structures underwent relaxation until the residual forces were less than 0.04 eV Å−1. The structural optimization was performed in several steps. First, the systems composed by the pristine active layers on top of the substrate were relaxed. Next, the substitutional impurities were introduced and the systems were relaxed again. In another step, the optimized biomarkers were attached to the customized active layers and the entire systems were relaxed to their final equilibrium configurations. For the visual representations of the devices and post-processing of the band structures we used VESTA and the SISL package.
The binding energies are calculated in order to check the effectiveness of the created binding centers. Using the total energies calculated for the device elements (Edev), biomolecules (Emol) and the systems with attached biomarkers (Edev+mol) one defines the binding energy, Eb as:
| Eb = Edev + Emol − Edev+mol. | (1) |
The conduction properties are calculated in the framework of Boltzmann transport equation (BTE), within the constant relaxation time approximation, τ(ε) ≈ τ0. The electrical conductivity, σ, is determined based on the generalized transport coefficient,  :47
:47
 | (2) |
 | (3) |
![[small sigma, Greek, tilde]](https://www.rsc.org/images/entities/i_char_e10d.gif) (ε) is given by:
(ε) is given by:
![[small sigma, Greek, tilde]](https://www.rsc.org/images/entities/i_char_e10d.gif) (ε) = 〈vg2(ε)〉τ(ε)D(ε). (ε) = 〈vg2(ε)〉τ(ε)D(ε).
| (4) |
We denote by D(ε) the density of states and 〈vg2(ε)〉 is the average group velocity.
The conductance patterns that emerge for known specimens form the reference data sets, {Grefαs}, where α and s label the biomarker and the substitution type, respectively. After these are determined, in the diagnosis process, one has to compare the data set of an unknown specimen, {Gtests}, with the reference data of each potential candidate. To this end, we employ the R2 coefficient of determination:
 | (5) |
 and
and  represent the residual and total sum of squares, respectively. The averaged conductance is calculated as
  , where Ns = 10 substitutions. The highest value in the {Rα2} set determines the most likely biomarker.
Furthermore, the sensor selectivity is connected with the charge transfer that occurs between the active layer and the attached molecule, which is defined as:
Δρ(![[r with combining right harpoon above (vector)]](https://www.rsc.org/images/entities/i_char_0072_20d1.gif) ) = ρdev+mol( ) = ρdev+mol(![[r with combining right harpoon above (vector)]](https://www.rsc.org/images/entities/i_char_0072_20d1.gif) ) − ρdev( ) − ρdev(![[r with combining right harpoon above (vector)]](https://www.rsc.org/images/entities/i_char_0072_20d1.gif) ) − ρmol( ) − ρmol(![[r with combining right harpoon above (vector)]](https://www.rsc.org/images/entities/i_char_0072_20d1.gif) ), ),
| (6) |
3 Results
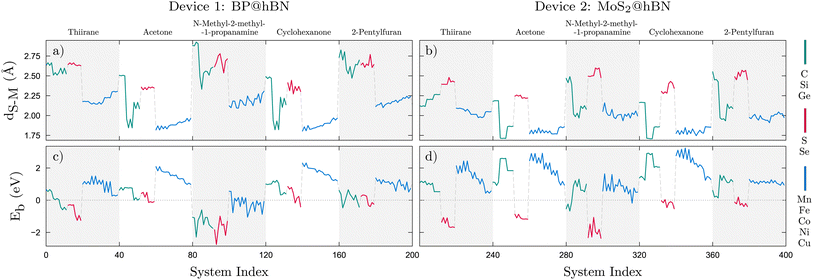
In a first step we analyze the bonding lengths which are determined following the relaxation of the whole structure of the device, with the molecules attached. The bond lengths were measured as distances between the substitutional atom in the active layer and the molecule's binding atom. These belong to the functional groups, e.g. sulfide, carbonyl or amine, which are likely to bind to the substitutional atom in the active layer. Four different configurations for each molecule atop of each active layer were considered. This procedure resulted in 40 calculations per molecule, i.e. for 4 configurations ×10 substitutional atoms, totaling 200 cases for each device. For both devices, we observe that each molecule, in interaction with the active layer, exhibits a unique series of bonding lengths, which are in close correlation with the binding energies as shown in Fig. 3. This observation holds across all examined molecules. Typically, a small bonding length is associated with a larger binding energy. One can observe that, for both devices, Eb is larger for the lighter TM substitutions considered, compared to group-IV and group-VI elements. In the case of BP@hBN systems, the TM substitutions tend to create local deformations of the BP layer and a charge imbalance, while the d type orbitals hybridize with the molecular orbitals of the target molecule. On the other hand, group-IV and group-VI elements render a weaker binding.Starting with the BP@hBN device, as one can see from the DOS maps in Fig. 4a, using group-IV and group-VI substitutions on phosphorous has a contrasting effect, inducing p- and n-type doping, respectively. The Fermi level is pinned by the groups of in-gap states created by the substitutional impurities, which are further influenced by the attached biomarkers. A pattern emerges for group-IV elements, where carbon induce a relatively shallow p-type doping, in contrast to Si and Ge substitutions, where deep energy levels are evidenced. In the case of group-VI elements, the in-gap states tend to merge with the conduction band of the BP, conferring the systems a degenerate n-type character. The DOS and, in particular, the in-gap states distribution are highly sensitive to adsorption of molecules on the semiconductor surface, which leads to a measurable change in the electrical properties. As it will be shown in the following this is also accompanied by a charge transfer from the active layer to the biomolecule. On the other hand, for MoS2@hBN device, substituting elements from group-IV and group-VI produces a rather small impact on the DOS, as the energy levels are mostly localized at the band edges, as it can be seen in Fig. 4b. However, a shift in the Fermi level can be observed, depending also on the nature of the attached biomolecule.
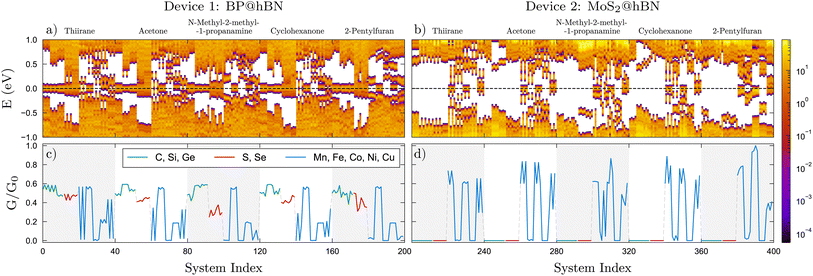 | ||
| Fig. 4 (a and b) Density of states (DOS) in logarithmic scale and (c and d) scaled conductivities, G/G0 for the systems indicated in Fig. 3. The same color codes apply. The conductances are normalized to the highest value, G0, obtained from the data sets of the two devices. | ||
The TM substitutions in the BP@hBN system produce a larger spread of the energy levels in the band gap of the base semiconductor, effectively reducing it. Except for Co substitutions, which show a rather intrinsic behavior, the TMs induce a p-type character, with rather shallow acceptor energy levels, but broad distribution. In the MoS2@hBN system, the same TM substitutions create deep energy levels and their pattern is visibly influenced by the molecules, in contrast to the group-IV or group-VI substitutions, which have little impact.
The modifications in the electrical conductance, which manifest uniquely for each interacting molecule within the examined device, are depicted in Fig. 4c and d. Overall, one can see a systematic behavior, which stems mostly from the active layers, customized with the binding centers, but still with significant influence from the attached molecules. For the BP@hBN device, a sizable conductance is prevalent across most scenarios concerning the different substitutions. In contrast, the MoS2@hBN device displays a very low conductivity response in the molecular sensing for group-IV and group-VI substitutions, which is attributed to its wider bandgap and the lack of in-gap states generated by these extrinsic impurities. The TMs enhance the conductivity in both devices, apart from the systems where the Fermi level is found in the minigaps, e.g. Co substitution in the BP@hBN and Fe and Ni substitutions in MoS2@hBN.
The conductivity is strongly correlated with the DOS, where the in-gap states forming mini-bands and pinning the Fermi level induce a significant conduction, in contrast with the systems where mini-gaps develop. Moreover, one can see that comparing biomarkers which have the same functional group, e.g. –OH in case of acetone and cyclohexanone, the conductivity patterns are very similar. This holds for each of the two active layers, BP and MoS2. The unique conductivity patterns have significant practical implications, especially for the selective detection, where their specificity enables the precise identification of various chemical entities. By enhancing the accuracy of sensing one can potentially identify molecules even at minimal concentrations, vital for applications requiring trace-level detection, especially in medical diagnostics.
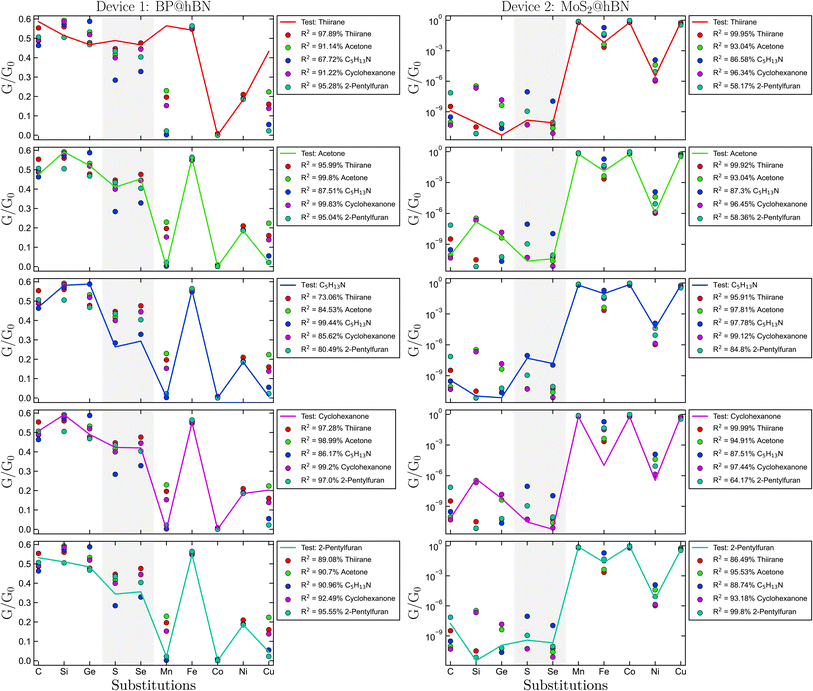
The biomarker identification is based on comparing the conductance pattern of the test specimen with the already established reference data, as shown in Fig. 5. For each molecule, one atomic configuration was selected at random for each impurity type, to form a test sample, while the remaining three were averaged to create a comparative data set. Per device, we considered 1000 test samples for each molecule, obtained by sampling the existing data sets with different atomic configurations and substitution types. This yielded a total of 5000 test cases, which were compared to each of the five reference data sets per molecule. The highest R2 coefficient provides the most likely biomarker in the test sample. A typical numerical experiment is illustrated in Fig. 5, where for the BP@hBN device four out of five molecule candidates have been predicted with more than 90% confidence: thiirane – 97.89%, acetone – 99.81%, N-methyl-2-methyl-1-propanamine – 97.84% and 2-pentylfuran – 92.35%. The inaccurate prediction concerns the sample containing cyclohexanone – 97.9%, which is mistaken for acetone – 98.43%. However, this is a small difference and it can be explained based on the anchoring –OH group present in both cases. For the MoS2@hBN device, only two out the five molecules are correctly predicted, namely thiirane – 99.95% and 2-pentylfuran −98.97%. However, the acetone and cyclohexanone are placed both as second best R2 scores. This graphical analysis supplies a quantitative metric, crucial for validating and enhancing the sensor's operational capability and applicability across various biomarker candidates.
Next, we evaluate the sensor's response across various configurations corresponding to the 10 types of substitutions and molecule orientations. In total, 2Ns − 1 configurations can be considered, starting from one single stripe per device and up to all Ns substitutions. The primary target is to find the optimal configuration with the highest possible prediction rate for each of the five target biomarkers. The evaluation was performed for both devices, using a total of 5000 candidate biomolecules, thus facilitating a comparative representation of the sensor's performance through bar charts. Increasing the prediction threshold simultaneously for all 5 biomarkers, we obtained the optimal configurations for BP and MoS2 based systems, corresponding to C–Si-Ge-Co and C–Se configurations, respectively, as sown in Fig. 6. The analysis revealed high values for N-methyl-2-methyl-1-propanamine and acetone, with accuracies larger than 76%, followed by thiirane and 2-pentylfuran with 61.6% and 63%, respectively, while for the remaining molecule, cyclohexanone, the confidence score is only 50.1%. On the other hand, the MoS2 device yields lower prediction accuracies, with the highest scores obtained for cyclohexanone and N-methyl-2-methyl-1-propanamine. However, the high value of 98% obtained for cyclohexanone shows a complementary response for the BP- and MoS2 based devices. On average, a correct prediction of 70.2% is obtained for the BP-based device and a lower 63.9% for the MoS2-based device. A similar performance is found for other configurations containing C, Si, Ge and Co, Ni for BP@hBN and the same group-IV element together with S, Se and Ni for MoS2@hBN. If the total prediction accuracy is maximized, irrespective of the minimum values obtained for some of the biomarkers, we obtain higher values for BP@hBN: 96% (thiirane), 83.2% (acetone), 99% (N-methyl-2-methyl-1-propanamine), 30.2% (cyclohexanone) and 60.4% (2-pentylfuran). In this case, only four of the five biomarkers can be reasonably predicted and the overall one-out-of-five prediction accuracy is over 73.7% for BP@hBN, while for MoS2@hBN the same configuration with a lower 63.9% accuracy. Again, other configurations with predominantly group-IV substitutions are amongst the best performers. From this we may conclude that the BP@hBN device is a more promising candidate, although MoS2@hBN can achieve good results on a complementary group of target biomolecules.
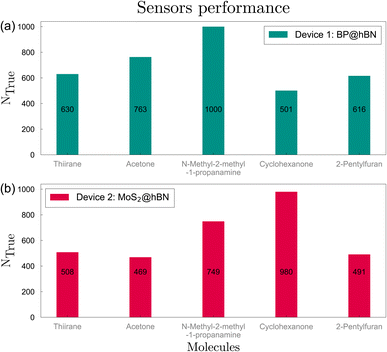 | ||
| Fig. 6 Typical sensor performance with respect to identifying one of the five possible biomarkers, for the two devices, (a) BP@hBN and (b) MoS2@hBN. | ||
These values, indicative of the sensor's differential responsiveness to molecular structures, enable a quantitative assessment of interaction strengths and sensor performance. Higher values denote more pronounced interactions and can be correlated with the charge transfer occurring between the molecules and the active layers, as it is shown in the following. This data is instrumental in elucidating the sensor's discriminative and predictive capabilities, providing a foundation for subsequent device optimization.
In a realistic device, additional exhaled compounds may bring difficulties in the detection process. However, they will create a typical background that can be identified in a healthy individual. The key point of our approach relies on identifying patterns rather than changes for single conductance values and this can be expanded in terms of number of channels and further experimentally calibrated, in order to reach the required resolution. A statistical approach based on a multi-scale modeling can be performed, that would take into account multiple configurations of substrate, active layer, biomolecules and perturbing species described at a local level within DFT, followed by their statistical integration into a semi-classical transport model.
In order to better assess the interaction between the device and various molecules, a thorough examination of charge density differences was undertaken. This analysis provides insights into the charge distribution when the molecule interacts with the device, elucidating the intrinsic electronic characteristics that govern the molecular-device interaction. A differential charge density analysis helps identify regions of charge accumulation and depletion upon the formation of the molecular-device complex, which has direct implications in the detection process. Typical examples of charge transfer are shown in Fig. 7, where the two distinct color codes represent the charge accumulation and the charge depletion. They show for the case of Si substitution a larger charge depletion for thiirane, acetone and N-methyl-2-methyl-1-propanamine in the case of BP@hBN devices and, similarly, for thiirane, N-methyl-2-methyl-1-propanamine and 2-pentylfuran for the MoS2@hBN devices. Such visual mappings provide an intuitive comprehension of the electron redistribution that takes place upon molecule-device interaction, thereby offering insights into potential electronic effects induced by the molecule adhesion to the device.
 | ||
Fig. 7 Distribution of charge density differences as the molecules are attached to active layers. For the two devices, BP@hBN (a–e) and MoS2@hBN (f–j), we represented δρ(![[r with combining right harpoon above (vector)]](https://www.rsc.org/images/entities/i_char_0072_20d1.gif) ) for silicon substitutions, for each five molecules. Larger amount of charge transfer can be correlated with the performance chart shown in Fig. 6. Charge accumulations and charge depletion are represented by violet and blue colors, respectively. ) for silicon substitutions, for each five molecules. Larger amount of charge transfer can be correlated with the performance chart shown in Fig. 6. Charge accumulations and charge depletion are represented by violet and blue colors, respectively. | ||
The integrated charge difference shown in Fig. 8 reflects the charge transfer occurring when the biomarkers attach to the active layers. In order to calculate the transferred charge, we integrate eqn (6) on both molecule and device regions, so that Qdev + Qmol = 0, where  . The device and molecule domains, Ωdev/mol, are formed by dividing the simulation box with a planar surface located at 1 Å away from the linking atom of the molecule with the device. This enables a suitable partitioning of the two domains, ensuring that the resultant charge density difference accurately reflects the electron redistribution occurring due to the intimate molecular interaction with the device. Overall, the charge transfer is in good correlation with the performance of the biosensors as shown in Fig. 6, showing that a large charge transfer generally enhances the biosensor selectivity.
 | ||
| Fig. 8 Charge transfer between the molecule and devices, BP@hBN (a) and MoS2@hBN (b), reflecting the particularities of the substitution–molecule pairs. The red dots indicate the devices with Si substitutions. The systems are indexed as in Fig. 3. | ||
The derived charge density differences and visual plots thereof serve as a critical tool for interpreting the underlying electronic interactions, guiding the optimization of both the molecule and the device for enhanced performance and reliability in practical applications. Additionally, the insights obtained regarding charge behavior and redistribution will potentially facilitate the refinement of our sensor's selectivity and sensitivity, by tailoring the electronic environment at the molecule-device interface.
4 Conclusions
We presented a comprehensive study concerning biomarker detection using phosphorene and MoS2 graphene-like materials as active layers, while the selected biomarkers are specific to five respiratory diseases. Binding centers are created using substitutional impurities, which enhance the attachment of the biomarkers to the active layers and the electronic properties are thus markedly influenced. In our approach, patterns of electric conductances are used to identify the specific biomolecules. Using multiple customizations of the active layers implying different responses to a biomolecule test specimen, rather than using a single architecture, the selectivity of the biosensor is enhanced. The BP@hBN devices can identify with high accuracies three of the five biomolecules, namely thiirane, N-methyl-2-methyl-1-propanamine and acetone, which are associated with influenza, SARS-CoV-2 and nosocomial pneumonia. The second device, MoS2@hBN, has a smaller selectivity, which allows, however the identification of cyclohexanone, which is specific to tuberculosis. Our conductance-pattern matching-approach allows the future design of modular biosensors with flexible configurations, which can be made readily available for large scale and fast diagnostication.Author contributions
A. A., C.-A. P.-S. and N. F. performed the ab initio calculations and contributed to the writing of the theoretical part. A. P., G. N., I. G. contributed to writing, review and editing. I. G., D. V. A and M. A. D. contributed to review and editing. A. A., C.-A. P.-S. and G. A. N. formulated the concepts and methodology and performed the analyses.Conflicts of interest
There are no conflicts to declare.Acknowledgements
This work was supported by the Romanian Ministry of Research and Innovation under the project PN 23210204.Notes and references
- N. M. Mule, D. D. Patil and M. Kaur, Inform. Med. Unlocked, 2021, 26, 100715 CrossRef.
- R. Schnabel, R. Fijten, A. Smolinska, J. Dallinga, M.-L. Boumans, E. Stobberingh, A. Boots, P. Roekaerts, D. Bergmans and F. J. van Schooten, Sci. Rep., 2015, 5, 17179 CrossRef CAS PubMed.
- T. Oguma, T. Nagaoka, M. Kurahashi, N. Kobayashi, S. Yamamori and C. e. a. Tsuji, PLoS One, 2017, 12, e0174802 CrossRef PubMed.
- L. Plantier, A. Smolinska, R. Fijten, M. Flamant, J. Dallinga, J. J. Mercadier, D. Pachen, M. P. d'Ortho, F. J. van Schooten, B. Crestani and A. W. Boots, Respir. Res., 2022, 23, 12 CrossRef CAS PubMed.
- N. Kunze-Szikszay, M. Euler and T. Perl, Appl. Microbiol. Biotechnol., 2021, 105, 6245–6255 CrossRef CAS PubMed.
- W. Ibrahim, L. Carr, R. Cordell, M. J. Wilde, D. Salman, P. S. Monks, P. Thomas, C. E. Brightling, S. Siddiqui and N. J. Greening, Thorax, 2021, 76, 514–521 CrossRef PubMed.
- K. Lamote, P. Brinkman, L. Vandermeersch, M. Vynck, P. J. Sterk, H. Van Langenhove, O. Thas, J. Van Cleemput, K. Nackaerts and J. P. van Meerbeeck, Oncotarget, 2017, 8, 91593–91602 CrossRef PubMed.
- Z.-C. Yuan and B. Hu, J. Anal. Test., 2021, 5, 287–297 CrossRef PubMed.
- F. Monedeiro, M. Monedeiro-Milanowski, I.-A. Ratiu, B. Brożek, T. Ligor and B. Buszewski, Molecules, 2021, 26, 1789 CrossRef CAS PubMed.
- V. Ruzsanyi, P. Mochalski, A. Schmid, H. Wiesenhofer, M. Klieber, H. Hinterhuber and A. Amann, J. Chromatogr. B, 2012, 911, 84–92 CrossRef CAS PubMed.
- R. S. Blake, P. S. Monks and A. M. Ellis, Chem. Rev., 2009, 109, 861–896 CrossRef CAS.
- V. R. Nidheesh, A. K. Mohapatra, R. Nayak, V. K. Unnikrishnan, V. B. Kartha and S. Chidangil, Sens. Actuators, B, 2022, 370, 132367 CrossRef.
- M. Velumani, A. Prasanth, S. Narasimman, A. Chandrasekhar, A. Sampson, S. R. Meher, S. Rajalingam, E. Rufus and Z. C. Alex, Coatings, 2022, 12, 1989 CrossRef CAS.
- K. Devi P and K. Singh, Biosens. Bioelectron.: X, 2023, 13, 100287 CAS.
- J. Wu, Z. Li, A. Luo and X. Xing, Sensors, 2023, 23, 7319 CrossRef CAS PubMed.
- T. Lu, A. Al-Hamry, J. M. Rosolen, Z. Hu, J. Hao, Y. Wang, A. Adiraju, T. Yu, E. Y. Matsubara and O. Kanoun, Chemosensors, 2021, 9, 360 CrossRef CAS.
- T. Liu, Z. Cui, X. Li, H. Cui and Y. Liu, ACS Omega, 2021, 6, 988–995 CrossRef CAS PubMed.
- X. Bo, M. Zhou and L. Guo, Biosens. Bioelectron., 2017, 89, 167–186 CrossRef CAS PubMed.
- U. Nosheen, A. Jalil, S. Z. Ilyas, A. Illahi, S. A. Khan and A. Hassan, J. Electron. Mater., 2022, 51, 6568–6578 CrossRef CAS PubMed.
- V. Tran, R. Soklaski, Y. Liang and L. Yang, Phys. Rev. B, 2014, 89, 235319 CrossRef.
- Q. Tang and D.-e. Jiang, Chem. Mater., 2015, 27, 3743–3748 CrossRef CAS.
- G. Cassabois, P. Valvin and B. Gil, Nat. Photonics, 2016, 10, 262–266 CrossRef CAS.
- L. Kou, T. Frauenheim and C. Chen, J. Phys. Chem. Lett., 2014, 5, 2675–2681 CrossRef CAS PubMed.
- S. Cui, H. Pu, S. A. Wells, Z. Wen, S. Mao, J. Chang, M. C. Hersam and J. Chen, Nat. Commun., 2015, 6, 8632 CrossRef CAS PubMed.
- A. Aasi, S. M. Aghaei and B. Panchapakesan, J. Mater. Chem. C, 2021, 9, 9242–9250 RSC.
- J. Prasongkit, V. Shukla, A. Grigoriev, R. Ahuja and V. Amornkitbamrung, Appl. Surf. Sci., 2019, 497, 143660 CrossRef CAS.
- T. Kaewmaraya, L. Ngamwongwan, P. Moontragoon, W. Jarernboon, D. Singh, R. Ahuja, A. Karton and T. Hussain, J. Hazard. Mater., 2021, 401, 123340 CrossRef CAS PubMed.
- A. Aasi, E. Aasi, S. Mehdi Aghaei and B. Panchapakesan, Sensors, 2022, 22, 3178 CrossRef CAS PubMed.
- E. A. Zuluaga-Hernandez, M. E. Mora-Ramos, J. D. Correa and E. Flórez, J. Phys.: Condens. Matter, 2021, 33, 455501 CrossRef CAS PubMed.
- N. Sultana, A. Degg, S. Upadhyaya, T. Nilges and N. Sen Sarma, Adv. Mater., 2022, 3, 5557–5574 RSC.
- G. Sanyal, S. P. Kaur, C. S. Rout and B. Chakraborty, Biosensors, 2023, 13, 257 CrossRef CAS PubMed.
- A. A. Aksenov, C. E. Sandrock, W. Zhao, S. Sankaran, M. Schivo, R. Harper, C. J. Cardona, Z. Xing and C. E. Davis, ChemBioChem, 2014, 15, 1040–1048 CrossRef CAS.
- S. Traxler, G. Barkowsky, R. Saß, A.-C. Klemenz, N. Patenge, B. Kreikemeyer, J. K. Schubert and W. Miekisch, Sci. Rep., 2019, 9, 18894 CrossRef CAS PubMed.
- D. M. Ruszkiewicz, D. Sanders, R. O'Brien, F. Hempel, M. J. Reed, A. C. Riepe, K. Bailie, E. Brodrick, K. Darnley, R. Ellerkmann, O. Mueller, A. Skarysz, M. Truss, T. Wortelmann, S. Yordanov, C. Thomas, B. Schaaf and M. Eddleston, EClinicalMedicine, 2020, 29, 100609 CrossRef PubMed.
- C. M. H. H. T. Robroeks, J. J. B. N. van Berkel, J. W. Dallinga, Q. Jöbsis, L. J. I. Zimmermann, H. J. E. Hendriks, M. F. M. Wouters, C. P. M. van der Grinten, K. D. G. van de Kant, F.-J. van Schooten and E. Dompeling, Pediatr. Res., 2010, 68, 75–80 CrossRef CAS PubMed.
- A. H. J. Kolk, J. J. B. N. van Berkel, M. M. Claassens, E. Walters, S. Kuijper, J. W. Dallinga and F. J. van Schooten, Int. J. Tuberc. Lung Dis., 2012, 16, 777 CrossRef CAS PubMed.
- A. Z. Berna, E. H. Akaho, R. M. Harris, M. Congdon, E. Korn, S. Neher, M. M’Farrej, J. Burns and A. R. O. John, ACS Infect. Dis., 2021, 7, 2596 CrossRef CAS PubMed.
- S. T. Chambers, M. Syhre, D. R. Murdoch, F. McCartin and M. J. Epton, Med. Mycol., 2009, 47, 468–476 CrossRef CAS PubMed.
- L. Shao, H. Ye, Y. Wu, D. Yinxiao, P. Ding, F. Zeng and Q. Yuan, Mater. Res. Express, 2016, 3, 025013 CrossRef.
- C.-A. Pantis-Simut, A. T. Preda, N. Filipoiu, A. Allosh and G. A. Nemnes, Nanomaterials, 2022, 12, 3650 CrossRef CAS PubMed.
- J. Ryou, Y.-S. Kim, S. KC and K. Cho, Sci. Rep., 2016, 6, 29184 CrossRef CAS PubMed.
- A. Faridi, D. Culcer and R. Asgari, Phys. Rev. B, 2021, 104, 085432 CrossRef CAS.
- J. M. Soler, E. Artacho, J. D. Gale, A. Garcia, J. Junquera, P. Ordejon and D. Sanchez-Portal, J. Phys.: Condens. Matter, 2002, 14, 2745 CrossRef CAS.
- J. P. Perdew, K. Burke and M. Ernzerhof, Phys. Rev. Lett., 1996, 77, 3865–3868 CrossRef CAS PubMed.
- S. Grimme, J. Comput. Chem., 2006, 27, 1787–1799 CrossRef CAS PubMed.
- N. Troullier and J. L. Martins, Phys. Rev. B, 1991, 43, 1993–2006 CrossRef CAS PubMed.
- G. K. Madsen, J. Carrete and M. J. Verstraete, Comput. Phys. Commun., 2018, 231, 140 CrossRef CAS.
Footnote |
| † These authors contributed equally to this work. |
| This journal is © The Royal Society of Chemistry 2024 |

