 Open Access Article
Preparation of carbon quantum dot fluorescent probe from waste fruit peel and its use for the detection of dopamine†
Li Han*a,
Yingkai Guob,
Haohao Zhanga,
Zifan Wanga,
Fan Zhanga,
Yiran Wanga,
Xingqi Lia,
Ying Wang*a and
Jiajia Ye *a
*a
aSchool of Biological and Chemical Engineering, Qilu Institute of Technology, Jinan, 250200, P. R. China. E-mail: hanli0226@163.com; yejj0727@qlit.edu.cn; yingwang20191231@163.com
bJinan Engineering Consulting Institute, Jinan, China
First published on 8th January 2024
Abstract
Carbon quantum dots (CQDs), as a new type of fluorescent nanomaterial, are widely used in the detection of small molecules. Abnormal dopamine secretion can lead to diseases such as Parkinson's disease and schizophrenia. Therefore, it is highly significant to detect dopamine levels in the human body. Using discarded fruit peels to prepare carbon quantum dots can achieve the reuse of kitchen waste, reduce pollution, and create value. Nitrogen-doped carbon quantum dots (N-CQDs) were prepared using the hydrothermal method, with orange peel as the raw material. The fluorescence quantum yield of N-CQDs reached a high value of 35.37% after optimizing the temperature, reaction time, and ethylenediamine dosage. N-CQDs were characterized using various techniques, including ultraviolet visible (UV-vis) spectroscopy, fluorescence spectrophotometer (PL), transmission electron microscopy (TEM), and Fourier transform infrared spectroscopy (FT-IR). These analyses confirmed the successful doping of nitrogen in the CQDs. The DA concentration ranged from 0 to 300 μmol L−1, and the linear equation for fluorescence quenching of N-CQDs was F/F0 = −0.0056c + 0.98647, with an R2 value of 0.99071. The detection limit was 0.168 μmol L−1. The recovery and precision of dopamine in rabbit serum were 98% to 103% and 2% to 6%, respectively. The prepared N-CQDs could be used as a fluorescent probe to effectively detect DA.
Introduction
With the continuous development of modern science and technology, people are facing increasing competitive pressure. Long term exposure to high pressure and regular late nights, along with other unhealthy habits, can easily lead to cardiovascular and cerebrovascular diseases.1 Moreover, these habits can also impact the secretion of the neurotransmitter dopamine (DA). Modern medicine recognizes that DA plays a crucial role in the functioning of the kidneys, cardiovascular system, and other bodily systems. Studies have concluded that excessive secretion of DA can result in schizophrenia, while insufficient secretion can lead to depression. Therefore, abnormal DA levels can significantly impact human nervous system health.2 Accurately detecting DA is essential for diagnosing physiological and neurological diseases.3The methods for detecting DA include electrochemical analysis, chemiluminescence, high-performance liquid chromatography (HPLC), colorimetric analysis, and fluorescence spectrophotometry (PL).4 The advantages and disadvantages of different DA detection techniques are listed in Table S1.†
Zhang et al. synthesized layered double hydroxide (LDH) nanosheet/graphene oxide nanocomposites through electrochemical reduction and evaluated the electrochemical performance of the modified electrodes. This resulted in highly sensitive detection of DA, with a linear range of 0.38–1.06 μM and excellent reproducibility.5 Chen et al. utilized five injectable cardiovascular drugs for their study. These drugs include dobutamine, phentolamine, furosemide, and aminophylline. They utilized HPLC with a linear gradient to simultaneously analyse these drugs. The linear range of detection for dobutamine was found to be 12.0–240.0 μg mL−1. The mixture of dobutamine, phentolamine, furosemide, and aminophylline with 5% dextrose or 0.9% NaCl injection in a polypropylene syringe remained stable at 25 °C for 48 hours. The resulting specimens were both reproducible and quantitatively accurate. However, the experimental apparatus used was complex, and the procedure itself was cumbersome.6 Lettieri, Mariagrazia et al. developed a simple colorimetric assay for the detection of DA in human urine. The assay involved the oxidation of levodopa (LD), DA, and norepinephrine (NE) by soluble melanocortin pigment (MC) and 5,6-indolyl quinone (IQ). The linear range of DA was 5.0 mg L−1 to 50.0 mg L−1, with a relative standard deviation (RSD) of 3.7% and a detection limit of 3.69 mg L−1. This allows for the determination of DA in human urine. The aforementioned methods typically involve complex sample pretreatment procedures and necessitate the use of costly instruments. In contrast, the method described in this paper utilizes fluorescent carbon quantum dots and is characterized by strong selectivity, high fluorescence quantum yield, and low cost.7
CQDs are a new type of carbon nanofunctional material with photoluminescent properties. They have a simple synthesis method and exhibit good optical stability.8 The size of the CQDs is less than 10 nm, and they are primarily composed of sp2 hybridized carbon.8 The surface of CQDs is rich in oxygen-containing functional groups, such as hydroxyl and carboxyl groups, and they exhibit good water solubility. CQDs are commonly used in the fields of biosmall molecule detection and bioimaging.9 The methods for synthesizing CQDs include top-down and bottom-up approaches, such as hydrothermal, microwave, and electrochemical methods.10 Gopi Kalaiyarasan et al. synthesized phosphorus-doped fluorescent carbon quantum dots (P-CQDs) using trisodium citrate and phosphoric acid via a hydrothermal method for the detection of iron. The fluorescence quantum yield was determined to be 16.1%, and the lower limit of detection was determined to be 9.5 nmol L−1. This method has a low limit of detection, but the fluorescence quantum yield is also low.11 Guo et al. used the Passiflora shell as the carbon source and m-phenylenediamine as the nitrogen source.12 They employed a one-step hydrothermal method to synthesize green fluorescent N-CQDs for the detection of uric acid. The fluorescence quantum yield of the N-CQDs produced was as high as 37.6%. The N-CQDs produced by this method exhibited a high fluorescence quantum yield and excellent photostability. However, the limit of detection was high, measuring 0.94 μmol L−1. Moreover, there is little cultivation of Passiflora in our country, and the availability of raw materials is limited.11 Saqib Muhammad et al. developed a sensitive chemiluminescence (CL) method by combining tris(2-carboxyethyl)phosphine (TCEP) with fluorescein. This method allows for the detection of lower concentrations of DA with a linear range of 0.01–0.8 μM and a detection limit of 3.0 nM. However, the use of fluorescein can lead to a decrease in human immunity, and tris(2-carboxyethyl)phosphine is both expensive and slightly water soluble. Phosphine is expensive and has limited solubility in water, which limits its usage.13
However, the low fluorescence quantum yield of CQDs limits their applications. One way to overcome this limitation is by doping CQDs with heteroatoms, which can alter the elemental composition of the surface. The use of heteroatom-containing CQDs for the detection of DA provides an effective method to achieve efficient DA detection.14
In this experiment, the aim was to reduce food waste pollution and effectively utilize discarded fruit peels. Banana peels, orange peels, and dragon fruit peels were used as the carbon source, while ethylenediamine was used as the nitrogen source. CQDs and N-CQDs were prepared using a one-step hydrothermal method. The fluorescence intensities of these materials were compared. Subsequently, the optimal conditions for preparing fluorescent carbon quantum dots, including the dosage of ethylenediamine, reaction temperature, reaction time, and other preparative processes, were determined. The fluorescent carbon quantum dots, prepared from high-quality raw materials, were characterized using an ultraviolet visible (UV-vis) spectrophotometer, fluorescence spectrophotometer (PL), transmission electron microscopy (TEM), and Fourier transform infrared spectroscopy (FT-IR). The detection process of DA was optimized by adjusting the reaction temperature, reaction time, solution pH, and N-CQDs dosage. The specificity of the fluorescent carbon quantum dots was then investigated by selecting the carbon quantum dots that exhibited the most efficient fluorescence and optimal properties. Detection process for DA. Fluorescence burst curves of DA on N-CQDs were plotted. Subsequently, the analysis of DA in the actual samples was performed, demonstrating the environmentally friendly utilization of discarded fruit peels.
Experimental
Chemicals and instruments
Pericarp, commercially available; ethylenediamine (C2H8N2, AR), purchased from Tianjin Fuyu Fine Chemical Co., dopamine (C8H11NO2, AR) was purchased from Shanghai McLean Biochemical Technology Co., rabbit serum was purchased from Nanjing Durai Biotechnology Co.An UV-vis spectrophotometer, model UV-1750, was purchased from Shimadzu Instruments. PL, model F-2700, Fourier transform infrared spectrometer (FT-IR), model NICOLETiS5; purchased from Agilent, USA. A JEOL2100F field emission transmission electron microscope (TEM) was purchased from Nippon Electronics Corporation.
Preparation of fluorescent carbon quantum dots
Weigh 100 g each of commercially available banana peels, orange peels and dragon fruit peels and chop them up. These fragments were then boiled in water that was already boiling for 30 minutes. Afterward, they were dried at a temperature of 110 °C to eliminate any remaining moisture. The dried fragments were subsequently pulverized individually to create raw materials for fluorescent carbon quantum dots. The carbon quantum dot raw materials were dissolved in water and mixed with ethylenediamine solution for the preparation of N-CQDs.The mixed solution was dissolved by magnetic stirring and ultrasonicated for 30 min, transferred to a 100 mL polytetrafluoroethylene reactor, and reacted for a period of time under high temperature conditions. After the reaction, the solution was subjected to centrifugation, reduced pressure filtration, and membrane filtration to obtain a clarified solution, which was then dialyzed for 6 h at room temperature,15 and the deionized water was replaced once every 1 h. The dialyzed solution was stored in a refrigerator at 4 °C for spare use.
Characterization of fluorescent carbon quantum dots
The N-CQDs were prepared at a reaction temperature of 180 °C for a reaction time of 3 hours. The dosage used was 4.0000 g of orange peel and 4.00 mL of ethylenediamine. After dilution, the N-CQDs were characterized using UV-vis, PL, TEM, and FT-IR.Calculation of fluorescence quantum yield
Quinine sulfate was used as a standard sample to calculate the fluorescence quantum yield using the following equation:20where ϕ represents the fluorescence quantum yield. S: fluorescence peak area; A: solution absorbance; n: refractive index of the solvent. The subscript 1 represents the measured distance, and subscript 2 represents the reference standard.
Feasibility and specificity verification
A total of 1300 μL of N-CQDs solution, 1000 μL of NaOH solution with pH 9, and 400 μL of different concentrations of DA solution were fully reacted in a constant-temperature water bath at 40 °C for 30 min, and the fluorescence intensity of the solutions was measured with a PL at a maximum excitation wavelength of 370 nm and a maximum emission wavelength of 445 nm to examine whether the prepared N-CQDs as a fluorescent probe to examine whether the prepared N-CQDs were feasible fluorescent probes for the detection of DA.21To evaluate whether the fluorescent probes prepared according to the principle of DA bursting the fluorescence of N-CQDs were highly selective for the detection of DA, interference tests with common substances and ions were performed, and the interfering factors included urea, K+, Na+, Cu2+, Zn2+, Ag+, DA, Fe3+, and Fe2+, keeping the same experimental conditions as those for the detection of DA, 400 μL of each of the 300 μmol L−1 of the above ion solutions and reacting in a constant-temperature water bath at 40 °C for 30 min to measure the fluorescence intensity.22
Process optimization for dopamine detection
The fluorescence intensity after bursting was denoted as F, while the fluorescence intensity before bursting was denoted as F0. The relative fluorescence intensity values (F/F0) were utilized to examine the impact of various detection processes, including reaction temperature, solution pH, reaction time, and the quantity of N-CQDs, on the detection of dopamine.Results and discussion
Design principles
CQDs absorb photon energy under the excitation of UV light to produce electrons, which jump from the ground state to the excited state, generating hole pairs.23In an alkaline solution, the hydroxyl functional group of dopamine (DA) can undergo oxidation to produce dopamine quinone. Dopamine quinone has the ability to accept electrons from CQDs. When dopamine quinone interacts with CQDs, electron transfer occurs, altering the recombination kinetics of electron and hole pairs in photoexcited CQDs.24 This leads to the bursting of the fluorescence of CQDs, as shown in Fig. 1. Based on this phenomenon, CQDs can be utilized as a fluorescent probe for detecting DA.25
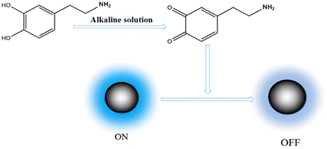 | ||
| Fig. 1 The mechanism of dopamine quenching the fluorescence of carbon quantum dots under alkaline conditions. | ||
Effect of carbon source type on the fluorescence intensity of CQDs and N-CQDs
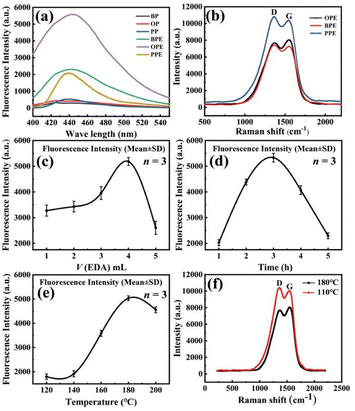
The choice of carbon source is a crucial factor in determining the successful synthesis of CQDs. Additionally, doping CQDs with nitrogen can enhance electron transitions and improve their fluorescence effect. The fluorescence intensity was used to measure the influence of different carbon source species and nitrogen doping on the fluorescence effect of the N-CQDs. The fluorescence intensity of N-CQDs, as shown in Fig. 2(a), is significantly higher than that of simple CQDs. This is because the doping of N atoms alters the bonding structure of CQDs and enhances their fluorescence intensity.26 The corresponding normalized graph of Fig. 2(a) is provided in Fig. S1 in the ESI.† Additionally, the fluorescence intensity of N-CQDs made from orange peel (OP) is significantly higher than that of those made from banana peels (BP) and pitaya peels (PP). This is because the carbonization degree of OP, BP and PP had a greater effect on the fluorescence intensity of the prepared N-CQDs, and the high degree of carbonization resulted in a better lattice structure of the generated N-CQDs, which had a stronger electron gain/loss ability than amorphous carbon and was more stable, as shown in Fig. 2(b). N-CQDs made from orange peel and ethylenediamine (OPE), banana peel and ethylenediamine (BPE), pitaya peel and ethylenediamine (PPE), respectively, showed ID(PPE)/IG(PPE) > ID(BPE)/IG(BPE) > ID(OPE)/IG(OPE), and thus, the order of carbonation of N-CQDs was PPE < BPE < OPE. Therefore, orange peel was chosen to make N-CQDs for the subsequent preparation process. The amount of ethylenediamine added is an important factor for successfully doping nitrogen elements in CQDs. The factors of reaction temperature and reaction time affect the fluorescence effect of N-CQDs to some extent.As shown in Fig. 2(c) and (d), the fluorescence intensity of the N-CQDs produced is the largest when the volume of ethylenediamine is 4 mL and the reaction time is 3 hours. The reason for this was that N-CQDs were not easily generated with a reaction time that was too short, while a reaction time that was too long increased the occurrence of carbonization particle agglomeration, resulting in a decrease in fluorescence intensity. As shown in Fig. 2(e), the fluorescence intensity of the N-CQDs reached a maximum at a reaction temperature of 180 °C. The reason is that if the temperature is too low, the carbon source carbonization is incomplete, generating less graphitized carbon and more amorphous carbon, and the electron gaining and losing ability is relatively weak, affecting the fluorescence intensity.27 As shown in Fig. 2(f), when the hydrothermal reaction temperature is 110 °C, the D peak Raman light intensity is ID(110 °C) = 10![[thin space (1/6-em)]](https://www.rsc.org/images/entities/char_2009.gif) 398, the G peak Raman light intensity is IG(110 °C) = 10
398, the G peak Raman light intensity is IG(110 °C) = 10![[thin space (1/6-em)]](https://www.rsc.org/images/entities/char_2009.gif) 062.5, and the degree of carbonization is ID(110 °C)/IG(110 °C) = 1.033. The hydrothermal reaction temperature is 180 °C, the D peak Raman light intensity is ID(180 °C) = 7687.43, the G peak Raman optical intensity is IG(180 °C) = 8050.08, and the degree of carbonization is ID(180 °C)/IG(180 °C) = 0.955. ID(180 °C)/IG(180 °C) < ID(110 °C)/IG(110 °C), which indicates that a higher temperature is favorable for the carbonization degree of the feedstock during the hydrothermal reaction. On the other hand, the N element exists on the surface of carbon quantum dots in the form of an amino group. Because the amino group is unstable, it is easy to leave the surface of carbon quantum dots when the temperature is too high, which affects the doping of N and thus affects the fluorescence intensity of carbon quantum dots.28
062.5, and the degree of carbonization is ID(110 °C)/IG(110 °C) = 1.033. The hydrothermal reaction temperature is 180 °C, the D peak Raman light intensity is ID(180 °C) = 7687.43, the G peak Raman optical intensity is IG(180 °C) = 8050.08, and the degree of carbonization is ID(180 °C)/IG(180 °C) = 0.955. ID(180 °C)/IG(180 °C) < ID(110 °C)/IG(110 °C), which indicates that a higher temperature is favorable for the carbonization degree of the feedstock during the hydrothermal reaction. On the other hand, the N element exists on the surface of carbon quantum dots in the form of an amino group. Because the amino group is unstable, it is easy to leave the surface of carbon quantum dots when the temperature is too high, which affects the doping of N and thus affects the fluorescence intensity of carbon quantum dots.28
Characterization of fluorescent carbon quantum dots
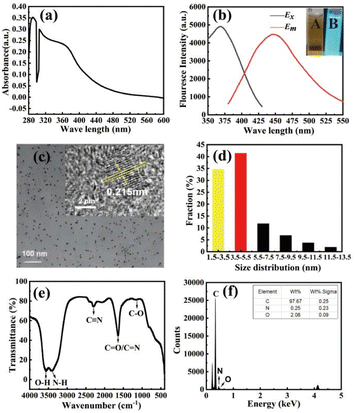
To characterize the valence electron transitions in N-CQDs, which in turn helps determine the structural and optical properties of N-CQDs, the N-CQDs were analysed using a UV-visible spectrophotometer. As shown in Fig. 3(a), an absorption peak appeared at 285 nm, which was presumed to be caused by π–π* transitions due to C![[double bond, length as m-dash]](https://www.rsc.org/images/entities/char_e001.gif) C bonding.29 There was also a sudden drop in absorbance at 300 nm, which might be attributed to intrinsic impurities in the raw material of orange peels. Additionally, a small cluster of absorption peaks appeared at approximately 360 nm, possibly indicating that the electronic structure in the CQDs had been altered by N doping through C
C bonding.29 There was also a sudden drop in absorbance at 300 nm, which might be attributed to intrinsic impurities in the raw material of orange peels. Additionally, a small cluster of absorption peaks appeared at approximately 360 nm, possibly indicating that the electronic structure in the CQDs had been altered by N doping through C![[double bond, length as m-dash]](https://www.rsc.org/images/entities/char_e001.gif) N bonding, resulting in the generation of n–π* transitions and the observed absorption peaks.30 One hundred microliters of the prepared N-CQDs were taken and diluted for the measurements. A PL was used to measure the maximum excitation and emission wavelengths of the samples. As shown in Fig. 3(b), the maximum λex of the N-CQDs solution was 370 nm, and the maximum λem was 445 nm. Illustration A indicates that the N-CQDs do not emit light under daylight, and illustration B indicates that the N-CQDs emit blue light when irradiated by UV lamps. Afterward, the fluorescence intensity of the solution was measured at the maximum excitation and emission wavelengths. The size, morphology, and other characteristics of the material can be obtained through TEM characterization. The lattice information of the material can be obtained through HRTEM characterization.
N bonding, resulting in the generation of n–π* transitions and the observed absorption peaks.30 One hundred microliters of the prepared N-CQDs were taken and diluted for the measurements. A PL was used to measure the maximum excitation and emission wavelengths of the samples. As shown in Fig. 3(b), the maximum λex of the N-CQDs solution was 370 nm, and the maximum λem was 445 nm. Illustration A indicates that the N-CQDs do not emit light under daylight, and illustration B indicates that the N-CQDs emit blue light when irradiated by UV lamps. Afterward, the fluorescence intensity of the solution was measured at the maximum excitation and emission wavelengths. The size, morphology, and other characteristics of the material can be obtained through TEM characterization. The lattice information of the material can be obtained through HRTEM characterization.
As shown in Fig. 3(c), the N-CQD particles can be approximated to be spherical with a more uniform size and distribution; moreover, the inset of Fig. 3(c) shows that the lattice spacing of the N-CQD is 0.215 nm, which is close to the (100) diffraction plane of graphitic arbon,31 indicating that the as-prepared N-CQD has a more egular lattice structure.32 As shown in Fig. 3(d), the particle size ranges from 1.5–13.5 nm. The number of N-CQDs with particle sizes between 3.5 and 5.5 nm is predominant. Characterization of N-CQDs by FTIR spectroscopy enables the identification of characteristic absorption peaks of the functional groups present in the material, thereby facilitating structural and material characterization. As shown in Fig. 3(e), the vibrational peak at 3556 cm−1 corresponds to the stretching vibration of the O–H bond. The vibrational peak at 3412 cm−1 corresponds to the stretching vibration of the N–H bond. The vibrational peak at 2298 cm−1 corresponds to the stretching vibration of the C![[triple bond, length as m-dash]](https://www.rsc.org/images/entities/char_e002.gif) N bond.33 The vibrational peak at 1640 cm−1 corresponds to the stretching vibration of either the C
N bond.33 The vibrational peak at 1640 cm−1 corresponds to the stretching vibration of either the C![[double bond, length as m-dash]](https://www.rsc.org/images/entities/char_e001.gif) O or C
O or C![[double bond, length as m-dash]](https://www.rsc.org/images/entities/char_e001.gif) N bond. The vibrational peak at 1146 cm−1 corresponds to the stretching of the C–O bond vibration. The IR spectra indicate the successful introduction of nitrogen atoms into the CQDs.34 The elemental composition and content of the material can be obtained through EDS characterization. From Fig. 3(f), it can be observed that the N-CQDs. Containing elements C, N, and O, the mass fraction of carbon is remarkably high at 97.69%. The mass fraction of nitrogen is equal to 0.25%, indicating successful synthesis of CQDs and successful nitrogen doping into the carbocyclic structure.
N bond. The vibrational peak at 1146 cm−1 corresponds to the stretching of the C–O bond vibration. The IR spectra indicate the successful introduction of nitrogen atoms into the CQDs.34 The elemental composition and content of the material can be obtained through EDS characterization. From Fig. 3(f), it can be observed that the N-CQDs. Containing elements C, N, and O, the mass fraction of carbon is remarkably high at 97.69%. The mass fraction of nitrogen is equal to 0.25%, indicating successful synthesis of CQDs and successful nitrogen doping into the carbocyclic structure.
Fluorescence quantum yield calculations
The fluorescence quantum yield is a measure of the efficiency of fluorescence in a material. It is determined by the ratio of the number of fluorescence photons emitted by N-CQDs after absorbing light energy to the number of photons of the absorbed excitation light. Since the concentration of the samples to be measured and the standard samples used in the experiment is very low, the effect of solute can be neglected. Therefore, the refractive index of water, the solvent, is taken as 1.33. The experimental data are shown in Table 1. Through calculation, the fluorescence quantum yield of the experimentally prepared N-CQDs is determined to be 35.37%.| Name | λex | λem | A | S | ϕ |
|---|---|---|---|---|---|
| Quinine sulfate | 313 | 420 | 0.0377 | 218![[thin space (1/6-em)]](https://www.rsc.org/images/entities/char_2009.gif) 415 415 |
0.54 |
| N-CQDs | 370 | 445 | 0.047 | 178![[thin space (1/6-em)]](https://www.rsc.org/images/entities/char_2009.gif) 352.9 352.9 |
0.3537 |
Haitao Ren utilized peach cotyledon (PC) biomass waste as a raw material to prepare CQDs using the hydrothermal method, resulting in a fluorescence quantum yield of 7.71%.35 Juri Goswami utilized banana stem (BS) biomass and phosphoric acid as raw materials to synthesize CQDs through the hydrothermal method, achieving a maximum fluorescence quantum yield of 15.1%.36 Qianghua Ye et al. used eggs (E) as a raw material to synthesize nitrogen and sulfur codoped CQDs through a one-pot method, resulting in a fluorescence quantum yield of 17.48%.37 Anusuya Boruaha et al. prepared CQDs from taro peel (TB), a biomass waste, and achieved a fluorescence quantum yield of 13.80%.38 Kaiming Kang et al. prepared a new type of green carbon quantum dot using grape skin (GS) as a carbon source through the hydrothermal method, resulting in a quantum yield as high as 26.7%.39 Abbas et al. prepared CQDs using the hydrothermal method and black tea (BT) as the raw material. The fluorescence quantum yield of the CQDs reached 21% (Fig. 4).40
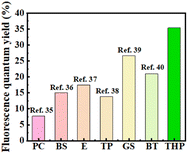 | ||
| Fig. 4 Comparison of quantum yields of CQDs produced from biomass in the literature.35–40 (This paper (THP).) | ||
Feasibility and specificity verification
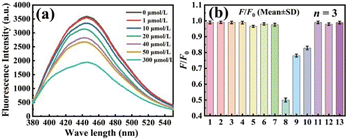
The detection of DA was based on the effective fluorescence quenching of N-CQDs by DA. As shown in Fig. 5(a), the higher the concentration of DA added, the lower the fluorescence intensity of the system. This finding demonstrates the feasibility of using the prepared N-CQDs as fluorescent probes for detecting DA. A significant number of heteroionic or biosmall molecules affect the DA assay on real rabbit serum samples. To investigate the specific response of N-CQDs to DA, we conducted fluorescence intensity measurement experiments using various metal elements, including Ca2+, K+, Zn2+, and Fe2+, as well as small molecules, such as phenylalanine, triglyceride, urea, tyrosine, and DA (which is present in high concentrations in human serum). As shown in Fig. 5(b), triglycerides and phenylalanine slightly reduced the fluorescence intensity of the system. However, tyrosine and Fe2+ significantly reduce the fluorescence intensity. If EDTA is added first, the effect of tyrosine and Fe2+ on the fluorescence intensity of N-CQDs can be avoided by masking the interaction of tyrosine and Fe2+ with N-CQDs. EDTA had no bursting effect on the N-CQDs. Additionally, DA significantly reduces the fluorescence intensity of the system. This demonstrates that common interfering substances have minimal impact on the established fluorescent probe method, making it highly selective for DA.Process optimization for dopamine detection
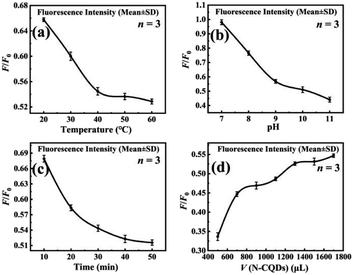
The reaction temperature, solution pH, reaction time, and the amount of N-CQDs added are important factors that affect the effectiveness of DA detection. As shown in Fig. 6(a), the degree of DA bursting on the N-CQDs increased significantly with increasing reaction temperature. The best effect of DA on N-CQDs fluorescence bursting was achieved when the reaction temperature was 40 °C. The reason is that DA is easy to polymerize at 25–40 °C, and a higher temperature is favorable for increasing the activity of dopamine, thus promoting the polymerization of dopamine. Dopamine polymers have more conjugated structures and aromatic rings, which enhance π–π interactions between intermolecular molecules, enhance energy transfer with carbon quantum dots and are more effective in fluorescence bursting of N-CQDs.41As shown in Fig. 6(b), the effect of the DA burst becomes stronger as the pH of the solution increases. When the pH of the solution exceeds 9, DA readily polymerizes to produce polydopamine.42 However, the fluorescence intensity of the solution is still reduced due to the pH of the solution affecting the charge transfer of the functional groups on the surface of the N-CQDs. This leads to the deprotonation of the groups, which reduces the density of free electrons on the top of the functional groups. Consequently, the fluorescence intensity is reduced, which affects the detection of DA. DA detection, so pH 9 was chosen for subsequent experiments.
As shown in Fig. 6(c), under alkaline conditions and in the presence of oxygen, a longer reaction time will lead to a sudden increase in the probability of DA polymerization. The nitrogen atoms doped on the surface of the CQDs will undergo an autooxidation reaction, resulting in the loss of functional groups and a modification of the energy level structure. This process will enhance the fluorescence bursting effect of DA on the N-CQDs. However, a reaction time that is too long will result in a significant deviation in DA detection. In this study, a reaction time of 30 minutes was chosen, as shown in Fig. 6(d). The fluorescence intensity of the reaction system increased as the amount of N-CQDs increased. The detection of DA was successfully achieved when the amount of N-CQDs reached 1300 μL. Considering the cost of the materials, 1300 μL of N-CQDs was selected to conduct the subsequent experiments. The amount of N-CQDs was chosen to be 1300 μL for conducting the subsequent experiments.
Plotting fluorescence intensity curves of DA on N-CQDs
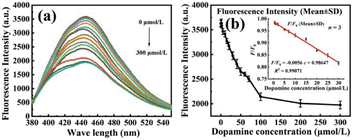
The DA solution was prepared in the concentration range of 0–300 μmol L−1. Accurately, 1300 μL of N-CQDs solution, 1000 μL of NaOH solution at pH 9, and 400 μL of different concentrations of DA solution were added using a pipette gun at λex/λem: 370 nm/445 nm. The reaction was carried out for 30 minutes at 40 °C in a constant-temperature water bath, and the degree of fluorescence intensity burst was measured using a PL, as depicted in Fig. 7(a). The fluorescence intensity burst degree was measured using a PL, as shown in Fig. 7(a). The fluorescence intensity of the system gradually decreased with increasing DA concentration. The strong linear relationship between the concentration of DA and the degree of fluorescence burst on N-CQDs is crucial for accurately detecting the content of DA. As shown in Fig. 7(b), when the concentration of DA was in the range of 0.5–30 μmol L−1, there was a linear relationship between the concentration of DA and the fluorescence intensity. The linear equation was F/F0 = −0.00589c + 0.98441, with an R2 value of 0.9945. The limit of detection (LOD) was determined by dividing the slope of the standard curve by the 3-fold standard deviation of the blank. For the present experiment, the LOD was calculated to be 0.16 μmol L−1. The LOD was 0.16 μmol L−1 for the current experiment.Detection of dopamine in serum
The N-CQDs prepared in this experiment were used as a fluorescent probe for the analysis and detection of DA in rabbit serum, and their use as a fluorescent probe for the determination of real samples was analysed for its better accuracy by spiked recoveries as well as precision measurements.43| Sample | Detected quantity (μmol L−1) | Additive quantity (μmol L−1) | Total amount detected (μmol L−1) | Standard recovery (%) | RSD (%) |
|---|---|---|---|---|---|
| Rabbit serum | 5.05 | 5 | 10.21 | 102.9 | 5.07 |
| 20 | 24.74 | 98.4 | 2.47 |
Conclusion
In this paper, CQDs and N-CQDs were prepared by a one-step hydrothermal method using banana peel and orange peel as carbon sources and ethylenediamine as a nitrogen source, and N-CQDs prepared from orange peel and ethylenediamine were finally selected as fluorescent probes for the analysis and detection of DA through the comparison of fluorescence intensity. After that, λex was 370 nm, and λem was 445 nm. The optimal preparation conditions of N-CQDs were explored: the reaction temperature was 180 °C, the reaction time was 3 hours, the dosage of orange peel was 4.0000 g, and the dosage of ethylenediamine was 4.00 mL. Then, it was used to characterize UV-vis, PL, TEM, and FT-IR and subsequently explore the optimal conditions for detecting DA. After that, the optimal conditions for the detection of DA were explored: 1300 μL of N-CQDs solution, pH 9 of the solution, a reaction temperature of 40 °C, and a reaction time of 30 min. The specificity test was then conducted, revealing that the prepared fluorescent probes exhibited high selectivity in detecting DA. The fluorescence burst curves of N-CQDs were plotted by preparing different concentrations of DA solutions ranging from 0–300 μmol L−1. There was a linear relationship between the concentration of DA and the fluorescence intensity within the range of 0.5–30 μmol L−1. The linear equation describing this relationship was F/F0 = −0.00589c + 0.98441, with an R2 value of 0.9945. The detection limit for DA was determined to be 0.16 μmol L−1. The DA standard was added to the actual samples. The DA standard was added to the actual sample of rabbit serum for the spiked recovery experiment. The spiked recoveries ranged from 98% to 103% with RSDs between 2% and 6%. This demonstrates that the data are reliable and indicates that utilizing discarded fruit peels is a practical and effective method for accurately detecting DA.Author contributions
Li Han: investigation, methodology, writing original draft; Yingkai Guo, Haohao Zhang, Zifan Wang: develop experimental plan; Fan Zhang, Yiran Wang, Xingqi Li: conducting experiments; Ying Wang, Jiajia Ye: review paper.Conflicts of interest
There are no conflicts to declare.Acknowledgements
Supported by Research Program of Qilu Institute of Technology (No. QIT23NN009). This work is supported by an innovation training program for college students in Shandong Province (S202313998221). The authors would like to thank Chenxiao Qi from Shiyanjia Lab (http://www.shiyanjia.com) for the Raman test.References
- Y. N. Yang, H. Wang, Y. W. Wu and X. X. Yu, Spectrochim. Acta, Part A, 2022, 265, 120385 CrossRef CAS PubMed.
- S. S. Meng, Y. M. Liu, L. Wang, X. X. Ji, Y. Chen, T. T. Zheng, J. Yu and H. H. Feng, Frontiers in Bioengineering and Biotechnology, 2021, 9, 726071 CrossRef PubMed.
- J. F. Pan, C. F. Miao, Y. T. Chen, J. H. Ye, Z. Z. Wang, W. D. Han, Z. J. Huang, Y. J. Zheng and S. H. Weng, Chem. Pharm. Bull., 2020, 68(7), 628–635 CrossRef CAS PubMed.
- H. L. Yang, L. F. Bai, Z. R. Geng, H. Chen, L. T. Xu, Y. C. Xie, D. J. Wang, H. W. Gu and X. M. Wang, Mater. Today Adv., 2023, 18, 100376 CrossRef CAS.
- J. Z. Zhang, X. Ji, N. C. Ye, H. T. Zhang, H. Sun, C. Z. Xu, L. Liu, J. J. Ma and Z. W. Tong, J. Electrochem. Soc., 2023, 170, 037502 CrossRef CAS.
- F. C. Chen, B. X. Fang and S. C. Wang, J. Anal. Methods Chem., 2021, 882, 1126–1135 Search PubMed.
- M. Lettieri, M. Spinelli, L. Caponi, S. Scarano, P. Palladino, A. Amoresano and M. Minunni, Sensors, 2023, 23, 3971 CrossRef CAS PubMed.
- J. Ren, J. J. Bai, T. T. Cai, S. J. Li, E. Pang, H. Zhang and Z. Z. Li, Opt. Mater., 2021, 115, 111064–111075 CrossRef.
- N. U. M. Nizam and M. M. Hanafiah, IOP Conf. Ser.: Mater. Sci. Eng., 2023, 1167, 012035 Search PubMed.
- G. Deme, A. Belay, D. M. Andoshe, G. Barsisa, D. Tsegaye, S. Tiruneh and C. Seboka, J. Nanomater., 2023, 1701496 CAS.
- G. Kalaiyarasan, J. Joseph and P. Kumar, ACS Omega, 2020, 10, 22278–22288 CrossRef.
- W. L. Guo, Y. W. Lan, Y. Q. Peng, W. B. Bao and L. Y. Zhou, Chem. Pap., 2022, 76, 3627–3638 CrossRef.
- M. Saqib, S. Bashir, H. J. Li, S. S. Wang and Y. D. Jin, Anal. Chem., 2019, 91, 3070–3077 CrossRef CAS PubMed.
- W. J. Chen, H. Lin, Y. Y. Wu, M. Yang, X. J. Zhang, S. H. Zhu, M. T. He, J. X. Xie and Z. J. Shi, Adv. Compos. Hybrid Mater., 2022, 5, 2378–2386 CrossRef CAS.
- S. Mathew and B. Mathew, Inorg. Chem. Commun., 2023, 156, 111223–111240 CrossRef CAS.
- A. Gholipour, M. Jahanshahi and H. Emadi, J. Cluster Sci., 2023, 1–15 Search PubMed.
- A. Tiwari, S. Walia, S. Sharma, S. Chauhan, M. Kumar, T. Gadly and J. K. Randhawa, J. Mater. Chem. B, 2023, 11, 1029–1043 RSC.
- Y. Zhou, G. Q. Chen, C. Q. Ma, J. Gu, T. Q. Yang, L. Li, H. Gao, Y. Xiong, Y. M. Wu, C. Zhu, H. Wu, W. Z. Yin, A. Q. Hu, X. Q. Qiu, W. N. Guan and W. Zhang, Spectrochim. Acta, Part A, 2023, 293, 122414–122423 CrossRef CAS PubMed.
- L. Gontrani, E. M. Bauer, A. Nucara, P. Tagliatesta and M. Carbone, Chemosensors, 2022, 10, 362 CrossRef CAS.
- F. J. Zhao, Z. S. Liu, S. X. Sui, K. Huang, Y. Yang, Z. Chen and H. M. Yin, Spectrochim. Acta, Part A, 2023, 294, 122542 CrossRef CAS PubMed.
- L. H. Zheng, H. B. Zhang, M. Won, E. Kim, M. Li and J. S. Kim, Biosens. Bioelectron., 2023, 224, 115050–115057 CrossRef CAS PubMed.
- M. Chaghaghazardi, S. Kashanian, M. Nazari, K. Omidfar, Y. Joseph and P. R. Affiliation, Spectrochim. Acta, Part A, 2023, 293, 122448 CrossRef CAS PubMed.
- R. Wang, K. Q. Lu, Z. R. Tang and Y. J. Xu, J. Mater. Chem. A, 2017, 5, 3717–3734 RSC.
- K. Soumya, N. More, M. Choppadandi, D. A. Aishwarya, G. Singh and G. Kapusetti, Biomed. Technol., 2023, 4, 11–20 CrossRef CAS.
- Z. K. Zhu, H. M. Niu, R. R. Li, Z. C. Yang, X. Li, P. Pan, J. Liu and B. Z. Zhou, Biosens. Bioelectron., 2022, 10, 100141–100150 CAS.
- X. Y. Deng, Y. L. Feng, H. R. Li, Z. W. Du, Q. Teng and H. J. Wang, Particuology, 2018, 41, 94–100 CrossRef CAS.
- Y. J. Qiu, F. Wang, X. J. Ma, F. Yin, D. N. Li and J. Li, Ind. Crops Prod., 2023, 204, 117243 CrossRef CAS.
- X. M. Li, S. L. Zhang, S. A. Kulinich, Y. L. Liu, Y. H. Zeng and H. B. Zeng, Sci. Rep., 2014, 4, 4976–4985 CrossRef CAS.
- M. Pant, S. Kumar, K. Kiran, N. S. Bisht, V. Pande and A. Dandapat, RSC Adv., 2023, 13, 9186–9194 RSC.
- Y. Huang, X. J. Si, M. Han and C. Bai, Molecules, 2022, 27, 8834 CrossRef CAS PubMed.
- L. Đorđević, F. Arcudi, M. Cacioppo and M. Prato, Nat. Nanotechnol., 2022, 17, 112–130 CrossRef PubMed.
- F. S. Niu, Y. L. Ying, X. Hua, Y. S. Niu, Y. H. Xu and Y. T. Long, Carbon, 2018, 127, 340–348 CrossRef CAS.
- S. A. Al-Ghamdi, A. A. A. Darwish, T. A. Hamdalla, A. Pasha, M. E. Elnair, A. Al-Atawi and S. Khasim, Int. J. Electrochem. Sci., 2023, 18, 100102 CrossRef CAS.
- O. W. Xu, J. Yang, H. Y. Song, L. Z. Dong, J. Xia and X. S. Zhu, Talanta Open, 2023, 7, 100162 CrossRef.
- H. Y. Ren, Y. Yuan, A. Labidi, Q. B. Dong, K. Zhang, E. Lichtfouse, A. A. Allam, J. S. Ajarem and C. Y. Wang, Chin. Chem. Lett., 2023, 34, 107998–108003 CrossRef.
- J. Goswami, S. S. Rohman, A. K. Guha, P. Basyach, K. Sonowal, S. P. Borah, L. Saikia and P. Hazarika, Mater. Chem. Phys., 2022, 286, 126133–126144 CrossRef CAS.
- Q. H. Ye, F. Y. Yan, Y. M. Luo, Y. Y. Wang, X. G. Zhou and L. Chen, Spectrochim. Acta, Part A, 2017, 173, 854–862 CrossRef CAS PubMed.
- A. Boruah, M. Saikia, T. Das, R. L. Goswamee and B. K. Saikia, J. Photochem. Photobiol., B, 2020, 209, 111940–111952 CrossRef CAS PubMed.
- K. M. Kang, B. Y. Liu, G. Yue, H. W. Ren, K. Y. Zheng, L. M. Wang and Z. Q. Wang, Ecotoxicol. Environ. Saf., 2023, 255, 114795–114805 CrossRef CAS PubMed.
- A. Abbas, S. Rubab, A. Rehman, S. Irfan, H. M. A. Sharif, Q. Liang and T. A. Tabish, Mater. Today Chem., 2023, 30, 101555–101563 CrossRef CAS.
- S. K. Tammina, D. Yang, S. Koppala, C. Cheng and Y. Yang, J. Photochem. Photobiol., B, 2019, 194, 61–70 CrossRef CAS PubMed.
- M. B. Prado, N. T. Truong and A. K. Wanekaya, Sensors and Actuators Reports, 2023, 6, 100165–100173 CrossRef.
- S. W. Park, T. E. Kim and Y. K. Jung, Anal. Chim. Acta, 2021, 1165, 338513–338522 CrossRef CAS PubMed.
- J. M. Li, Y. T. Zhou, Z. J. Li, T. Wang, Q. Sun, T. Le and R. Jirimutu, LWT--Food Sci. Technol., 2023, 185, 115130–115137 CrossRef CAS.
Footnote |
| † Electronic supplementary information (ESI) available. See DOI: https://doi.org/10.1039/d3ra06799h |
| This journal is © The Royal Society of Chemistry 2024 |


