 Open Access Article
Effect of sulphidation process on the structure, morphology and optical properties of GO/AgNWs composites
Mahammad Baghir Baghirov *a,
Mustafa Muradova,
Goncha Eyvazovaa,
Yashar Azizian-Kalandaraghbc,
Sevinj Mammadyarova
 a,
Jiseok Kima,
Eldar Gasımovd and
Fuad Rzayev
 e
e
aNano Research Laboratory, Baku State University, 23 Academic Zahid Khalilov Street, Baku AZ1148, Azerbaijan. E-mail: bmbaghir@gmail.com
bPhotonics Application and Research Center, Gazi University, 06500 Ankara, Turkey
cPhotonics Department, Applied Science Faculty, Gazi University, 06500 Ankara, Turkey
dDepartment of Cytology, Embryology and Histology, Azerbaijan Medical University, Samad Vurghun, Baku, Nasimi AZ1022, Azerbaijan
eDepartment of Electron Microscopy, Azerbaijan Medical University, Samad Vurghun, Baku, Nasimi AZ1022, Azerbaijan
First published on 11th January 2024
Abstract
In this study, composite materials composed of graphene oxide (GO) synthesized by a modified Hummers' method and silver nanowires (AgNWs) synthesized by a modified polyol method were prepared. The prepared composites were subjected to sulfidation under the influence of H2S gas. Structural changes in the samples were evaluated using X-ray diffraction (XRD). The binding nature of the composite was characterized using FT-IR spectroscopy. Optical properties and band gap values were investigated using ultraviolet-visible (UV-Vis) spectroscopy. The morphology of the composites was analyzed by transmission electron microscopy (TEM). A simple method using H2S gas was applied for the sulphidation process of the samples. The sulfidation process was successful under the influence of H2S gas, resulting in an increased distance between the GO layers and a decrease in the band gap value for the composite post-sulfidation. In addition, AgNWs were observed to decompose into Ag2S nanoparticles under the influence of H2S gas. It was determined that the value of the band gap of the sample changes because of sulphidation.
1 Introduction
In recent decades, GO and AgNWs have emerged as materials of particular interest due to their unique properties.1–5 These materials can be applied in various devices and systems, each exhibiting superior characteristics.6–14 However, challenges are associated with these materials. Specifically, AgNWs possess high chemical reactivity and are prone to oxidation, while the abundance of touchpoints in AgNWs leads to a decrease in conductivity. Research indicates that these issues can be addressed by covering these nanowires with graphene oxide (GO) sheets.15,16 Furthermore, investigations reveal that GO/AgNWs composites not only mitigate the incompatibilities between individual components but also offer new advantages. Remarkably, GO/AgNWs composites possess properties such as photonic stability, plasmonic resonance, high surface energy, and biocompatibility.17 The role of 1D AgNWs embedded in GO layers in enhancing electrical conductivity and mechanical flexibility should be emphasized, as this feature can be employed to create delicate, highly conductive layers, potentially addressing challenges in solar batteries and sensors.18Another intriguing aspect of research involves the sulfidation of these samples. Sulfidation can result in the formation of Ag2S, which transforms the material into a semiconductor with new properties. Research on Ag2S indicates that it is a non-toxic material, making it suitable for optoelectronic and photocatalytic applications.19 It is known that Ag readily undergoes sulfidation in an H2S environment, leading to the formation of Ag2S, and literature results show that the sulfidation of AgNWs results in the creation of Ag–Ag2S NWs heterostructures, yielding high photocatalytic properties.20–22 The impact of sulfidation on GO has also been extensively investigated, revealing that sulfidated GO sheets undergo crumpling and bending.23 The influence of sulfur on defects in GO sheets has been observed, with defects increasing in size depending on the sulfur dosage.24 Additionally, sulfur-doped GO is utilized as an electrode material in capacitors due to its high electrical conductivity.25,26 Ag2S/GO nanocomposites can be used as an antibacterial element in terms of photothermal and photocatalytic properties.27 Research shows that Ag2S/GO nanocomposites exhibit better luminescence properties than Ag2S.28 Also, these composites can be used for photocatalytic purposes by making various additives.29 Ag2S and GO samples are used separately in PV materials, so that these materials can be used in a composite form, which can create a wide range for PV materials.30,31
In this study, a successful synthesis of GO/AgNWs composites has been achieved, and a simple method has been proposed for sulfidating these composites. The effects of H2S gas on the properties of GO/AgNWs composites were investigated, and samples were prepared by exposing them to H2S gas. The structural, morphological, and optical properties of the samples were examined both before and after sulfidation, and a comparative analysis was conducted.
2 Materials and methods
2.1 Synthesis of GO
The investigated work involved the synthesis of GO modified by the Hummers' method.32–34 Initially, 3 grams of graphite powder were placed in a 500 ml container, and 1.5 g of sodium nitrate (NaNO3) was added. Subsequently, 70 ml of concentrated sulfuric acid (H2SO4) was added to the sample, and the mixture was cooled to 0 °C in an ice bath. Under these conditions, the mixture was stirred for 1 hour using a magnetic stirrer. Concurrently, potassium permanganate (KMnO4) was gradually added to the mixture at a slow rate. It is crucial to maintain the reaction temperature below 20 °C by adding KMnO4 in small increments. After the addition of KMnO4, the mixture was stirred for 3 hours. Following this, the mixture was removed from the ice bath and stirred for an additional hour at 35 °C. In the next stage, 150 ml of water was added dropwise, and the mixture was stirred at 98 °C for 30 minutes. Subsequently, 300 ml of water was added gradually, and the mixture was stirred for 1 hour. Then, 15 ml of 30% hydrogen peroxide (H2O2) was added, and the mixture was stirred for 30 minutes. The resulting mixture was filtered through filter paper, and to remove residual metal ions, it was washed with distilled water (DW) (250 ml) containing hydrochloric acid (HCl) in a 1![[thin space (1/6-em)]](https://www.rsc.org/images/entities/char_2009.gif) :
:![[thin space (1/6-em)]](https://www.rsc.org/images/entities/char_2009.gif) 10 ratio. Finally, the resulting product was dried at room temperature.
10 ratio. Finally, the resulting product was dried at room temperature.
2.2 Synthesis of AgNWs and GO/AgNWs composites
Silver nanowires were synthesized using a modified polyol method inspired by the literature.35 Ethylene glycol (EG) was used as both a solvent and a silver-reducing agent, while polyvinylpyrrolidone (PVP, molecular weight: 360![[thin space (1/6-em)]](https://www.rsc.org/images/entities/char_2009.gif) 000) acted as a capping agent. Sodium chloride (NaCl) and potassium bromide (CuBr2) were used to maintain charge balance and facilitate growth. In a summary of the synthesis process, PVP was dissolved in EG at a concentration of 295.6 mM for 3 hours at an elevated temperature, then cooled down to room temperature. Solutions of CuBr2 (3.2 mM) and NaCl (15.7 mM) in EG were prepared for later use. Silver nitrate (AgNO3) was dissolved in EG to reach a concentration of 187.8 mM. The synthesis procedure involved placing 5 ml of EG into a 20 ml vial, which was then heated in a silicone oil bath at 160 °C. CuBr2 (100 μl) and NaCl (150 μl) solutions were injected into the vial after 10 minutes. Over 15 minutes, 1.5 ml of AgNO3 and 1.5 ml of PVP solutions were added drop by drop. After the addition of AgNO3 and PVP, the reaction continued for 1.5 hours and was cooled down to room temperature. To collect the silver nanowires, acetone was added to the reaction solution, resulting in precipitates. The precipitates were collected after centrifugation at 4000 rpm for 8 minutes. The washing process was repeated three times to remove excess chemicals. The final product was dispersed in ethanol for future use.
000) acted as a capping agent. Sodium chloride (NaCl) and potassium bromide (CuBr2) were used to maintain charge balance and facilitate growth. In a summary of the synthesis process, PVP was dissolved in EG at a concentration of 295.6 mM for 3 hours at an elevated temperature, then cooled down to room temperature. Solutions of CuBr2 (3.2 mM) and NaCl (15.7 mM) in EG were prepared for later use. Silver nitrate (AgNO3) was dissolved in EG to reach a concentration of 187.8 mM. The synthesis procedure involved placing 5 ml of EG into a 20 ml vial, which was then heated in a silicone oil bath at 160 °C. CuBr2 (100 μl) and NaCl (150 μl) solutions were injected into the vial after 10 minutes. Over 15 minutes, 1.5 ml of AgNO3 and 1.5 ml of PVP solutions were added drop by drop. After the addition of AgNO3 and PVP, the reaction continued for 1.5 hours and was cooled down to room temperature. To collect the silver nanowires, acetone was added to the reaction solution, resulting in precipitates. The precipitates were collected after centrifugation at 4000 rpm for 8 minutes. The washing process was repeated three times to remove excess chemicals. The final product was dispersed in ethanol for future use.
In this study, a solvent mixing method was employed to prepare the composite material. Initially, 0.48 g of GO and 0.02 g of AgNWs were mixed in ethanol. Subsequently, the mixture was subjected to ultrasound for 20 minutes to achieve proper dispersion. After ultrasonication, the mixture was filtered and dried at 60 °C. Consequently, composite materials with a 2 wt% concentration of AgNWs in GO (referred to as GO/AgNWs composites) were successfully prepared.
2.3 S doped GO/AgNWs composites
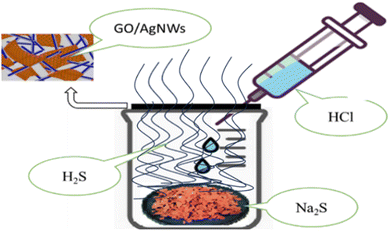
A simple method was used to sulphide the samples. So, first, sodium sulfide (Na2S) is placed inside the laboratory glass container, and then it is closed with a lid. A small gap is kept for air to escape from the bowl. Then the prepared GO/AgNWs nanocomposites are placed on the filter paper and placed on this gap. In the next step, hydrochloric acid (HCl) is gradually added to the container drop by drop using a pipette. During this process, the following reaction (1) occurs:| Na2S + 2HCl → 2NaCl + H2S↑ | (1) |
With the addition of HCl, H2S gas is formed inside the vessel. The gas escapes into the air through the cavity where the sample is placed. At this time, the sample is exposed to H2S gas, and the sample is sulphided. Note that the whole process was carried out at room temperature. A description of the sulphidation process is given in Fig. 1.
2.4 Characterization
The structural analysis of the samples was studied using the Rigaku Mini Flex 600 X-ray diffractometer (λ = 1.5406 Å) using Ni-filtered Cu Kα radiation. Fourier Transform Infrared (FT-IR) spectra were recorded on a Bruker-vertex80 spectrophotometer in KBr pellets. The optical properties of the samples were investigated using a PerkinElmer Lambda 2S UV–Vis Spectrophotometer in the wavelength range of 190–1100 nm. The morphology of the samples was studied by JEM 1400 (JEOL, Japan).3 Result and discussion
3.1 X-ray diffraction analysis
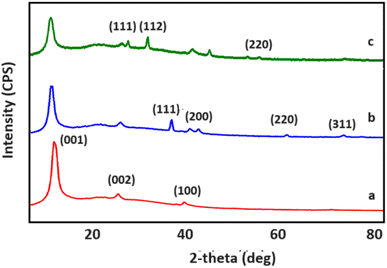
XRD diffractograms for GO, GO/AgNWs and GO/AgNWs + H2S samples are shown in Fig. 1. Fig. 2a demonstrates the structural properties for a sample of GO. The observed peaks at 2θ = 11.09° and 42.06° are characteristic of GO (JCPDS card #75-2078) and indicate the successful synthesis process. The interplanar distance for GO was determined to be d = 0.80 nm. Also, the peak observed at 2θ = 26.24° corresponds to residual graphite during the reaction.36
 | (2) |
XRD spectra for GO/AgNWs nanocomposites are shown in Fig. 2b. The peaks at 2θ = 11.09°, 26.24°, 42.06° belong to GO, the first element of the composite. Peaks corresponding to (111), (200), (220) and (311) planes observed at 2θ = 38.33°, 44.51°, 64.63° and 77.58° are characteristic of AgNWs (JCPDS card no. 04-0783).37 The interplanar distance for GO sheets within the composite increased to d = 0.82 nm. This can be attributed to the inclusion of AgNWs between the GO sheets.
XRD spectra of GO/AgNWs composites exposed to H2S gas are shown in Fig. 3c. Comparing with the initial spectrum of the composite, the characteristic peaks for AgNWs disappeared and new peaks appeared at 28.92°, 32.34° and 57.59°. These peaks are characteristic of Ag2S (JCPDS card no. 14-0072) and indicate that the samples were successfully sulfidized by exposure to H2S gas. However, a small peak with (311) index, characteristic of AgNWs, is still observed. This indicates that the AgNWs are not fully sulphided and formed as Ag–Ag2S heterostructure. Interplanar distance for GO was calculated and found to increase to d = 0.84 nm after sulphidation process. This can be attributed to the fact that the AgNWs inserted between the GO layers are decomposed under the influence of H2S gas and increase the surface area by forming Ag2S.
3.2 FTIR analysis
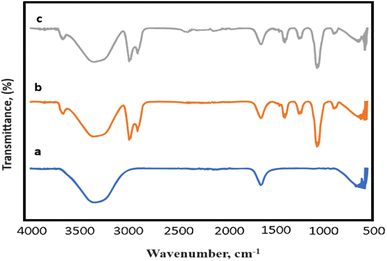
The FTIR results of the samples before and after the doping process are presented in Fig. 3. Fig. 3a–c display the IR spectrum of GO, GO/AgNWs, and S-doped GO/AgNWs composites, respectively. In the spectrum of GO, the broad absorption peak observed at 3369 cm−1 corresponds to the OH stretching vibration. The peaks at 1631 cm−1 and 599 cm−1 are ascribed to the C![[double bond, length as m-dash]](https://www.rsc.org/images/entities/char_e001.gif) C stretching and OH out-of-plane bend, respectively.38,39 In the spectrum of GO/AgNWs composite, the peaks at 2985 cm−1 and 2874 cm−1 are attributed to the asymmetric and symmetric stretching vibrations of CH2, respectively. The peaks observed at 1417 cm−1 and 1385 cm−1 are related to the CH deformation modes from the CH2 group. In addition, the absorption bands at 1247 cm−1 and 1040 cm−1 are correspond to C–N bending and stretching vibrations from the pyrrolidone structure, respectively.40 The peak at 883 cm−1 is attributed to the breathing vibration of the pyrrolidone ring, indicating the tilting of the pyrrolidone ring on the surface of AgNWs.41 In the spectrum of sulfur doped composite (Fig. 3c), the new weak peak was appeared at 2367 cm−1 and it indicates the presence of Ag–S bonds of formed Ag2S.42,43 This newly formed bond provides evidence of the successful doping of the composite with sulfur.
C stretching and OH out-of-plane bend, respectively.38,39 In the spectrum of GO/AgNWs composite, the peaks at 2985 cm−1 and 2874 cm−1 are attributed to the asymmetric and symmetric stretching vibrations of CH2, respectively. The peaks observed at 1417 cm−1 and 1385 cm−1 are related to the CH deformation modes from the CH2 group. In addition, the absorption bands at 1247 cm−1 and 1040 cm−1 are correspond to C–N bending and stretching vibrations from the pyrrolidone structure, respectively.40 The peak at 883 cm−1 is attributed to the breathing vibration of the pyrrolidone ring, indicating the tilting of the pyrrolidone ring on the surface of AgNWs.41 In the spectrum of sulfur doped composite (Fig. 3c), the new weak peak was appeared at 2367 cm−1 and it indicates the presence of Ag–S bonds of formed Ag2S.42,43 This newly formed bond provides evidence of the successful doping of the composite with sulfur.
3.3 UV-Vis spectroscopy analysis
Fig. 4 presents the UV-Vis absorption spectra and (αhʋ)2 versus hʋ curves for the samples. In Fig. 4A, a minor absorption peak is evident at 220 nm, indicative of graphene oxide and associated with the π–π* transition of C–C bonds.44 Furthermore, Fig. 4A illustrates the optical absorption spectrum of silver nanowires (AgNWs), exhibiting characteristic peaks at 353 nm and 390 nm, corresponding to the surface plasmon resonances of AgNWs.45 The introduction of AgNWs amplifies the composite's optical absorption due to the pronounced absorption properties of AgNWs. However, a reduction in optical absorption is noted following sulfur (S) doping. This decline is attributed to the sulfidation of AgNWs and alterations in the surface properties of the composite.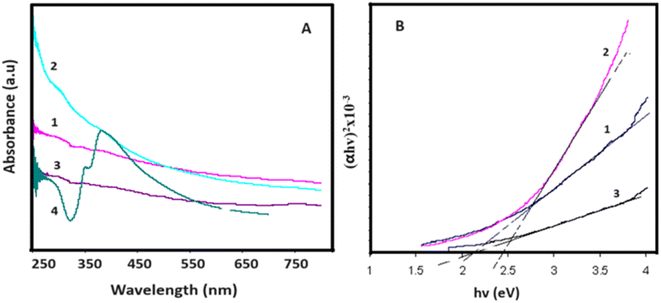 | ||
| Fig. 4 (A) UV-Vis absorption spectra and (B) (αhʋ)2 versus hʋ curves for 1-GO, 2- GO/AgNWs, 3- GO/AgNWs + H2S and 4-AgNWs. | ||
The band gap values for the samples were determined through the Tauc plot (2), and the (αhʋ)2 versus hʋ curves are depicted in Fig. 4B. As illustrated in Fig. 4B, graphene oxide powder exhibits a band gap value of Eg = 2.10 eV. In the case of GO/AgNWs composites, this value increases to Eg = 2.43 eV. This observed increment is attributed to the heightened inter-sheet distance resulting from the introduction of AgNWs between the GO sheets. However, for the GO/AgNWs + H2S samples, a band gap of Eg = 2.10 eV is evident. This phenomenon is ascribed to the formation of Ag2S nanoparticles due to the sulfidation of AgNWs, the disintegration of GO sheets resulting from sulfidation, and the confinement of electrons from 2D to 3D space. Additionally, the homogeneous distribution of Ag2S nanocrystals contributes to this effect. According to existing literature, the band gap for Ag2S nanocrystals falls within the range of Eg = 0.9–1.1 eV.46 Consequently, the analysis of the results indicates that the introduction of sulfur (S) can induce alterations in the band gap of GO/AgNWs composites.
| αhν = β(hν − Eg)n | (3) |
hν-is the photon energy, β is a constant that depends on the structure of the sample and type, Eg is the band gap, the value of n depends on the nature of transition: n = 2 for indirect allowed transition and n = 1/2 for direct allowed transition, α-is the absorption coefficient, its value is obtained from the Beer–Lambert formula.
3.4 TEM analysis
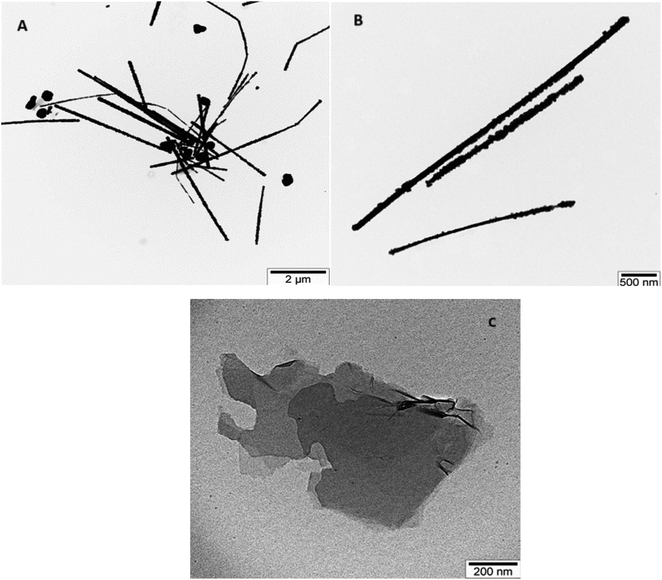
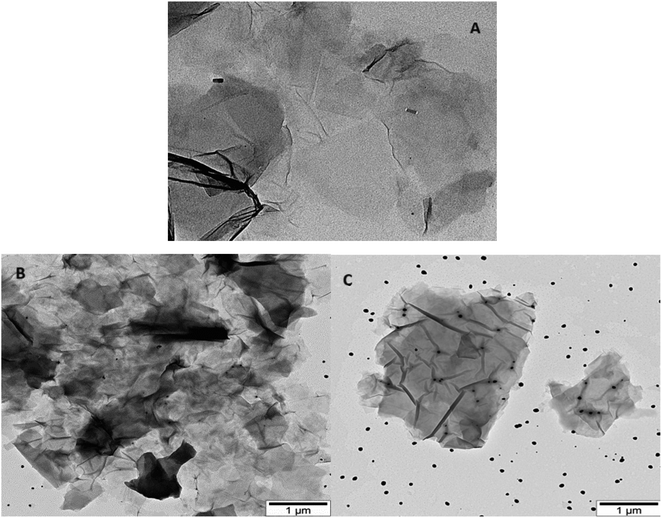
TEM images illustrating AgNWs synthesized through the modified polyol method are presented in Fig. 5A and B. These images depict variations in the lengths and thicknesses of the produced AgNWs. Measurements reveal nanowire diameters ranging from 110 to 50 nm, with lengths varying between 5 and 2.7 μm. Fig. 5A illustrates the synthesis process, indicating the formation of both nanowires and nanoparticles. Furthermore, the surface of the synthesized AgNWs exhibits a rough texture, with areas featuring small diameters. Additionally, the TEM images highlight that the surfaces are not entirely flat; irregularities such as bends are present along the length of the nanowires.Fig. 5C present TEM images aimed at elucidating the morphology of GO nanolayers. Notably, the edges of the nanolayers appear transparent, while the color darkens towards the center, suggesting a multilayered structure for the synthesized samples. The dimensions of the GO nanolayers fall within the range of 0.7 to 2 μm.
TEM images of GO/AgNWs composites are illustrated in Fig. 6A. TEM results show that the nanoparticles underwent fragmentation, resulting in fragmented AgNWs ranging in length from 40 to 60 nm. This fragmentation is because of ultrasonic waves during sonication and leads to special examination points. Fig. 6B and C present TEM images of GO/AgNWs composites after exposure to H2S gas. In Fig. 6B, the GO nanolayers were subjected to decomposition and assembly into a 3D structure under the influence of H2S gas. Additionally, the AgNWs were partially decomposed, resulting in the formation of Ag2S nanocrystals (Fig. 6C). It is believed that the sulfur atoms reacted with the surfaces of the nanoparticles, causing the bonds to break at specific examination points. The size of Ag2S nanocrystals within the composite ranges from 20 to 60 nm and exhibits a uniform distribution throughout the composites.
4 Conclusion
In this investigation, graphene oxide (GO) was synthesized using a modified Hummers' method, while silver nanowires (AgNWs) were synthesized employing a modified Polyol method. Subsequently, a composite material of GO and AgNWs was prepared through a solvent mixing method. Sulfidation of this composite was achieved through exposure to hydrogen sulfide gas resulting from chemical reactions. Structural analysis results indicate that AgNWs underwent sulfidation during this process, leading to the formation of Ag2S nanocrystals. TEM results demonstrate that exposure to H2S gas caused the disintegration and subsequent reassembly of the GO layers. Simultaneously, AgNWs underwent decomposition, forming Ag2S nanoparticles and achieving a homogeneous distribution between the layers. Moreover, the peak corresponding to the bond between Ag and S in the FTIR spectrum confirms the successful sulfidation process. Additionally, as inferred from the UV-Vis spectroscopy results, the reduction of the composite's band gap to Eg = 2.10 eV can be attributed to the reassembly of GO layers and the formation of Ag2S nanocrystals.Conflicts of interest
There are no conflicts to declare.Acknowledgements
This article partially refunded by European Cooperation in Science and Technology (COST) actions: CA21148 (Research and International Networking on Emerging Inorganic Chalcogenides for Photovoltaics (RENEW-PV)) and CA19118 (High-performance Carbon-based composites with Smart properties for Advanced Sensing Applications (EsSENce)). I am grateful to the anonymous reviewers for their valuable comments and suggestions that helped improve the quality of this paper.References
- T. Yumura and A. Yamasaki, Phys. Chem. Chem. Phys., 2014, 16(20), 9656–9666 RSC.
- H. Wadhwa, G. Kandhol, U. P. Deshpande, S. Mahendia and S. Kumar, Colloid Polym. Sci., 2020, 298(10), 1319–1333 CrossRef CAS.
- M. A. Park, S. J. Sung, Y. J. Ahn, I. Hong, I. J. Park, C. R. Park and J. Y. Kim, ACS Appl. Energy Mater., 2021, 4(9), 8824–8831 CrossRef CAS.
- L. Zhang, W. Zhu, Y. Huang and S. Qi, Nanomaterials, 2019, 9(9), 1264 CrossRef CAS PubMed.
- H. S. Kim, M. Patel, H. H. Park, A. Ray, C. Jeong and J. Kim, ACS Appl. Mater. Interfaces, 2016, 8(13), 8662–8669 CrossRef CAS PubMed.
- P. Aspermair, V. Mishyn, J. Bintinger, H. Happy, K. Bagga, P. Subramanian, W. Knoll, R. Boukherroub and S. Szunerits, Anal. Bioanal. Chem., 2021, 413, 779–787 CrossRef CAS PubMed.
- J. Wang, M. Yi, Y. Xin, Y. Pang and Y. Zou, ACS Appl. Mater. Interfaces, 2021, 14(43), 48976–48985 CrossRef PubMed.
- E. Widianto, E. S. Rosa, K. Triyana, N. M. Nursam and I. Santoso, Adv. Nat. Sci.: Nanosci. Nanotechnol., 2021, 12, 035001 CAS.
- K. Y. Yong, Y. K. Chan, E. V. Lau and Y. M. Hung, Case Stud. Therm. Eng., 2022, 31, 101795 CrossRef.
- K. Gong, J. Hu, N. Cui, Y. Xue, L. Li, G. Long and S. Lin, Mater. Des., 2021, 211, 110170 CrossRef CAS.
- C. J. Cheng, R. Balamurugan and B. T. Liu, Micromachines, 2019, 10(10), 682 CrossRef PubMed.
- L. Badrinezhad, Ç. Bilkan, Y. Azizian-Kalandaragh, A. Nematollahzadeh, I. Orak and S. Altindal, Int. J. Mod. Phys. B, 2018, 32, 1750276 CrossRef CAS.
- K. Jong Min, S. Sang Woo, S. Dong Hee, L. Ha Seung, K. Ju Hwan, J. Chan Wook, K. Sung and C. Suk-Ho, Curr. Appl. Phys., 2017, S1567173917301402 Search PubMed.
- G. Zeng, W. Chen, X. Chen, Y. Hu, Y. Chen, B. Zhang and Y. Li, J. Am. Chem. Soc., 2022, 144(19), 8658–8668 CrossRef CAS PubMed.
- C. T. Chou and F. H. Wang, J. Vac. Sci. Technol. A, 2018, 36(5), 05G504 CrossRef.
- F. Duan, W. Li, G. Wang, C. Weng, H. Jin, H. Zhang and Z. Zhang, Nano Res., 2019, 12, 1571–1577 CrossRef CAS.
- J. Singh and A. S. Dhaliwal, J. Phys. Chem. Solids, 2022, 160, 110358 CrossRef CAS.
- Z. Luo, Z. Cai, Y. Wang, Y. Wang and B. Wang, RSC Adv., 2016, 6(43), 37124–37129 RSC.
- B. M. Al-Shehri, M. Shkir, T. M. Bawazeer, S. AlFaify and M. S. Hamdy, Phys. E, 2020, 121, 114060 CrossRef CAS.
- P. Storme, O. Schalm and R. Wiesinger, Heritage Sci., 2015, 3(1), 1–15 CrossRef CAS.
- V. J. Keast, Corros. Mater. Degrad., 2022, 3(2), 221–234 CrossRef CAS.
- Y. Zhang, K. Wang, Y. Yang, J. Xu, B. Sun and L. Zhu, Ecotoxicol. Environ. Saf., 2019, 185, 109739 CrossRef CAS PubMed.
- N. H. A. Rosli, K. S. Lau, T. Winie, S. X. Chin and C. H. Chia, Diamond Relat. Mater., 2021, 120, 108696 CrossRef CAS.
- Y. Zhao, C. Zhang, T. Liu, R. Fan, Y. Sun, H. Tao and J. Xue, Int. J. Electrochem. Sci., 2017, 12(4), 3537–3548 CrossRef CAS.
- Z. Tian, J. Li, G. Zhu, J. Lu, Y. Wang, Z. Shi and C. Xu, Phys. Chem. Chem. Phys., 2016, 18(2), 1125–1130 RSC.
- Y. Wang, M. Hu, D. Ai, H. Zhang, Z. H. Huang, R. Lv and F. Kang, Nanomaterials, 2019, 9(5), 752 CrossRef CAS PubMed.
- J. Wu, T. Deng, Q. Wu, Y. Qiu, Y. Wei, Q. Zhao and Y. Zhang, Appl. Mater. Today, 2023, 32, 101826 CrossRef.
- S. Pan, X. Liu and X. Wang, Mater. Charact., 2011, 62(11), 1094–1101 CrossRef CAS.
- A. U. Khan, A. Arooj, K. Tahir, M. M. Ibrahim, V. Jevtovic, H. A. AL-Abdulkarim, E. A. Saleh, H. S. Al-Shehri, M. A. Amin and B. Li, J. Mol. Struct., 2022, 1251, 131991 CrossRef CAS.
- A. Badawi, N. Y. Mostafa, N. M. Al-Hosiny, A. Merazga, A. M. Albaradi, F. Abdel-Wahab and A. A. Atta, Mod. Phys. Lett. B, 2018, 32(16), 1850172 CrossRef CAS.
- L. Velasco Davoise, A. M. Díez-Pascual and R. Peña Capilla, Materials, 2022, 15(3), 1171 CrossRef CAS PubMed.
- X. Wu, Y. Xie, C. Xue, K. Chen, X. Yang and L. Xu, Mater. Res. Express, 2019, 6(7), 075306 CrossRef CAS.
- E. Sujiono, H. Zurnansyah, D. Zabrian, M. Y. Dahlan, B. D. Amin and J. Samnur Agus, Heliyon, 2020, 6(8), 04568 CrossRef PubMed.
- M. J. Yoo and H. B. Park, Carbon, 2019, 141, 515–522 CrossRef CAS.
- S. Fahad, L. Wang, J. Liu, S. Li, J. Fu, B. U. Amin, R. U. Khan, S. Mehmood, F. Haq, W. Nan and M. Usman, Mater. Chem. Phys., 2021, 267, 124643 CrossRef CAS.
- M. Muradov, M. B. Baghirov, G. Eyvazova, L. Gahramanli, S. Mammadyarova, G. Aliyeva and M. Abdullayev, Radiat. Phys. Chem., 2023, 208, 110926 CrossRef CAS.
- J. Lu, D. Liu and J. Dai, J. Mater. Sci.: Mater. Electron., 2019, 30(16), 15786–15794 CrossRef CAS.
- I. O. Faniyi, O. Fasakin, B. Olofinjana, A. S. Adekunle, T. V. Oluwasusi, M. A. Eleruja and E. O. B. Ajayi, SN Appl. Sci., 2019, 1, 1–7 Search PubMed.
- S. Gurunathan, J. Hyun Park, Y. J. Choi, J. Woong Han and J. H. Kim, Curr. Nanosci., 2016, 12(6), 762–773 CrossRef CAS.
- K. Jyoti, M. Baunthiyal and A. Singh, J. Radiat. Res. Appl. Sci., 2016, 9(3), 217–227 CAS.
- S. Fahad, H. Yu, L. Wang, A. Nazir, R. S. Ullah, K. U. R. Naveed and S. Mehmood, J. Mater. Sci.: Mater. Electron., 2019, 30, 12876–12887 CrossRef CAS.
- S. Banerjee, B. Show, A. Kundu, J. Ganguly, U. Gangopadhyay, H. Saha and N. Mukherjee, J. Ind. Eng. Chem., 2016, 40, 54–61 CrossRef CAS.
- Y. Ma, Y. Ye, H. Wan, L. Chen, H. Zhou and J. Chen, Tribol. Lett., 2019, 67, 1–11 CrossRef CAS.
- N. M. S. Hidayah, et al., AIP Conference Proceedings, AIP Publishing, 2017, vol. 1892, 1 Search PubMed.
- Y. Jiang, Y. Lu, D. Han, Q. Zhang and L. Niu, Nanotechnology, 2012, 23(10), 105609 CrossRef PubMed.
- R. Zamiri, H. Abbastabar Ahangar, A. Zakaria, G. Zamiri, M. Shabani, B. Singh and J. M. F. Ferreira, Chem. Cent. J., 2015, 9(1), 1–6 CrossRef CAS PubMed.
| This journal is © The Royal Society of Chemistry 2024 |

