 Open Access Article
Utilization of polyphenylene sulfide as an organic additive to enhance gas separation performance in polysulfone membranes
Afdhal Junaidia,
Utari Zulfiania,
Siti Khomariyaha,
Triyanda Gunawan a,
Nurul Widiastuti
 *a,
Norazlianie Sazali†
 b and
Wan Norharyati Wan Sallehcd
aDepartment of Chemistry, Faculty of Science and Data Analytics, Institut Teknologi Sepuluh Nopember, Sukolilo, Surabaya 60111, Indonesia. E-mail: nurul_widiastuti@chem.its.ac.id
bCentre of Excellence for Advanced Research in Fluid Flow (CARIFF), Universiti Malaysia Pahang Al-Sultan Abdullah, Lebuhraya Tun Razak, Gambang, 26300, Kuantan, Pahang, Malaysia
cAdvanced Membrane Technology Research Centre (AMTEC), Universiti Teknologi Malaysia, 81310, Skudai, Johor Darul Takzim, Malaysia
dFaculty of Chemical and Energy Engineering, Universiti Teknologi Malaysia, 81310, Skudai, Johor, Malaysia
First published on 11th January 2024
Abstract
Many studies have shown that sulfur-containing compounds significantly affect the solubility of carbon dioxide (CO2) in adsorption processes. However, limited attention has been devoted to incorporating organic fillers containing sulfur atoms into gas separation membrane matrices. This study addressed the gap by developing a new membrane using a polysulfone (PSf) polymer matrix and polyphenylene sulfide (PPs) filler material. This membrane could be used to separate mixtures of H2/CH4 and CO2/CH4 gases. Our study investigated the impact of various PPs loadings (1%, 5%, and 10% w/w) relative to PSf on membrane properties and gas separation efficiency. Comprehensive characterization techniques, including Fourier-transform infrared spectroscopy (FTIR), X-ray diffraction (XRD), and scanning electron microscopy (SEM), were employed to understand how adding PPs and coating with polydimethylsiloxane (PDMS) changed the structure of our membranes. XRD and FTIR analysis revealed distinct morphological disparities and functional groups between pure PSf and PSf/PPs composite membranes. SEM results show an even distribution of PPs on the membrane surface. The impact of adding PPs on gas separation was significant. CO2 permeability increased by 376.19%, and H2 permeability improved by 191.25%. The membrane's gas selection ability significantly improved after coating the surface with PDMS. CO2/CH4 separation increased by 255.06% and H2/CH4 separation by 179.44%. We also considered the Findex to assess the overall performance of the membrane. The 5% and 10% PPs membranes were exceptional. Adding PPs to membrane technology may greatly enhance gas separation processes.
1 Introduction
The probability of greenhouse gas production will rise as a result of increasing human activities, such as increased productivity and varieties of industry, transportation, which promotes the rapid use of fossil fuels, and some industrial waste disposal.1,2 The biggest contributions, based on concentration and impact, are carbon dioxide (CO2) and methane (CH4) gas, with the gas content continuing to rise and increasing the global surface temperature by 0.6 °C in 2022. This is due to the fact that the CO2 concentration is 417 ppm, while CH4 gas concentration is 1900 ppb.3 Despite having a far lower concentration than carbon dioxide, methane gas is 84 times more harmful than carbon dioxide gas in terms of its effects.4 Natural gas, syngas, and biogas are the sources of CO2 and CH4 mixtures.5–7 Reducing CO2 gas is important for decreasing acidity, improving gas quality, and increasing energy density.8,9 CO2 has no heat value, which is 0 kJ m−3,10 while CH4 has a higher energy content with a lower heating value (LHV) up to 32![[thin space (1/6-em)]](https://www.rsc.org/images/entities/char_2009.gif) 500 kJ m−3.11
500 kJ m−3.11
In addition to CH4 gas, hydrogen (H2) is being used as a zero-emission energy source. As an example, Indonesia plans to decrease emissions by 29% by 2030 and achieve net-zero emissions by 2060. Green hydrogen is a component of the nation's goal.12 Green hydrogen is important for Indonesia's shift to clean energy and a sustainable economy.13 Separating H2 gas from CH4 is essential for producing hydrogen from natural gas using steam-methane reforming. This process is well-established and widely used for hydrogen production.14 Due to this phenomenon, research has been conducted into the separation of CO2/CH4 and H2/CH4 gases to enhance the separation and utilization of high-purity gases.15,16
The gas separation method aims to achieve high-purity gas separation with cost-effective operations and efficient energy utilization. Cryogenic distillation can separate gas contents up to 95%, while the adsorption method has an efficiency of 85%.17,18 Cryogenic distillation requires cooling, heating, and a large distillation system, resulting in high operational costs and energy consumption of 4 to 6 gigajoules per ton of CO2. High energy consumption for gas separation is inefficient and contributes to global warming. Therefore, membrane separation is the preferred research method.19 Gas separation membranes are more energy-efficient than previous techniques, using 25–60% less energy. They are also easy to set up and can be used on a large scale without requiring large systems.20
Polymer membranes are favored due to their ease of production, cost-effectiveness, and efficient separation capabilities, as stated in the material.21 In polymer membranes, separation performance depends on permeability and selectivity.22 Gas permeation refers to the process of penetration of molecules through a membrane involving sorption and diffusion processes,23 while selectivity refers to its ability to separate gas mixtures into purer forms. Polysulfone (PSf) is a commonly used polymer material due to its affordable cost and effective separation capabilities. Multiple studies have examined the separation of CO2/CH4 and H2/CH4 gases, but this membrane still suffers from the separation trade off, which lies below the Robeson curve.24
Many studies report the use of inorganic materials as PSf fillers to improve the separation performance.25–27 However, employing inorganic filler is challenging due to the incompatibility issue which lead into surface defect and affecting the separation performance.28 Porous organic materials have potential to be used as membrane filler and can solve the compatibility issues. One of the potential candidates is sulfide base organic fillers. The sulfur functional groups could promote H2 and CO2 solubility in the membrane through polar interaction.29,30 Moreover, sulfur in an aromatic structure can significantly increase CO2 affinity via acid–base interaction.31 One of the sulfide based organic filler is polyphenylene sulfide (PPs). It has great mechanical properties, outstanding resistance to high temperatures, amazing stability in a variety of environmental conditions, and resilience to environments that are both strongly alkaline and acidic due to their structural arrangement.32–34
Bai et al. (2023) reported the use of PPs as carbon precursors for CO2 capture. The result showed that adding sulfur species to carbon-based materials enhanced the CO2 uptake from 0.69 to 5.13 mmol g−1,35 and Sun et al. (2018) found that S-doped carbon spheres have CO2 uptake up to 4.27 mmol g−1 (ref. 36) and Jin et al. (2018) found that N- and S-doped porous carbon have CO2 uptake up to 4.55 mmol g−1.37 On the other hand, Xia et al. (2012) found that S-doped microporous carbons have H2 uptake of 2.02 wt%30 and Brewster et al. also found microporous carbon/sulfur nanocomposite have H2 uptake of up to 2.05 wt%.38 Those studies collectively affirm the superior CO2 adsorption performance of sulfur-containing materials. The phenomenon is caused by the interaction between sulfur atoms with CO2 through physical and chemical, resulting in a strong adsorption effect.39 High CO2 attraction toward PPs could be beneficial to the separation process as it will drive high gas solubility resulting into high permeability of membrane. However, to the best of our knowledge, there is limited literature reporting the use of PPs as filler in PSf matrix for gas separation. Therefore, this research aims to study the incorporation of PPs filler into PSf matrix for CO2 and H2 separation. In this study focused on creating a PSf/PPs membrane with different PPs concentrations (1, 5, and 10% w/w) to improve the separation of CO2/CH4 and H2/CH4 gases while investigating the membrane's structural and morphological changes.
2 Experimental and materials
2.1 Materials
The materials used in the research were polysulfone (Udel® PSf), n-methyl-2-pyrrolidone (NMP, Merck), technical ethanol (purity 96%), poly(1,4-phenylene sulfide) (PPs, Sigma-Aldrich), polydimethylsiloxane (PDMS), and ultrahigh purity H2, CH4, and CO2 gases with a purity of 99.999% (PT. Samator Gas Industri).2.2 Fabrication of PSf/PPs membranes and surface modification
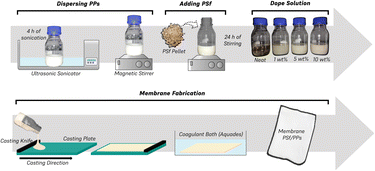
Polysulfone membranes were prepared using PSf polymer material and NMP solvent. PPs filler material is added with variations of 1%, 5%, and 10% by weight per total PSf polymer used. Fig. 1 depicts the preparation of the PSf/PPs membrane and Table 1 shows the composition of all the membrane variations. The preparation of the PSf membrane dope solution begins with drying the PSf pellets in an oven for 24 hours. The PSf pellets were then added little by little into the NMP solvent and stirred using a digital overhead stirrer with a stirring speed of 420 rpm for 24 hours. The solution was then sonicated for 4 hours and allowed to stand for 24 hours. Meanwhile, the preparation of the PSf/PPs membrane dope solution begins by dispersing the PPs in the NMP solvent with a sonication process for 4 hours. Then the PSf pellets were added with the same treatment as the pure PSf membrane dope solution preparation.| Membrane | PSf (%) | PPs (%) | PDMS coating (Y/N) |
|---|---|---|---|
| M | 22 | 0 | N |
| M1 | 22 | 1 | N |
| M2 | 22 | 5 | N |
| M3 | 22 | 10 | N |
| Ms | 22 | 0 | Y |
| M1s | 22 | 1 | Y |
| M2s | 22 | 5 | Y |
| M3s | 22 | 10 | Y |
Fabrication of flat-sheet PSf/PPs membranes was carried out using the non-solvent-induced phase separation (NIPS) phase inversion method. The prepared membrane dope solution is poured onto a glass plate that has been cleaned with ethanol. The membrane was placed in a coagulation bath containing distilled water and soaked for 24 hours. Post-fabrication treatment of the polymer membrane begins with further soaking of the membrane in ethanol for 6 hours to remove residual solvent. Immersion is done immediately after the membrane fabrication process has been completed. The membranes were then dried in the open air for 24 hours. Membrane surface modification was coated with PDMS at a concentration of 3% w/w by spray coating evenly. The PDMS layer was then irradiated under a 365 nm UV lamp for 20–30 seconds.
2.3 Membrane characterizations
FTIR spectroscopy, specifically the Thermo Scientific Nicolet iS10 instrument, was used to find out what kinds of functional groups were in the membranes that were made. The process of sample preparation entails dividing the membrane into smaller sections measuring 1 cm in both length and width. Subsequently, the prepared sample is positioned on the holder and subjected to analysis using infrared light within the wavenumber range of 400–4000 cm−1.A scanning electron microscope (SEM) with an energy dispersion X-ray (Zeiss Evo MA 10) was used to look at the shape of the membrane's cross-sectional area and its surface. To obtain a smooth cross-section of the surface for cross-section imaging, the membranes were cut in a liquid nitrogen environment. Subsequently, a deposition of gold was applied to the membranes, resulting in the formation of a thin layer. These gold-coated membranes were then introduced into the specimen chamber to facilitate the examination and evaluation of their morphological characteristics.
X-ray diffraction (XRD) analysis was done with the X'Pert PRO PANalytical to look at the crystalline structure of the membrane and PPs. The sample preparation for X-ray diffraction (XRD) involved placing the membrane and PPs powder in a sample holder and exposing them to X-ray radiation. XRD analysis made it easier to look at the crystallographic properties of the membrane and material, such as the composition of the crystal phase, the size of the crystals, and their preferred orientation. This technique yielded insights into the material's structural properties and verified the existence of any crystalline phases in the membrane. The results of the XRD analysis were used to figure out how crystalline the sample's PSf and PPs were, which is important for understanding its mechanical and thermal properties. This characterization technique facilitated a comprehensive comprehension of the structural attributes of the material, eliminating the necessity for microscopy or sample deposition procedures.
2.4 Gas permeation test
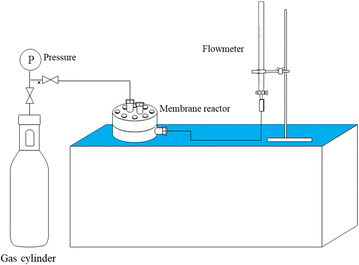
The gas permeation test on the membrane is carried out using a pure gas permeation test reactor. The test is carried out using constant gas pressure. The volumetric flow rate of permeate gas is measured using a bubble flowmeter mounted on a membrane permeation test. Fig. 2 displays a selection of gas permeation testing instruments.The flat sheet membrane of PSf/PPs is cut in a circle with a diameter of ±5.2 cm and mounted on a gas permeation test reactor. The test was carried out by passing CO2, H2, and CH4 gases through a gas permeation test reactor that had been connected to a bubble flowmeter. Gas pressure is set at 1 bar at room temperature. The time taken by a gas to pass through a certain volume on a bubble flowmeter is measured and recorded. The time data obtained can be used to calculate the permeation rate and selectivity of gases on the membrane using the following equation:
 | (1) |
 | (2) |
3 Result and discussion
3.1 Fabrication membrane PSf/PPs
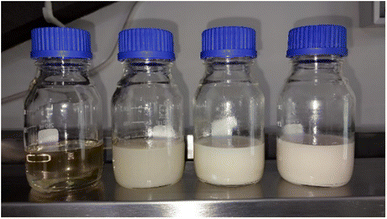
The goal of the study is to find out how different PPs filler materials affect the structure, shape, and ability of the PSf membrane to separate gas. To add PPs to PSf, disperse the PPs in NMP solvent using sonication for 4 hours. The goal is to optimize the mixing of PSf polymer and PPs filler material. The PSf polymer solution was gradually added to the PPs solution and stirred at 420 rpm for 24 hours using a digital overhead stirrer. The solution is sonicated to remove microbubbles in the dope solution. Increasing the concentration of PPs loaded results in a whiter dope solution (Fig. 3).The PSf/PPs membranes were fabricated using the non-solvent-induced phase inversion (NIPS) technique. The procedure involves preparing a polymer solution and subsequently submerging it in a non-solvent bath. When the solution-soaked substrate is put in the bath, the non-solvent in the bath takes the place of the solvent in our polymer solution. The solvent exchange results in the membrane separating into two layers: a compact upper layer and a permeable lower layer.40 The phase inversion process yields a three-dimensional structure comprising a mixture of two phases. It is assumed that the diffusion rates of the solvent and non-solvent are equal, simplifying the flow within the film as a one-dimensional diffusion process.41
Membranes produced via non-solvent-induced phase inversion typically have a sublayer thickness of 20–50 m on a 200 nm-thick thin film.22 Subsequently, the membrane is submerged in a coagulation bath composed of water and allowed to soak for 24 hours. This step improves the phase inversion process. The membrane is immersed in ethanol for 6 hours after fabrication to eliminate residual solvent and facilitate the relaxation of polymer chains. Relaxation enhances membrane permeability.42 The membrane is subsequently dried for 24 hours to remove any residual ethanol.
To optimize the membrane's characteristics, we apply a PDMS solution to it through the spray coating technique. Afterward, it is exposed to UV light for a duration of 20–30 seconds and allowed to dry outdoors. The PDMS coating is applied to fill any remaining open pores in the membrane, resulting in a defect-free and uniformly smooth top surface without small holes or abrasions.43,44 Incorporating PDMS has been shown to enhance the efficacy of polysulfone membranes.45
3.2 FTIR analysis
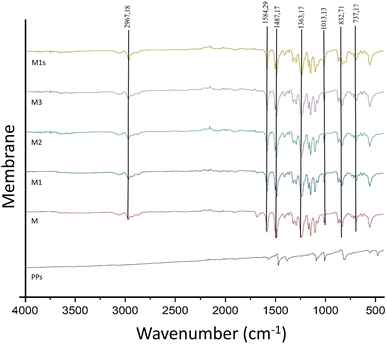
An FTIR instrument was used to look at the PSf and PSf/PPs membranes as well as pure PPs to find out what functional groups were in the membranes that were made. The absorption peaks observed at 807.5, 1007.98, 1091.08, 1383.94, 1470.27, and 1569.62 cm−1 in Fig. 4 are characteristic of pure PPs, as reported by ref. 33. The PSf membrane in this study exhibits a peak at 2967.18 cm−1, indicating the presence of both asymmetric and symmetric C–H stretching vibrations. The presence of C![[double bond, length as m-dash]](https://www.rsc.org/images/entities/char_e001.gif) C bonds in the repeating chains of polymers is indicated by absorption peaks at 1503.87 and 1584.29 cm−1. The peak observed at 1363.73 cm−1 signifies the existence of both asymmetric and symmetric C–H bending deformations within the methyl group. The peak observed at a wavelength of 1406.85 cm−1 corresponds to the aromatic stretching vibrations of polysulfone. The peak observed at 1238.90−1 indicates the presence of asymmetric C–O–C stretching in the aryl ether group. The presence of strain in the asymmetric sulfonate group O
C bonds in the repeating chains of polymers is indicated by absorption peaks at 1503.87 and 1584.29 cm−1. The peak observed at 1363.73 cm−1 signifies the existence of both asymmetric and symmetric C–H bending deformations within the methyl group. The peak observed at a wavelength of 1406.85 cm−1 corresponds to the aromatic stretching vibrations of polysulfone. The peak observed at 1238.90−1 indicates the presence of asymmetric C–O–C stretching in the aryl ether group. The presence of strain in the asymmetric sulfonate group O![[double bond, length as m-dash]](https://www.rsc.org/images/entities/char_e001.gif) S
S![[double bond, length as m-dash]](https://www.rsc.org/images/entities/char_e001.gif) O is indicated by peaks observed at 1168.69 and 1149.13 cm−1. The presence of an amine strain is indicated by the peak observed at 1004.65 cm−1. The subsequent peaks observed at 852.96, 832.71, 715.14, and 690.80 cm−1 suggest the existence of a substitution band on the phenyl ring. The PSf membrane fabricated in this study is consistent with the findings of Farrokhara and Dorosti,46 who observed C
O is indicated by peaks observed at 1168.69 and 1149.13 cm−1. The presence of an amine strain is indicated by the peak observed at 1004.65 cm−1. The subsequent peaks observed at 852.96, 832.71, 715.14, and 690.80 cm−1 suggest the existence of a substitution band on the phenyl ring. The PSf membrane fabricated in this study is consistent with the findings of Farrokhara and Dorosti,46 who observed C![[double bond, length as m-dash]](https://www.rsc.org/images/entities/char_e001.gif) C bond strain at 11
C bond strain at 11![[thin space (1/6-em)]](https://www.rsc.org/images/entities/char_2009.gif) 475 and 1600 cm−1. The C–H aromatic strain is observed at a wavelength of 3000 cm−1. The S
475 and 1600 cm−1. The C–H aromatic strain is observed at a wavelength of 3000 cm−1. The S![[double bond, length as m-dash]](https://www.rsc.org/images/entities/char_e001.gif) O band in the sulfone functional group exhibits symmetrical and asymmetric vibrations at wavenumbers of 1236 and 1150 cm−1, respectively. Simultaneously, the presence of asymmetric C–O vibrations is observed at wavelengths of 1000 and 1315 cm−1.
O band in the sulfone functional group exhibits symmetrical and asymmetric vibrations at wavenumbers of 1236 and 1150 cm−1, respectively. Simultaneously, the presence of asymmetric C–O vibrations is observed at wavelengths of 1000 and 1315 cm−1.
The FTIR spectra confirm the successful coating of a PDMS selective layer on a polysulfone substrate, as evidenced by the detection of characteristic PDMS peaks. Peaks observed at 1013.13 and 1080.44 cm−1 suggest the existence of Si–O–Si stretching. The Si–CH3 molecule exhibits an asymmetric methyl strain, which is characterized by sharp bending peaks at 2964.15 and 1239.37 cm−1. The Si–C stretching peak is observed at 737.17 cm−1. No peak at 1673 cm−1 was observed in the entire membrane, indicating the absence of a stretching of H-bound C![[double bond, length as m-dash]](https://www.rsc.org/images/entities/char_e001.gif) O. Hu, et al. confirmed the absence of NMP solvent in the membrane.45 In PSf/PPs membranes, the presence of PPs cannot be detected using FTIR due to the structural similarity between PPs and polysulfone. The characteristic peak of PPs at 1363.62, 1486.99, and 1584.45 cm−1 was observed in all membranes due to the structural similarity between PPs and PSf. Consequently, the functional group of PPs present in the PSf/PPs membrane is also found in the PSf functional group. Further characterization is necessary to establish the presence of PPs.
O. Hu, et al. confirmed the absence of NMP solvent in the membrane.45 In PSf/PPs membranes, the presence of PPs cannot be detected using FTIR due to the structural similarity between PPs and polysulfone. The characteristic peak of PPs at 1363.62, 1486.99, and 1584.45 cm−1 was observed in all membranes due to the structural similarity between PPs and PSf. Consequently, the functional group of PPs present in the PSf/PPs membrane is also found in the PSf functional group. Further characterization is necessary to establish the presence of PPs.
3.3 XRD analysis
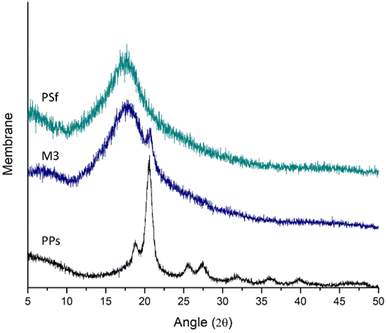
X-ray diffraction analysis can tell how pure crystalline compounds are in polymers by finding the most prominent diffraction peaks.47 The analysis mentioned above can verify the presence of filler in the matrix membrane, as shown in Fig. 5. The X-ray diffraction pattern of the PSf membrane shows a peak position at an angle of 17.71 degrees, while the PPs peak position is observed at 20.56 degrees. The observed peak positions in both samples are consistent with the findings reported in the literature.27,48 Upon examination of the M3 membrane, which contains PPs 10% (w/w) relative to the PSf membrane, two distinct peaks are observed. These peaks correspond to the pure PSf and PPs, with peak values of 17.71 and 20.75, respectively. The observed peak of the PPs sample exhibits a minor deviation from the expected pure PPs peak, which can be attributed to a discernible disparity in grain or particle size,49 crystallinity, and defects are just a few variables that can affect the X-ray diffraction (XRD) patterns of PPs. These factors primarily manifest in the form of a broadening of diffraction peaks.3.4 Membrane morphology
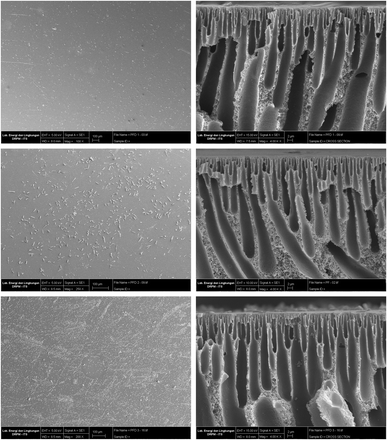
Scanning electron microscopy (SEM) instruments were employed to examine the effects of incorporating PPs particles on the surface morphology and cross-section of PSf neat and PSf/PPs membranes. Fig. 6 illustrates that the PDMS-coated PSf material displays enhanced surface smoothness, decreased occurrence of defects, and a lack of voids. On the other hand, the surface of uncoated pure PSf displays irregularities and spots. Voids and defects on the membrane surface can arise due to poor polymer-particle surface compatibility or because of stress and force during membrane fabrication. Polymers with a glossy surface, like polysulfone, often undergo increased stress during solvent exchange, leading to shrinkage on the top layer of the membrane surface.50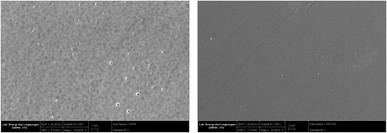 | ||
| Fig. 6 SEM surface results on membranes PSf without PDMS coating (left) and PSf with PDMS coating (right). | ||
The results of the fabrication membrane PSf/PPs surface and cross-section are depicted in Fig. 7. This illustrates the surface SEM characterization results, indicating that the PPs loaded into the polysulfone membrane exhibit uniform distribution and possess a smooth top surface without any defects. The occurrence of this phenomenon is attributed to the compatibility between PPs and PSf, resulting in the optimization of gas transport properties.51 The rise in PPs concentration is directly proportional to the surface's particle count.
The cross-sectional scanning electron microscopy (SEM) image the PSf membrane used in this study is consistent with previous reports in the literature. The image illustrates that the dense layer consists of vertical channels that are densely packed and have a higher proportion of free volume. The skin layer is thin and dense, and it is supported by a porous sublayer structure. The sublayer structure contains large finger-like cavities and traces of sponge-like structures.52 The formation of this surface layer is attributed to the introduction of volatile solvents into the polymer solution. Diffusion occurs during the phase inversion process, facilitating the exchange of solvents and nonsolvent. During this process, the NMP solvent undergoes separation from the membrane, resulting in the formation of a sublayer. The micropore area's spongy appearance is linked to the membrane being immersed in ethanol during the post-printing treatment process.53 The loading of many PPs into a membrane leads to the formation of a finger-like structure known as a “microcavity”. This leads to structural defects in the membrane, altering its gas selectivity.
3.5 Gas separation performance
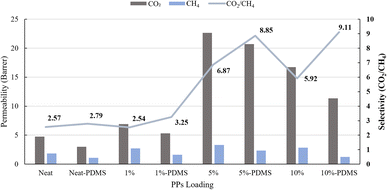
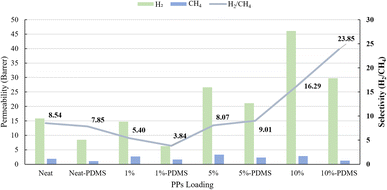
Gas separation performances were evaluated using the bubble flow method to determine the permeability of each gas. This analysis yielded selectivity values for CO2/CH4 and H2/CH4. The overall results are shown in Fig. 8 and 9. The addition of PPs to CH4 gas did not result in a significant increase in permeability when compared to CO2 and H2 gases. The permeability of CO2 gas reaches its maximum increase at M2, with a permeability of 22.63 barrer, representing a 376.2% rise compared to membrane M.The observed outcome is attributed to the significant interaction between the sulfur atom and CO2 gas, facilitated by chemical interaction.30,39 Furthermore, the results suggest that the presence of the S group plays a significant role in the initial process of CO2 adsorption. In pursuit of demonstrating enhanced CO2 adsorption capabilities, it is noteworthy that sulfur-functionalized groups, including sulfide, exhibit a pronounced affinity for CO2 through polar interaction. The polar interactions between the CO2 molecule's quadrupole moment and the polar sites related to the S function.29,54 Furthermore, the sulfur atom in aromatic rings, as observed in PPs structures, contributes to an increased CO2 adsorption capacity through acid–base interactions within micropores.31
At M3, the concentration of H2 gas exhibited a maximum value of 191.25%. The study noted that the inclusion of sulfur in the form of a carbon–sulfur bond additionally augments the absorption of hydrogen gas, owing to the heightened polarity and subsequent interaction between hydrogen molecules and the polarized surface.30,55 This observation is supported by previous theoretical research indicating that the inclusion of heteroatoms into the carbon network can greatly enhance the capacity for hydrogen storage.56
Membrane selectivity increases and permeability decreases when PDMS is used to modify the surface. When PDMS is added to PSf and PSf/PPs membranes, it significantly reduces the flow of H2 and CO2, with CH4 being the most affected. To ensure membrane longevity and dependability in gas separation applications, PDMS coating fills pores, improves surface integrity, and guards against flaws.45,57
The performance of the PSf/PPs membrane and the PSf membrane with inorganic filler in terms of gas separation was compared in Table 2. The PSf/PPs membrane appears more effective because it is straightforward and simple to utilize. While it may not achieve its absolute peak performance levels, it remains competitively effective. In contrast, incorporating inorganic materials involves multi-stage processes including synthesis (ZIF-8, ZTC), functionalization (zeolite RHO), and carbonization (ZTC, CF, and CNTs). To reveal the potential and standing of the PSf/PPs membrane, it's necessary to conduct additional investigation. This can be accomplished using Findex.
| Membrane | Parameter | Permeability (barrer) | Ideal selectivity | Ref. | ||||
|---|---|---|---|---|---|---|---|---|
| P (bar) | T (°C) | H2 | CO2 | CH4 | CO2/CH4 | H2/CH4 | ||
| Neat PSf | 1 | 25 | 15.81 | 4.75 | 1.85 | 2.57 | 8.54 | This work |
| PSf/PPs 5.0 wt% | 1 | 25 | 21.09 | 20.71 | 2.34 | 8.85 | 9.01 | This work |
| PSf/PPs 10 wt% | 1 | 25 | 29.74 | 11.35 | 1.24 | 9.11 | 23.85 | This work |
| PSf 100/CF | 1 | 20 | 2.0 × 10⁷ | 5.9 × 10⁶ | 9.4 × 10⁶ | 0.63 | 2.13 | Mohamed et al.58 |
| PSf 200/CF | 1 | 20 | 1.35 × 10⁷ | 4.8 × 10⁶ | 8.0 × 10⁶ | 0.60 | 1.69 | |
| PSf/PEG–g CNTs 2.5 wt% | 1.5 | 25 | — | 8.05 | 0.97 | 8.3 | — | Singh et al.59 |
| PSf/PEG–g CNTs 7 wt% | 1.5 | 25 | — | 6.5 | 0.73 | 8.9 | — | |
| PSf/zeolite RHO 1.0 wt% | 4 | 25 | — | 3.23 | 0.13 | 25.37 | — | Anbealagan et al.60 |
| PSf/zeolite RHO 5.0 wt% | 4 | 25 | — | 5.07 | 0.27 | 18.56 | — | |
| PSf/ZIF-8 10 wt% | 4 | 30 | 87.00 | 36.60 | 1.38 | 27.72 | 63.04 | Mei et al.61 |
| PSf/ZIF-8 15 wt% | 4 | 30 | 45.32 | 19.88 | 1.12 | 17.75 | 40.46 | |
| PSf/ZTC 0.4 wt% | 5 | 25 | 169.2 | 58.53 | 5.86 | 9.99 | 28.88 | Wijiyanti et al.62 |
| PSf/ZTC 0.4 wt% (coated) | 5 | 25 | 116.49 | 51.51 | 1.66 | 30.98 | 70.07 | |
3.6 Findex
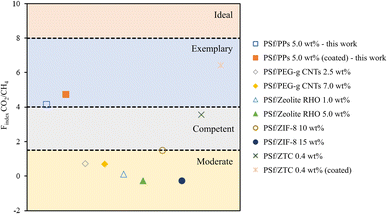
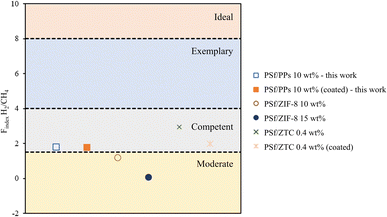
Different studies have used permeability and selectivity enhancement diagrams to show how well mixed matrix membranes (MMMs) separate things compared to an empty matrix, shown as a ratio or percentage. This method offers a simple means to modulate the polymer matrix effect, thereby demonstrating the beneficial impact of fillers on separation quality. The separation performances' absolute values are still uncertain.63 A new benchmark, known as the filler enhancement index (Findex), is suggested to integrate the Robeson upper limit and permeability/selectivity improvement diagrams. This criterion evaluates the impact of fillers on membrane separation performance, independent of the properties of the host polymer. The method does not consider factors such as polymer filler compatibility, adverse morphology in the membrane, plasticization, or physical ageing.45 The equation for the Findex can be expressed as:
 | (3) |
Fig. 10 generally demonstrates that the Findex value of CO2/CH4 for the PSf/PPs 5 wt% membrane can significantly affect the effectiveness of material separation compared to other membranes. On the other hand, PSf/PPs coated with PDMS can further improve separation ability. Meanwhile, Fig. 11 shows the Findex H2/CH4 for the PSf/PPs 10 wt% membrane can only reach the level of competence. As well as the PSf membranes using the inorganic filler ZTC. Overall, membranes with PPs organic fillers can compete with membranes with other inorganic fillers and prove that the addition of PPs provides compatibility for the separation of CO2/CH4 and H2/CH4.
4 Conclusions
In summary, this research investigated the utilization of PPs as an additive in PSf membranes with the aim of enhancing the effectiveness of CO2/CH4 and H2/CH4 separation processes. As the PPs concentration increased, CO2 and H2 permeability increased. This finding demonstrates that the presence of the sulfide functional group can enhance the permeability of CO2 gas by means of acid–base interactions. In addition to this, it has the potential to enhance the permeability of H2. Specifically, the concentration of 5 wt% PPs led to a notable increase in CO2 permeability of 376.19%, while 10 wt% PPs elevated H2 permeability by 191.25%. Furthermore, the CH4 gas's permeability remained stable. These findings have significant effects on the enhancement of ideal selectivity, enhancing CO2/CH4 to 9.11 and H2/CH4 to 23.85. Future research could unlock the full potential of sulfide-based organic materials in gas separation applications, making them a potential new filler material for membranes.Author contributions
Afdhal Junaidi: conceptualization, investigation, resources, methodology, and writing-original draft. Utari Zulfiani: review & editing. Siti Khomariyah: investigation, review & editing. Nurul Widiastuti: conceptualization, supervision, review & editing. Triyanda Gunawan: conceptualization, supervision, review & editing. Norazlianie Sazali: supervision, review & editing. Wan Norharyati Wan Salleh: resources and formal analysis.Conflicts of interest
There are no conflicts to declare.Acknowledgements
The authors would like to appreciate the research funding provided by the Ministry of Education and Culture Republic of Indonesia under Penelitian Magister Menuju Doktor Sarjana Unggul, contract number: 1249/PKS/ITS/2023.References
- P. G. Kougias and I. Angelidaki, Front. Environ. Sci. Eng., 2018, 12, 14 CrossRef.
- S. Achinas, V. Achinas and G. J. W. Euverink, Engineering, 2017, 3, 299–307 CrossRef.
- E. J. Dlugokencky, L. P. Steele, P. M. Lang and K. A. Masarie, J. Geophys. Res., 2022, 99, 17021–17043 Search PubMed.
- X. Li, X. Liu, K. Zhang, H. Luo, A. Pu, D. Zhuang, B. Jiang, M. Li, W. Chen, L. Fan, J. Qing, X. Zhang, F. Chen and X. Zhang, J. Environ. Manage., 2023, 325, 116444 CrossRef CAS.
- D. Q. Vu, W. J. Koros and S. J. Miller, Ind. Eng. Chem. Res., 2002, 41, 367–380 CrossRef CAS.
- M. S. Shah, P. K. Halder, A. S. M. Shamsuzzaman, M. S. Hossain, S. K. Pal and E. Sarker, J. Renew. Energy, 2017, 2017, 1–14 CrossRef.
- N. Muntaha, M. I. Rain, L. K. M. O. Goni, M. A. A. Shaikh, M. S. Jamal and M. Hossain, ACS Omega, 2022, 7, 33680–33698 CrossRef CAS PubMed.
- M. T. Kallo and M. J. Lennox, Langmuir, 2020, 36, 13591–13600 CrossRef CAS PubMed.
- B. Aghel, S. Behaein, S. Wongwises and M. S. Shadloo, Biomass Bioenergy, 2022, 160, 1–24 CrossRef.
- N. Khatri and K. K. Khatri, Int. J. Hydrogen Energy, 2020, 45, 7128–7140 CrossRef CAS.
- S. Chuayboon, S. Prasertsan, T. Theppaya, K. Maliwan and P. Prasertsan, Energy Procedia, 2014, 52, 659–665 CrossRef CAS.
- D. Gunawan, in Indonesia Post-Pandemic Outlook: Strategy towards Net-Zero Emissions by 2060 from the Renewables and Carbon-Neutral Energy Perspectives, Penerbit BRIN, 2022 Search PubMed.
- L. Huang, Z. Xing, X. Zhuang, J. Wei, Y. Ma, B. Wang, X. Jiang, X. He, L. Deng and Z. Dai, Sep. Purif. Technol., 2022, 297, 121504 CrossRef CAS.
- B. Parkinson, M. Tabatabaei, D. C. Upham, B. Ballinger, C. Greig, S. Smart and E. McFarland, Int. J. Hydrogen Energy, 2018, 43, 2540–2555 CrossRef CAS.
- N. Sazali, J. Mater. Sci., 2020, 55, 11052–11070 CrossRef CAS.
- C. Regmi, S. Ashtiani, Z. Hrdlička and K. Friess, Membranes, 2021, 11, 862 CrossRef CAS PubMed.
- L. K. G. Bhatta, S. Subramanyam, M. D. Chengala, S. Olivera and K. Venkatesh, J. Clean. Prod., 2015, 103, 171–196 CrossRef CAS.
- P. A. Webley, Adsorption, 2014, 20, 225–231 CrossRef CAS.
- J. K. Adewole, A. L. Ahmad, S. Ismail and C. P. Leo, Int. J. Greenhouse Gas Control, 2013, 17, 46–65 CrossRef CAS.
- P. S. Goh and A. F. Ismail, in Nanocomposite Membranes for Gas Separation, Elsevier, 2020, pp. 1–19 Search PubMed.
- N. Sazali, H. Ibrahim, A. S. Jamaludin, M. A. Mohamed, W. N. W. Salleh and M. N. Z. Abidin, IOP Conf. Ser.: Mater. Sci. Eng., 2020, 788, 012047 CAS.
- R. S. K. Valappil, N. Ghasem and M. Al-Marzouqi, J. Ind. Eng. Chem., 2021, 98, 103–129 CrossRef.
- N. Sazali, W. N. W. Salleh, A. F. Ismail and Y. Iwamoto, Int. J. Hydrogen Energy, 2021, 46, 24855–24863 CrossRef CAS.
- R. M. Almuhtaseb, A. Awadallah-F, S. A. Al-Muhtaseb and M. Khraisheh, Membranes, 2021, 11, 286 CrossRef CAS PubMed.
- N. A. H. M. Nordin, A. F. Ismail, A. Mustafa, R. S. Murali and T. Matsuura, RSC Adv., 2015, 5, 30206–30215 RSC.
- N. Widiastuti, I. S. Caralin, A. R. Widyanto, R. Wijiyanti, T. Gunawan, Z. A. Karim, M. Nomura and Y. Yoshida, R. Soc. Open Sci., 2022, 9(6), 1–19 CrossRef.
- D. Nasirian, I. Salahshoori, M. Sadeghi, N. Rashidi and M. Hassanzadeganroudsari, Polym. Bull., 2020, 77, 5529–5552 CrossRef CAS.
- K. K. Wong and Z. A. Jawad, J. Polym. Res., 2019, 26, 289 CrossRef CAS.
- H. Seema, K. C. Kemp, N. H. Le, S. W. Park, V. Chandra, J. W. Lee and K. S. Kim, Carbon, 2014, 66, 320–326 CrossRef CAS.
- Y. Xia, Y. Zhu and Y. Tang, Carbon, 2012, 50, 5543–5553 CrossRef CAS.
- M. Seredych, J. Jagiello and T. J. Bandosz, Carbon, 2014, 74, 207–217 CrossRef CAS.
- L. Gao, K. Su, T. Fan and Z. Li, Polymer, 2019, 176, 274–282 CrossRef CAS.
- G. Wang, J. Miao, X. Ma, C.-W. Lou, J.-H. Lin, Y.-Z. Long, S. Ramakrishna and T. Fan, Sep. Purif. Technol., 2022, 302, 122014 CrossRef CAS.
- X.-Y. Ma, T.-T. Fan, G. Wang, Z.-H. Li, J.-H. Lin and Y.-Z. Long, Compos. Commun., 2022, 29, 101017 CrossRef.
- J. Bai, J. Huang, Q. Jiang, W. Jiang, M. Demir, M. Kilic, B. N. Altay, L. Wang and X. Hu, Colloids Surf., A, 2023, 674, 131916 CrossRef CAS.
- Y. Sun, K. Li, J. Zhao, J. Wang, N. Tang, D. Zhang, T. Guan and Z. Jin, J. Colloid Interface Sci., 2018, 526, 174–183 CrossRef CAS.
- Z. E. Jin, J. L. Wang, R. J. Zhao, T. T. Guan, D. D. Zhang and K. X. Li, New Carbon Mater., 2018, 33, 392–401 CrossRef CAS.
- C. D. Brewster, L. R. Terry, H. V. Doan, S. Rochat and V. P. Ting, Energy Adv., 2023, 2, 398–409 RSC.
- X. Guo, G. Zhang, C. Wu, J. Liu, G. Li, Y. Zhao, Y. Wang and Y. Xu, J. Environ. Chem. Eng., 2021, 9, 105165 CrossRef CAS.
- X. Dong, A. Al-Jumaily and I. Escobar, Membranes, 2018, 8, 23 CrossRef.
- G. R. Guillen, Y. Pan, M. Li and E. M. V. Hoek, Ind. Eng. Chem. Res., 2011, 50, 3798–3817 CrossRef CAS.
- J. T. Jung, J. F. Kim, H. H. Wang, E. di Nicolo, E. Drioli and Y. M. Lee, J. Membr. Sci., 2016, 514, 250–263 CrossRef CAS.
- P. Natarajan, B. Sasikumar, S. Elakkiya, G. Arthanareeswaran, A. F. Ismail, W. Youravong and E. Yuliwati, J. Nat. Gas Sci. Eng., 2021, 86, 103720 CrossRef CAS.
- N. Widiastuti, T. Gunawan, H. Fansuri, W. N. W. Salleh, A. F. Ismail and N. Sazali, Membranes, 2020, 10, 267 CrossRef CAS.
- C.-C. Hu, C.-W. Lin, C.-P. Hu, D. L. Keshebo, S.-H. Huang, W.-S. Hung, K.-R. Lee and J.-Y. Lai, J. CO2 Util., 2022, 61, 102011 CrossRef CAS.
- M. Farrokhara and F. Dorosti, Chin. J. Chem. Eng., 2020, 28, 2301–2311 CrossRef CAS.
- S. M. Hassan, A. I. Ahmed and M. A. Mannaa, Colloids Surf., A, 2019, 577, 147–157 CrossRef CAS.
- A. M. Diez-Pascual, Manuf. Nanocomposites with Eng. Plast., 2015, pp. 127–165 Search PubMed.
- X. Di, L. Fang, Q. Lin, T. Zhang and X. Zhou, High Perform. Polym., 2014, 26, 97–105 CrossRef.
- A. F. Ismail, P. S. Goh, S. M. Sanip and M. Aziz, Sep. Purif. Technol., 2009, 70, 12–26 CrossRef CAS.
- S. Natarajan, H. C. Bajaj and R. J. Tayade, J. Environ. Sci., 2018, 65, 201–222 CrossRef CAS.
- C. L. Eden and M. O. Daramola, Mater. Today: Proc., 2021, 38, 522–527 CAS.
- A. K. Zulhairun and A. F. Ismail, J. Membr. Sci., 2014, 468, 20–30 CrossRef CAS.
- W. Kiciński, M. Szala and M. Bystrzejewski, Carbon, 2014, 68, 1–32 CrossRef.
- M. Sevilla, A. B. Fuertes and R. Mokaya, Int. J. Hydrogen Energy, 2011, 36, 15658–15663 CrossRef CAS.
- M. Sankaran and B. Viswanathan, Carbon, 2006, 44, 2816–2821 CrossRef CAS.
- G. Li, Z. Si, S. Yang, T. Xue, J. Baeyens and P. Qin, Chem. Eng. Sci., 2022, 253, 117588 CrossRef CAS.
- A. Mohamed, S. Yousef, S. Tuckute, A. Tonkonogovas and A. Stankevičius, Process Saf. Environ. Prot., 2023, 171, 630–639 CrossRef CAS.
- S. Singh, A. M. Varghese, K. S. K. Reddy, G. E. Romanos and G. N. Karanikolos, Ind. Eng. Chem. Res., 2021, 60, 11289–11308 CrossRef CAS.
- L. D. Anbealagan, T. Y. S. Ng, T. L. Chew, Y. F. Yeong, S. C. Low, Y. T. Ong, C.-D. Ho and Z. A. Jawad, Membranes, 2021, 11, 630 CrossRef CAS PubMed.
- X. Mei, S. Yang, P. Lu, Y. Zhang and J. Zhang, Front. Chem., 2020, 8, 1–10 CrossRef PubMed.
- R. Wijiyanti, A. N. Ubaidillah, T. Gunawan, Z. A. Karim, A. F. Ismail, S. Smart, R. Lin and N. Widiastuti, Chem. Eng. Res. Des., 2019, 150, 274–288 CrossRef CAS.
- F. Pazani, M. S. Maleh, M. Shariatifar, M. Jalaly, M. Sadrzadeh and M. Rezakazemi, Renew. Sustain. Energy Rev., 2022, 160, 112294 CrossRef CAS.
Footnote |
| † Present address: Faculty of Manufacturing and Mechatronic Engineering Technology, Universiti Malaysia Pahang, 26600 Pekan, Pahang, Malaysia. |
| This journal is © The Royal Society of Chemistry 2024 |

