 Open Access Article
Rifampicin adsorption and release study using Santa Barbara amorphous-16 modified Al (SBA-16-Al) for a drug delivery system
Maria Christina Prihatiningsih *a,
Chaidir Pratama
 d,
Noor Anis Kundaria,
Kartini Megasaria,
Dhita Ariyantia,
Andri Saputra
 b,
Hersandy Dayu Kusuma
 c and
Puji Astutia
aPolytechnic Institute of Nuclear Technology, National Research and Innovation Agency (BRIN), Yogyakarta, Indonesia. E-mail: maria.christina@polteknuklir.ac.id; mari003@brin.go.id
bDepartment of Rubber and Plastic Processing Technology, Politeknik ATK Yogyakarta, Indonesia
cDepartment of Chemistry, Faculty of Mathematics and Natural Sciences, Universitas Padjadjaran, Jl. Raya Bandung – Sumedang KM. 21 Jatinangor, Sumedang 45363, Indonesia
dResearch Center for Radioisotope, Radiopharmaceutical, and Biodosimetry Technology, Research Organization of Nuclear Energy, National Research and Innovation Agency (BRIN), Indonesia
First published on 1st March 2024
Abstract
In this study, the surface modification of Santa Barbara Amorphous-16 (SBA-16) with aluminum (SBA-16-Al) was carried out as a rifampicin matrix for the treatment of tuberculosis. Surface modification of SBA-16 was achieved using the direct-synthesis grafting method. Then, the adsorption and release properties of rifampicin from the SBA-16-Al matrix have been studied in batches. In addition, the SBA-16-Al has been characterized using Fourier-Transform Infrared Spectroscopy (FTIR), X-ray diffraction analysis (XRD), transmission electron microscopy (TEM), and Surface Area Analysis (SAA) Brunaur, Emmett and Teller (SAA-BET). The results show that the mesoporous material, the SBA-16-Al has a specific surface area of 843.5 m2 g−1 and 624.3 m2 g−1 for SBA-16, nanometer-sized pore diameters, and an amorphous crystal lattice. The FTIR spectra showed the Al–O bond at 802 cm−1 which indicates the Al group has been successfully added into SBA-16. The adsorption isotherm of rifampicin in SBA-16-Al follows the Freundlich model which illustrates the adsorption is heterogeneous and forms a multilayer. The adsorption of rifampicin is chemisorption which occurs non-spontaneously and is quite stable. The release kinetics of rifampicin in the drug delivery system followed the Higuchi model with k1 0.5472 mg 0.5/hour pH 1.5 and k2 mg 0.5/hour pH 6.5.
Introduction
Tuberculosis is one of the major public health problems and a challenge in public health issues in the world. In Indonesia, the mortality rate due to tuberculosis was 40 per 100![[thin space (1/6-em)]](https://www.rsc.org/images/entities/char_2009.gif) 000 population (without TBHIV) and 3.6 per 100
000 population (without TBHIV) and 3.6 per 100![[thin space (1/6-em)]](https://www.rsc.org/images/entities/char_2009.gif) 000 population (including TB-HIV) in 2017. Tuberculosis prevention initially used only the Bacillus Calmette–Guérin (BCG) vaccine.1 Then it developed with the discovery of anti-tuberculosis drugs such as Thiacetazone, para-aminosalicylic acid, Isoniazid (INH), Pyrazinamide (PZA), Cycloserine, Ethionamide, Ethambuthol, and Rifampicin. Currently, conventional Tuberculosis drugs are given to patients with high doses, long periods, and multiple drug administrations (2–3 times a week for 4–7 months).2 In the conventional drug delivery system, the drug will be released immediately after consumption. High drug solubility will accelerate the absorption of drugs in the body and immediateexcretion by the kidneys. Rapid excretion or rapid clearance time of a drug will cause the drug to not react completely and efficiently on the therapeutic object in the body. The durability, biocompatibility, and strong pH-dependent solubility are also other drawbacks of conventional drugs.3
000 population (including TB-HIV) in 2017. Tuberculosis prevention initially used only the Bacillus Calmette–Guérin (BCG) vaccine.1 Then it developed with the discovery of anti-tuberculosis drugs such as Thiacetazone, para-aminosalicylic acid, Isoniazid (INH), Pyrazinamide (PZA), Cycloserine, Ethionamide, Ethambuthol, and Rifampicin. Currently, conventional Tuberculosis drugs are given to patients with high doses, long periods, and multiple drug administrations (2–3 times a week for 4–7 months).2 In the conventional drug delivery system, the drug will be released immediately after consumption. High drug solubility will accelerate the absorption of drugs in the body and immediateexcretion by the kidneys. Rapid excretion or rapid clearance time of a drug will cause the drug to not react completely and efficiently on the therapeutic object in the body. The durability, biocompatibility, and strong pH-dependent solubility are also other drawbacks of conventional drugs.3
Nanomaterial-based medicine continues to be studied to overcome the problems of conventional medicine.4,5 Some types of nanomaterials that are often studied for drug delivery applications are mesoporous silica nanomaterials. Mesoporous silica nanomaterials are often also called ordered mesoporous molecular sieves.6 There are several types of mesoporous silica nanomaterials (MSN) such as the M41S family, namely (Mobil Composition of Matter No. 41, MCM-41), MCM-48, MCM-50,7–9 Santa Barbara Amorphous material group (SBA) at the University of California Santa Barbara,10 and KIT-6 (Korea Institute of Technology nanomaterials) is an MSN developed at the Korea Advanced Institute of Science and Technology. SBA-16 was synthesized in acidic conditions using a triblock copolymer or Pluronics F127 (EO106PO70EO106) as a structure-directing agent (SDA). The SBA-16 material has a regular cubic pore structure which is in the m3Im group.
The silica-based nanomaterials have unique shapes and morphologies that are thought to have specific advantages for oral drug delivery systems. The Food and Drug Administration (FDA) has granted synthetic amorph silica the generally recognized as safe (GRAS) status for its use as additives in both food and cosmetics.11–15 The ordered mesoporous silica materials such as MCM, SBA, and KIT are silica-based nanomaterials that have amorphous properties but have various superior properties as follows: very regular mesophase structure, uniform distribution of pores, high surface area, and pore volume (high surface area can reach 1000 m2 g−1 and pore volume can reach 1 cm3 g−1), the chemical composition that can be engineered, surface that can be modified, and pore size and morphology that can be controlled or customized. Previous research has been conducted to study the properties of the MSN nanostructures using small-angle X-ray scattering (SAXS) and one of the applications for radioactive drug delivery.16,17 From the SAXS characterization study on SBA-16-Al which was carried out previously, it was observed that the synthesized SBA-16-Al is an MSN that has pores in the uniform mesoporous order, a three-dimensional cubic Im3m structure, and has a high specific surface area, up to 1000 m2 g−1. Mesoporous silica nanomaterial with a high specific surface area and large pore volume will provide a high drug-loading capacity,18,19 thus lowering the frequency of drug administration. Colloidal silica-based treatment is also viewed favorably as it is more biocompatible, biodegradable, and stable.20,21
The Tuberculosis drug used in this study is rifampicin using mesoporous silica nanomaterial SBA-16 as the carrier or matrix. Rifampicin is a widely used anti-tuberculosis drug.12 For SBA-16 to adsorb rifampicin particulates chemically, it is necessary to modify its surface. Surface modification of mesoporous silica with specific groups to control adsorption (loading) and control drug release has been studied by previous researchers.12,22,23 However, the active groups present in the mesoporous silica matrix are considered not to provide optimal release performance as most of the drug amount has been released into the solution medium in a relatively less time.24,25
In this study, surface modification of SBA-16 was carried out using active aluminum (Al) groups. Furthermore, the SBA-16 that has been added by the Al group is called SBA-16-Al. While leaving the other kinetic parameters unchanged, it was discovered that the doping of the silica nanomaterial framework with aluminum reduced the amount of drug released during the bursting stage.26 The modification can be done using the direct-synthesis grafting method.27 The introduction of active Al groups in mesoporous silica can increase the acidity of the material.28,29 This increase in the acidity of SBA-16 is expected to improve the adsorption and release performance of rifampicin in solution media. This research aims to study the characteristics of the synthesized, SBA-16-Al and understand the adsorption process of rifampicin in the SBA-16-Al matrix using adsorption isotherm and thermodynamic parameters.
After rifampicin was loaded in the SBA-16-Al matrix, the research continued to study the mechanism and kinetics of rifampicin release that occurred in the drug delivery system using several models including zero-order kinetics, first-order kinetics, Higuchi model, Kitazawa model, and Hixon–Crowell model. In this case, rifampicin loaded in the pores of SBA-16-Al was tested for its release pattern and whether it followed the Higuchi model which is usually appropriate for oral drug release. With the known pattern and kinetics of drug release of rifampicin loaded in SBA-16-Al, it can be used for the innovation of Tuberculosis treatment.30,31 This study on oral drug release was carried out in the digestive medium of the stomach and intestines because this medium represents the main environment where the process of digestion and drug absorption occurs, namely at gastric pH (pH = 1.5) and intestinal pH (pH = 6.5).
This work investigates novel approaches to oral drug delivery, with a focus on examining the adsorption and release kinetics of the tuberculosis medicine rifampicin when it is put into the mesoporous silica nanomaterial SBA-16-Al. The main contribution of this work is the assessment of the material's capacity to control the release of the rifampicin-loaded SBA-16-Al as well as the degree of rifampicin uptake by mesoporous silica nanomaterial when Al species is the active group in SBA-16. Mesoporous silica's adaptability allows for the creation of systems that are specifically suited to the demands of oral medication delivery. Drug release kinetics studies may increase treatment efficacy and reduce side effects by providing a thorough understanding of the drug release profile of the nanomaterials. Consequently, the creation of more complex and effective medication compositions for the treatment of tuberculosis will benefit greatly from this research.
Materials and methods
Chemical used
This study used the SBA-16-Al which was synthesized in Polytechnic of Nuclear Technology, National Research and Innovation Agency Indonesia, rifampicin, and hydrochloric acid (Merck). The SBA-16-Al was synthesized using Pluronics F127 (EO106PO70EO106), poly(ethylene oxide)–poly(propylene oxide)–poly(ethylene oxide) (Merck), silica tetraethylorthosilicate precursor (Merck), and aluminum sulfate 18-hydrate (Merck).Synthesis and characterization of SBA-16-Al
Pluronic F127 of as much as 4 grams was dissolved in 150 mL of 1.6 N hydrochloric acid and aluminum sulfate 18-hydrate and tetraethylorthosilicate (Al![[thin space (1/6-em)]](https://www.rsc.org/images/entities/char_2009.gif) :
:![[thin space (1/6-em)]](https://www.rsc.org/images/entities/char_2009.gif) Si = 1
Si = 1![[thin space (1/6-em)]](https://www.rsc.org/images/entities/char_2009.gif) :
:![[thin space (1/6-em)]](https://www.rsc.org/images/entities/char_2009.gif) 20) were added. The mixture was adjusted to pH 1–2 by adding 0.1 N hydrochloric acid or 0.1 N sodium hydroxide, stirred at 45 °C for 20 hours until a gel was formed, and subjected to sonication. The mixture was precipitated for 1 hour at 100 °C. The precipitate was washed with ethanol and distilled water until the pH of the filtrate was neutral, dried in an oven for 1 hour at 120 °C, and calcined using a furnace for 6 hours at 550 °C. The characteristics of SBA-16-Al were studied using several instruments including functional groups using Fourier Transform Infrared Spectroscopy (FTIR), a morphological structure using Transmission Electron Microscopy (TEM), a diffraction pattern using X-ray diffraction (XRD), and the specific surface area and pore diameter using Surface Area Analyzer (SAA) Brunaur, Emmett and Teller (BET) method.
20) were added. The mixture was adjusted to pH 1–2 by adding 0.1 N hydrochloric acid or 0.1 N sodium hydroxide, stirred at 45 °C for 20 hours until a gel was formed, and subjected to sonication. The mixture was precipitated for 1 hour at 100 °C. The precipitate was washed with ethanol and distilled water until the pH of the filtrate was neutral, dried in an oven for 1 hour at 120 °C, and calcined using a furnace for 6 hours at 550 °C. The characteristics of SBA-16-Al were studied using several instruments including functional groups using Fourier Transform Infrared Spectroscopy (FTIR), a morphological structure using Transmission Electron Microscopy (TEM), a diffraction pattern using X-ray diffraction (XRD), and the specific surface area and pore diameter using Surface Area Analyzer (SAA) Brunaur, Emmett and Teller (BET) method.
Rifampicin adsorption study
The feed solution was prepared by dissolving rifampicin in 0.1 N hydrochloric acid. The concentration of the feed solution was made to vary by 5–1000 ppm. SBA-16-Al as much as 50 mg was put into 50 mL of feed solution and stirred using a shaker with a variation of time (18–26 hours) and stirring temperature (298, 302, and 308 K). The concentration of rifampicin present in the filtrate was analyzed using a UV-vis spectrometer. In general, there is no theoretical model to describe the adsorption isotherm of solid/liquid adsorption. Adsorption isotherm data are then generally analyzed and modeled using the empirical Langmuir (1918) and Freundlich (1906) models. Linearization of Langmuir and Freundlich models as shown in eqn (1) and (2). The coefficient of relation (R2) of the two equations that are closest to 1 is taken as the model that represents the adsorption isotherm model.
 | (1) |
 | (2) |
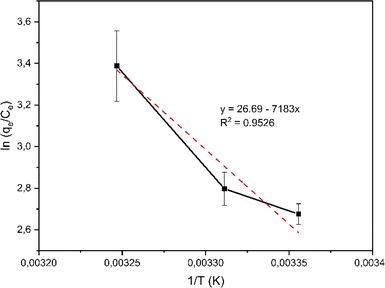
Adsorption thermodynamic parameters such as enthalpy (ΔH) and entropy (ΔS) were calculated from the slope and intercept of the linear curve between 1/T against ln(qe/Ce) as in eqn (3). Gibbs free energy (ΔG) was calculated using eqn (4) with R as the gas constant (8.314 × 10⁻³ kJ K−1 mol−1).32
 | (3) |
| ΔG = ΔH − TΔS | (4) |
Rifampicin release study
Rifampicin was first loaded into SBA-16-Al using the in vitro passive loading method. SBA-16-Al was added into 50 mL of 2000 ppm rifampicin solution. The mixture was stirred for 24 hours. The mixture was filtered and the precipitate was dried at room temperature. The precipitate was put into 30 mL of artificial gastric simulation solution without pepsin (pH 1.5) and artificial intestinal simulation (pH 6.5). The mixture was allowed to stand according to the study variables to find the release time profile of rifampicin from SBA-16-Al. The mixture was filtered and the rifampicin content in the filtrate was analyzed using a UV-vis spectrometer. In this study, the speed of the drug to reach its target action or drug delivery system was carried out by using the zero-order kinetics equation (eqn (5)), first-order kinetics (eqn (6)), Higuchi model (eqn (7)), Kitazawa model (eqn (8)), and Hixon–Crowell model (eqn (9)).33,34| qt = q0 + k0t | (5) |
 | (6) |
 | (7) |
 | (8) |
| q01/3 − qt1/3 = k4t | (9) |
Cytotoxicity of the MSN to normal fibroblast 3T3 cells
The cytotoxicities of the SBA-16 and SBA-16-Al were determined using the MTT assay. The mouse embryonic9 fibroblast 3T3-L1 cell line (ATCC CL-173) was preincubated in a 96-well culture plate overnight at 37 °C. Therefore, the cells were cultured in addition to 500, 250, 125, 50, 10, 5, and 1 μg mL−1 of the SBA-16 and SBA-16-Al for 24 h. The cells cultured without any treatment were used as a negative control. After the incubation, the thiazolyl blue tetrazolium bromide reagent (Sigma-Aldrich, Cat. No. M2128) was added directly and the cultured cells were incubated at 37 °C for 120 min. The absorbance in each well was determined using a microplate spectrophotometer in the wavelength range of 550–600 nm. The cell viability was then measured as a percentage of cell viability compared to the negative control.The statistic
In this study, a rigorous statistical method was used to assess the presence of significant differences within the data set. The primary statistical technique used was a Student's t-test, a technique that is well-suited for comparing two groups or two types of data. This method was chosen based on its suitability for the study design and the nature of the data. The validity of the study's findings was ensured by calculating analysis results with a significance level (α) set at 95%, corresponding to a p-value of 0.05. Differences were considered statistically significant if the p-value was less than α.Result and discussion
Characterization of SBA-16-Al
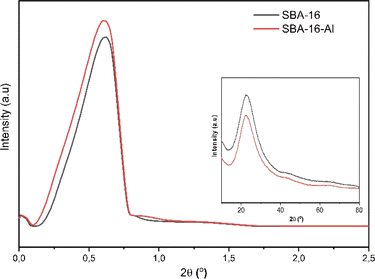
Characterization of MSNs was initiated using XRD both small angle and large angle. The results of this characterization were used to confirm that the MSNs are nanostructured. The nanostructured nature indicates that MSNs will be able to be used in drug delivery systems. The results of the characterization of SBA-16-Al using XRD in Fig. 1 show the spectral shape of the material which has an amorphous phase of SiO2 nanostructure by SBA-16. Fig. 1 shows that the synthesized silica materials both SBA-16 and SBA-16-Al have diffraction peak patterns at dominant small angles (2θ range < 1°) which indicates both types of nanomaterials are nanostructured, such as uniform and relatively intense pore distribution patterns. These nanostructured characteristics can be confirmed by characterization results with other instruments such as SAA-BET and TEM.The SBA-16 and SBA-16-Al have an amorphous phase based on a broadened peak in 2θ range of 20–30°.35 The crystalline silica is not expected because the crystalline silica cannot dissolve in water and is more toxic and difficult to modify. Amorphous silica is water-soluble and biocompatible so it can improve the dissolution process of the drug (in this case rifampicin) in the drug delivery system.36 However, the rate of the drug dissolution process also needs to be controlled.37 Dissolution that is too fast as in conventional drugs can eliminate most of the therapeutic effects of the drug. In conventional drugs, the mass transfer of drug molecules from the solid form into the media solution (body fluids) is too fast, so the drug molecules are wasted in the body's excretion system before reaching the target. The addition of the Al species from the Al precursor will trigger an active group in the SBA-16 that aims to control the course of the drug dissolution process in the media solution.38
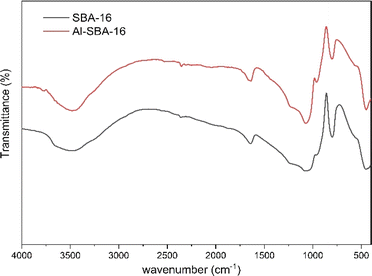
The FTIR spectrum showed that the active group of Al has been grafted on SBA-16 in Fig. 2. Characterization using FTIR aims to determine whether the addition of Al species will trigger the occurrence of active functional groups on MSN. The FTIR spectrum displayed O–H stretching bond at 3464 cm−1 caused by Si–OH and octahedral AlO4(OH)2, symmetric and asymmetric stretching Si–O–Si bond at 1080 cm−1, and 802 cm−1.39–42
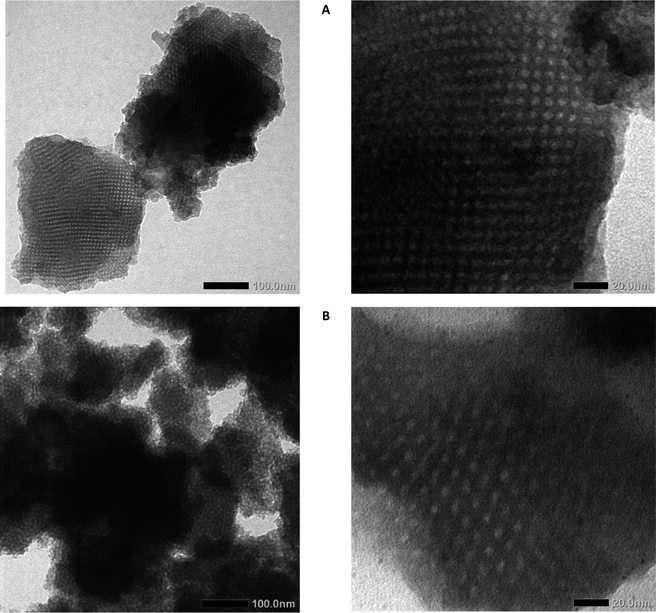
The nanostructure and morphology of MSN are determined by nitrogen sorption analysis and TEM. TEM images (Fig. 4) show that the nanoparticle has a mesopore structure, nano-size particle, and amorphous phase of the silica crystal lattice. The MSN could be aggregated between particles that are caused by surface modification. Metal oxide (Al modification) is one factor that contributes to the MSN SBA-16 having excess surface energy causing agglomeration by chemical bonding.43 It occurs by an interaction between nanomaterial or interparticle electrostatic interaction 44 Besides showing the agglomeration of MSN, the TEM image showed mesopore structure.
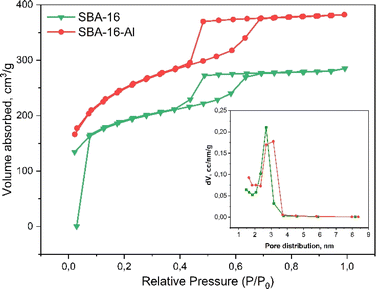
The pore patterns from the TEM photos show that both SBA-16 and SBA-16-Al have pores that tend to be uniform and relatively large enough to tether rifampicin molecules into them. It can be seen that the presence of Al species does not significantly reduce the pore size and also does not reduce the regularity of the pores. The mesoporous structure of MSN SBA-16-Al and SBA-16 was confirmed by nitrogen sorption analysis in Fig. 3. Nitrogen sorption analysis is presented that SBA 16 modified with Al has a hysteresis loop isotherm (type IV isotherm) which indicates the material has a mesoporous structure.45 The BET analysis results even indicated the advantages of Al species modification on SBA-16, namely an increase in the specific surface area of the nanomaterial and a slight increase in pore size. Surface modification of the SBA-16 using Al resulted in an increase in specific surface area to 843.5 m2 g−1 (SBA-16-Al) compared to the specific surface area of SBA-16 of 624.3 m2 g−1. Increasing the specific surface area and pore diameter of MSN will have a good effect on the drug loading capacity. The results of the BET analysis also show that the average pore diameter increases slightly but still shows a uniform pattern. This is a desirable property of MSN because it will have a good effect when MSN is used as a drug delivery candidate.
The rifampicin adsorption and thermodynamic parameter study
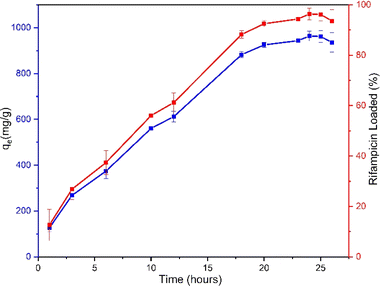
The experiments studying the adsorption pattern of rifampicin on MSN and determination of the adsorption thermodynamic parameters are intended to observe the adsorption or uptake capacity of MSN towards rifampicin. Furthermore, data on adsorption kinetics parameters, adsorption isotherm model, and adsorption thermodynamic parameters can be generated. The information obtained at this stage is very useful in designing drug-loading systems on MSNs.Based on the adsorption process that has been carried out from the time interval of 18 to 26 hours, the results of the remaining rifampicin concentration in the solution are displayed in the form of a breakthrough curve. The breakthrough curve in Fig. 5 shows that the value of qe continues to adsorb rifampicin in aqueous media by SBA-16-Al. The rapid adsorption at the beginning of time-dependent adsorption at 18–22 hours was caused by many accessible active sites on the surface of the material. Fig. 5 shows that the adsorption process has reached the equilibrium phase to achieve maximum rifampicin adsorption capacity (rifampicin maximum uptake), namely at 24 hours, and continued with the desorption process afterward (release from adsorbate to solution).41 So the data at 24 hours is used as the equilibrium time of the adsorption process. Based on Fig. 5, it can be seen that within 24 hours, the rifampicin uptake level was close to 100%. This indicates a relatively high maximum adsorption capacity.
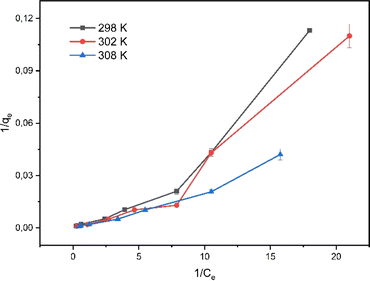
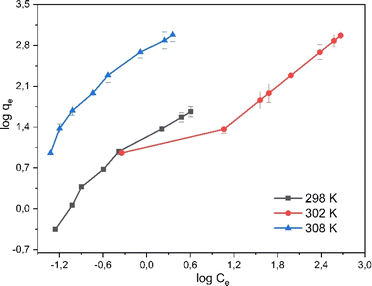
The mechanism of rifampicin drug entry in SBA-16-Al and the description of the distribution of SBA-16-Al 6 molecules between the liquid phase and the solid phase at equilibrium.46 In this work, the adsorption equilibrium of rifampicin is explained using two basic isotherm equations, the Langmuir and Freundlich isotherms.42 The adsorption process was influenced by the affinity of nanomaterials between Al and adsorbate and the effect of surface chemical properties. The driving force could rise as the concentration of rifampicin increases to overcome the mass transfer resistance of rifampicin from the aqueous solution into SBA-16-Al, which enhances the adsorption equilibrium of the SBA-16-Al until it achieves its saturated state. Instead of increasing the initial absorbate concentration, it would cause a decrease in adsorption efficiency. The linear curves for Langmuir and Freundlich isotherm models were obtained as shown in Fig. 6 and 7. The values of the Langmuir constant, Freundlich constant, and correlation coefficient (R2) of the linear equation are shown in Table 1.
| T (K) | Langmuir | Freundlich | ||
|---|---|---|---|---|
| KL | R2 | KF | R2 | |
| 298 | 1.29 | 0.92 | 10.21 | 0.96 |
| 302 | 1.00 | 0.93 | 10.45 | 0.94 |
| 308 | 1.89 | 0.85 | 12.88 | 0.96 |
Based on the correlation coefficient (R2) values in Table 1, it can be seen that the adsorption of rifampicin by SBA-16-Al follows the Freundlich model at each adsorption temperature. The Freundlich model describes heterogeneous and multilayer adsorption.47 The modification of the active Al group on the surface of the SBA-16 material allows for monolayer chemical bonding.48 The Langmuir isotherm is indicated by the Langmuir correlation coefficient (R2) value which has a slight difference from the Freundlich isotherm.32 This can cause rifampicin adsorption not only to occur on the surface of the material but also on the bond between the rifampicin molecules themselves so that the adsorption is multilayer. The linear curve of the relationship between 1/T and ln(qe/Ce) (Fig. 8) was used to study the thermodynamic parameters of rifampicin adsorption such as enthalpy (ΔH), entropy (ΔS), and Gibbs free energy (ΔG) values tabulated in Table 2.
| T (K) | ΔS (kJ K−1 mol−1) | ΔH (kJ mol−1) | Error (%) | ΔG (kJ mol−1) | Error (%) |
|---|---|---|---|---|---|
| 298 | 0.234 | 55.689 | 0.29 | −14.044 | 1.16 |
| 302 | 0.234 | 56.130 | 0.49 | −14.539 | 1.91 |
| 308 | 0.234 | 55.735 | 0.21 | −16.337 | 0.71 |
In an amorphous state, drugs are typically thermodynamically unstable and tend to congregate to change into a stable crystalline form.49 Drug loading on Al-modified mesoporous silica nanomaterials can reduce the rapid dispersion of drugs. The Al groups on the surface of the material acting as gatekeepers will bind the adsorbed drug molecules so that the dispersion of the drug becomes slower. The adsorption process of rifampicin by SBA is chemisorption characterized by an enthalpy value greater than 40 kJ mol−1. This indicates that there is a chemical bond between rifampicin and SBA-16 material which is thought to be caused by the active group of Al or silanol. The presence of the –NH and –OH hydrogen bonding with the free silanol group on the pore wall surface of mesoporous silica considerably influences the interaction process between drug and silica nanomaterials inside the pore or along the surface.12,50 The occurrence of the chemical reaction is not spontaneous which is characterized by a negative Gibbs free energy value at each adsorption temperature. The adsorption reaction of rifampicin by SBA-16-Al is quite stable. This is characterized by a relatively small entropy value.51
Fig. 9 displays an approximate schematic of the adsorption interaction between the rifampicin molecule and SBA-16-Al. The results of the analysis of the thermodynamic parameters of the adsorption of SBA-16-Al with rifampicin, in terms of the enthalpy value (ΔH), show a value of more than 40 kJ mol−1, indicating chemisorption. The estimated interaction is that the OH species in the rifampicin compound acts as a proton donor which in aqueous conditions can release protons and produce hydroxyl groups. However, aluminated MSN (SBA-16-Al), which has some of the silica groups replaced by aluminum groups, tends to have a positive charge due to the cationic nature of aluminum. Electrostatic interactions will occur between the positive charge on the aluminum group of SBA-16-Al and the negative charge of the electron pair on the oxygen in the hydroxyl group of the rifampicin molecule.
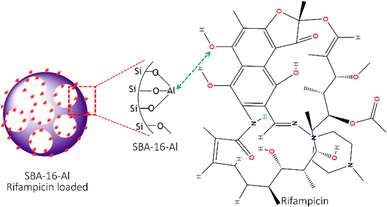 | ||
| Fig. 9 The scheme of interaction between mesoporous silica nanomaterials SBA-16-Al and rifampicin molecules. | ||
Rifampicin release kinetics
The pore, surface, and aperture of mesoporous silica nanomaterials were functionalized with stimuli-responsive groups, particularly Al modification (metal oxide), which served as caps and gatekeepers. Controlled drug release could occur in response to internal or external stimuli such as pH, temperature, redox, and enzyme processes.52 The speed of rifampicin to reach its target action through the drug delivery system was carried out by studying its release kinetics in artificial gastric simulation solution media without pepsin (pH 1.5) and artificial intestinal simulation (pH 6.5). The choice of stomach and intestine organs takes into account physiological relevance. In this case, the stomach and intestines are an important part of the human digestive tract where drugs are traditionally consumed orally. Therefore, studies carried out on this medium provide more relevant information about how the drug will behave in this part of the human body. The stomach has an acidic environment with a pH of around 1, which helps in the digestion of food and kills microorganisms. After passing through the stomach, food and medication enter the small intestine, where the pH is more neutral (between 6 and 7). The effect of changes in pH can affect the speed of drug release and absorption. Based on the United States Pharmacopeia, artificial gastric simulation was carried out at a pH range of 1.2–4.5,53 while artificial intestinal simulation was carried out at a pH range of 5.5–7.2. After the rifampicin release process from SBA-16-Al, the data on the mass of rifampicin in solution was processed and presented in the form of linear curves following eqn (4)–(8).The linear curve of rifampicin release kinetics from SBA-16-Al in a simulated artificial gastric solution without pepsin (pH 1.5) is shown in Fig. 10. The release of rifampicin at pH 1.5 has two release kinetics profiles. Profile 1 is the release profile of rifampicin from SBA-16-Al before the brush effect which occurs between 0.5–5 hours. Profile 2 is the release profile of rifampicin from SBA-16-Al after the brush effect which occurs between 6–15 hours. The brush effect resulted in a significant increase in rifampicin release. This is because the SBA-16-Al undergoes dissolution (mass transfer of matrix molecules into solution).54 An illustration depicting profile 1 and profile 2 of rifampicin release is shown in Fig. 11.
 | ||
| Fig. 10 Linear curves of rifampicin pH 1.5 release kinetics (a) zero order, (b) first order, (c) Higuchi model, (d) Kitazawa model, and (e) Hixon–Crowell model. | ||
 | ||
| Fig. 11 Linear curves of rifampicin pH 6.5 release kinetics (a) zero order, (b) first order, (c) Higuchi model, (d) Kitazawa model, and (e) Hixon–Crowell model. | ||
The kinetics parameters of rifampicin release from SBA-16-Al in artificial gastric simulated solution media without pepsin (pH 1.5) and artificial intestinal simulation (pH 6.5) are tabulated in Table 3. Based on the correlation coefficient (R2) of each kinetic model, the release of rifampicin in pH 1.5 solution followed the Higuchi model for profile 1. This describes the SBA-16-Al matrix containing an initial concentration of rifampicin much greater than the solubility of rifampicin (C0 ≫ Cs). The diffusion mechanism of rifampicin in a pH 1.5 solution is unidirectional and constant. The thickness of the SBA-16-Al matrix is much greater than the size of the rifampicin molecule, so the swelling or dissolution effect of the SBA-16-Al matrix has not occurred (negligible). This is illustrated in Fig. 10c in profile c1.
| Release profile | Kinetic of rifampicin release | |||||||||
|---|---|---|---|---|---|---|---|---|---|---|
| Zero order | First order | Higuchi | Kitazawa | Hixon–Crowell | ||||||
| k0 | R2 | k1 | R2 | k2 | R2 | k3 | R2 | k4 | R2 | |
| a Profile 1 of rifampicin release (a1) zero order, (b1) first order, (c1) Higuchi, (d1) Kitazawa, and (e1) Hixon–Crowel between 0.5–5 hours of dissolution in Fig. 10.b Rifampicin release profile 2 (a2) zero-order, (b2) first-order, (c2) Higuchi, (d2) Kitazawa, and (e2) Hixon–Crowel between 6–15 hours of dissolution in Fig. 11. | ||||||||||
| pH 1.5a | 0.1683 | 0.66 | 0.0535 | 0.63 | 0.5472 | 0.78 | 0.0018 | 0.66 | 0.0561 | 0.66 |
| pH 1.5b | 0.3158 | 0.92 | 0.0408 | 0.94 | 0.0408 | 0.90 | 0.0036 | 0.93 | 0.0036 | 0.93 |
| pH 6.5 | 2.1075 | 0.95 | 0.0496 | 0.83 | 12.192 | 0.96 | 0.0496 | 0.94 | 0.7025 | 0.95 |
Unlike profile 1, the release of rifampicin in a pH 1.5 solution follows first-order kinetics for profile 2. After the brush effect process, the SBA-16-Al matrix dissolved into the solution medium. This causes the speed of rifampicin release at any given time to be proportional to the concentration of rifampicin remaining in SBA-16-Al at that time.
Similar to the release kinetics at pH 1.5, rifampicin release in a pH 6.5 solution also followed the Higuchi model. The linear curve of rifampicin release kinetics from SBA-16-Al in a simulated artificial intestinal solution (pH 6.5) is shown in Fig. 11. The release of rifampicin at pH 6.5 has only one release kinetics profile. The brush effect process was absent from the linear curve profile of rifampicin release at pH 6.5. This means that there is no change in the shape or dissolution of the SBA-16-Al matrix by artificial intestinal simulation solution media.
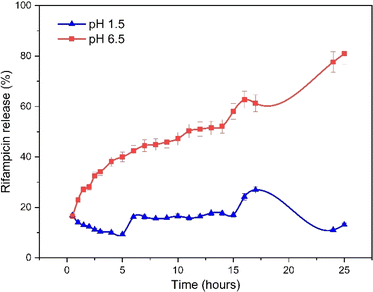
Based on the release profile of rifampicin in solutions of different acidity (Fig. 10 and 11), the profile or model of rifampicin release kinetics is slightly different. The SBA-16-Al matrix is acidic. When the solution medium is highly acidic, there will be a release of free acid into the solution medium. The free acid has a smaller solubility than its salt. This can reduce the speed of rifampicin release into the solution media and cause the amount of rifampicin in the pH 1.5 solution media to be lower than the pH 6.5 solution media as seen in Fig. 12. Whereas in the pH 6.5 solution media, the rifamaldehyde group in the SBA-16-Al matrix turns into part of the salt so that the rifampicin dissolution process in the solution media achieves maximum results even within 24 hours.
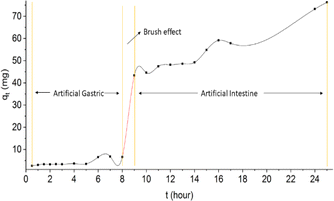
When viewed from the drug delivery system that follows the body's metabolic system through oral, the optimum time for in vitro simulation (stomach) is 8 hours, while for in vitro simulation (intestine) is a maximum of 16 hours.55 When referring to the drug delivery system, the oral release profile of rifampicin consists of two profiles as shown in Fig. 13. Profile 1 uses rifampicin release data at pH 1.5 between 0.5–8 hours. While profile 2 uses rifampicin release data at pH 6.5 between 9–25 hours.
During the first 8 hours of rifampicin release (profile 1), the amount of rifampicin released into the solution medium was 6.61 mg. This is a small amount of the total rifampicin present in the SBA-16-Al matrix. This indicates the performance of rifampicin release from the SBA-16-Al matrix is slow release or as expected. Based on Fig. 13, the brush effect process will occur in the dissolution time range of 8 hours to 9 hours. This indicates that the SBA-16-Al matrix began to dissolve from the 8th hour to the 9th hour. In an artificial gastric system, the body part involved is the initial digestive organ. If the designed matrix is dissolved (eroded) in the artificial gastric system, this means that the SBA-16-Al matrix design is similar to the conventional drug therapy process which experiences high peak plasma at the beginning (Fig. 13). SBA-16-Al matrix is quite good or strong in maintaining its matrix shape within the first 8 hours.
The existence of the brush effect in the 8th to 9th hour causes the number of rifampicin molecules that move from the SBA-16-Al matrix to the media solution to increase significantly. This increase in the transfer of rifampicin molecules is due to the opening of the SBA-16-Al pathway (pore) caused by the dissolution process during the previous brush effect event. Some researchers have reported studies on the effect of pH around the digestive area (pH 1 to 7.4), our results can achieve a longer release time of 24 hours.56–58 The optimum or longest time of drug release is when it is in the artificial intestinal section from the 9th to the 25th hour (Fig. 13). This shows the suitability between the SBA-16-Al matrix design and the mechanism in the body. The process of drug therapy using the SBA-16-Al matrix occurs optimally in the artificial intestinal section. The amount of rifampicin released at the 9th hour was 43.35 mg or 50% of the total rifampicin in the SBA-16-Al matrix (94.37 mg).
When referring to the release profile of the type of preparation (matrix) in therapy (Fig. 13), the release profile for the SBA-16-Al matrix belongs to the type of matrix with a control release type. Control release type is a type of matrix that provides a constant release process at a certain time for a longer duration than conventional drug matrices. To achieve a therapeutic effect, conventional drugs must be dosed three times a day, while using SBA-16-Al material is expected to reduce the dose of drugs given to patients.
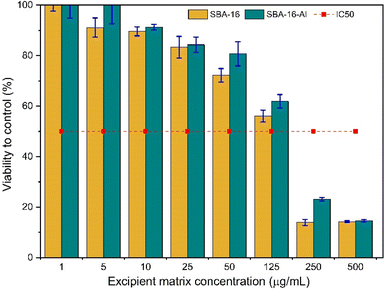
Although MSNs can be used as oral drug delivery vehicles due to the biocompatible nature of MSNs and their ability to protect and deliver drugs to targeted sites, it is important to understand their potential toxicity to normal cells before clinical use. This is to ensure that the use of MSN in drug therapy will not cause damage or adverse side effects to the organism. These cytotoxicity studies are shown in Fig. 14. Thus, toxicity test studies on normal cells help ensure the safety and security of using MSNs in drug delivery. The test method with 3-(4,5-dimethylthiazol-2-yl)-2,5-diphenyltetrazolium bromide or MTT is a sensitive method, can measure cell viability accurately, and is relatively simple and fast. This method allows precise assessment of the effects of toxicity on normal cells. Meanwhile, the normal cell samples chosen were 3T3 fibroblast cells, which are a type of normal cell that is often used in toxicity research because they represent normal cells that are often found in the human body. Adding discussion of cytotoxicity SBA-16-Al (Fig. 14) synthesized in this study showed smaller than SBA-16, with an IC50 value of 140 μg mL−1, the IC50 of SBA16 is 125 μg mL−1. When compared with research by other scientists using MSN (but loaded with compounds other than Al), the toxic effect of SBA-16-Al has a relatively negligible effect on normal cells.59
Conclusion and outlooks
This research has successfully synthesized mesoporous SBA-16-Al material which has a specific surface area of 843.5 m2 g−1 and a nanometer-sized pore diameter. The FTIR spectra showed the Al–O bond at 802 cm−1 which indicates the Al group has been successfully added in SBA-16. Al active group the adsorption isotherm of rifampicin in SBA-16-Al follows the Freundlich model which describes the adsorption as heterogeneous and forms a multilayer. The adsorption of rifampicin is chemisorption which occurs non-spontaneously and is quite stable. The release kinetics of rifampicin in the drug delivery system followed the Higuchi model with k1 0.5472 mg 0.5/hour (profile 1 pH 1.5) and k2 mg 0.5/hour (profile 2 pH 6.5).The results of the study of the adsorption and release of Rifampicin with a mesoporous silica nanomaterial matrix, SBA-16-Al, encouraged the author to study more deeply the interaction between the matrix and the drug. Furthermore, the author wants to study the variation of Al![[thin space (1/6-em)]](https://www.rsc.org/images/entities/char_2009.gif) :
:![[thin space (1/6-em)]](https://www.rsc.org/images/entities/char_2009.gif) Si ratio on the adsorption and release pattern of rifampicin and also wants to use advanced characterization such as Small Angle X-ray Scattering (SAXS), X-ray photoelectron spectroscopy and raman spectroscopy to observe the interaction between SBA-16-Al and rifampicin. Finally, it is hoped that there will be an opportunity to conduct biocompatibility tests of SBA-16-Al including rifampicin-loaded animal tests.
Si ratio on the adsorption and release pattern of rifampicin and also wants to use advanced characterization such as Small Angle X-ray Scattering (SAXS), X-ray photoelectron spectroscopy and raman spectroscopy to observe the interaction between SBA-16-Al and rifampicin. Finally, it is hoped that there will be an opportunity to conduct biocompatibility tests of SBA-16-Al including rifampicin-loaded animal tests.
Author contributions
Maria Christina P: conceptualization, methodology, investigation, writing – review, project administration, supervision, resources. Puji Astuti: methodology, investigation, writing – original draft. Chaidir Pratama: methodology, investigation, writing – original draft. Noor Anis Kundari: conceptualization, methodology, and supervision, Kartini Megasari: investigation, Dhita Ariyanti: investigation, Andri Saputra: writing – review & editing, Hersandy Dayu Kusuma: conceptualization, investigation, writing – review & editing.Conflicts of interest
There are no conflicts to declare.Acknowledgements
This work is supported by Research Funding from the Polytechnic Institute of Nuclear Technology Grant's. The authors acknowledge the facilities, and scientific and technical support from Yogyakarta Radiation Laboratory, National Research and Innovation Agency.References
- T. Cernuschi, S. Malvolti, E. Nickels and M. Friede, Vaccine, 2018, 36, 498–506 CrossRef PubMed.
- M. Fouad Rabahi, J. Laerte Rodrigues da Silva Júnior, A. Carolina Galvão Ferreira, D. Graner Schuwartz Tannus-Silva, M. Barreto Conde and M. Rabahi, J. Bras. Pneumol., 2017, 43, 472–486 CrossRef PubMed.
- J. Mackay-Dick, Br. Med. J., 1965, 2, 232 CrossRef.
- P. Das, S. Ganguly, A. Rosenkranz, B. Wang, J. Yu, S. Srinivasan and A. R. Rajabzadeh, Mater. Today Nano, 2023, 24, 1–4 Search PubMed.
- P. Das, S. Ganguly, A. Saravanan, S. Margel, A. Gedanken, S. Srinivasan and A. R. Rajabzadeh, ACS Appl. Bio Mater., 2022, 5, 5617–5633 CrossRef CAS PubMed.
- T. Yanagisawa, T. Shimizu, K. Kuroda and C. Kato, Bull. Chem. Soc. Jpn., 1990, 63, 988–992 CrossRef CAS.
- J. S. Beck, J. C. Vartuli, W. J. Roth, M. E. Leonowicz, C. T. Kresge, K. D. Schmitt, C. T. W. Chu, D. H. Olson, E. W. Sheppard, S. B. McCullen, J. B. Higgins and J. L. Schlenker, J. Am. Chem. Soc., 1992, 114, 10834–10843 CrossRef CAS.
- C. T. Kresge, M. E. Leonowicz, W. J. Roth, J. C. Vartuli and J. S. Beck, Nature, 1992, 359, 710–713 CrossRef CAS.
- T. W. Kim, F. Kleitz, B. Paul and R. Ryoo, J. Am. Chem. Soc., 2005, 127, 7601–7610 CrossRef CAS PubMed.
- D. Zhao, Q. Huo, J. Feng, B. F. Chmelka and G. D. Stucky, J. Am. Chem. Soc., 1998, 120, 6024–6036 CrossRef CAS.
- H. A. Ab Wab, K. Abdul Razak and N. D. Zakaria, J. Nanopart. Res., 2023, 15, 968 Search PubMed.
- M. Naghiloo, M. Yousefpour, M. S. Nourbakhsh and Z. Taherian, J. Sol-Gel Sci. Technol., 2015, 74, 537–543 CrossRef CAS.
- M. Mohseni, K. Gilani and S. A. Mortazavi, Iran. J. Pharm. Res., 2015, 14, 27–34 CAS.
- D. M. Alshangiti, T. K. El-damhougy and A. Zaher, RSC Adv., 2023, 13, 35251–35291 RSC.
- P. Gaynor, GRAS Notice for Synthetic Amorphous Silica as a Carrier in White Sugar, 2021 Search PubMed.
- M. C. Prihatiningsih, T. Ariyanto, E. G. R. Putra, V. Y. Susilo, I. Mahendra and I. Prasetyo, ACS Omega, 2022, 7, 13494–13506 CrossRef CAS PubMed.
- A. I. W. S. Ramadani, N. S. Pamungkas, N. A. Putrisetya, M. C. Prihatiningsih, M. D. Permatasari, A. A. Nugroho, S. Suyanta, A. Patriati, S. Soontaranon and E. G. R. Putra, At. Indones., 2020, 46, 11–17 Search PubMed.
- J. L. Vivero-Escoto, I. I. Slowing, V. S. Y. Lin and B. G. Trewyn, Small, 2010, 6, 1952–1967 CrossRef CAS PubMed.
- Y. Dang and J. Guan, Smart Polym. Mater. Biomed. Appl., 2020, 1, 10–19 Search PubMed.
- N. Baig, I. Kammakakam, W. Falath and I. Kammakakam, Adv. Mater., 2021, 2, 1821–1871 RSC.
- A. A. Nayl, A. I. Abd-Elhamid, A. A. Aly and S. Bräse, RSC Adv., 2022, 12, 13706–13726 RSC.
- G. F. Andrade, D. C. F. Soares, R. K. D. S. Almeida and E. M. B. Sousa, J. Nanomater., 2012, 816496 Search PubMed.
- S. Kwon, R. K. Singh, R. A. Perez, E. A. A. Neel, H. W. Kim and W. Chrzanowski, J. Tissue Eng., 2013, 4, 1–18 CrossRef PubMed.
- M. Shaban and M. Hasanzadeh, RSC Adv., 2020, 10, 37116–37133 RSC.
- Y. Salinas, M. Kneidinger, C. Fornaguera, S. Borrós, O. Brüggemann and I. Teasdale, RSC Adv., 2020, 10, 27305–27314 RSC.
- R. A. Mitran, D. Berger, J. Pandele-Cusu and C. Matei, J. Nanomater., 2017, 9864396 Search PubMed.
- P. Biswas, Catalytic Performances of NiMo/Zr-SBA-15 Catalysts for the Hydrotreating of Bitumen Derived Heavy Gas Oil, MSc Thesis, Saskatoon, University of Saskatchewan, 2011.
- M. Brandhorst, J. Zajac, D. J. Jones, J. Rozière, M. Womes, A. Jimenez-López and E. Rodríguez-Castellón, Appl. Catal., B, 2005, 55, 267–276 CrossRef CAS.
- X. Liang, J. Li, Q. Lin and K. Sun, Catal. Commun., 2007, 8, 1901–1904 CrossRef CAS.
- S. Dash, P. N. Murthy, L. Nath and P. Chowdhury, Acta Pol. Pharm. – Drug Res., 2010, 67, 217–223 CAS.
- D. R. Paul, Int. J. Pharm., 2011, 418, 13–17 CrossRef CAS PubMed.
- I. Langmuir, J. Am. Chem. Soc., 1938, 60, 1362 Search PubMed.
- K. Kheawfu, A. Kaewpinta, W. Chanmahasathien, P. Rachtanapun and P. Jantrawut, Membranes, 2021, 11(6), 403 CrossRef CAS PubMed.
- P. A. Segun, T. O. Ajala and O. I. Aremu, J. Pharm. Health Sci., 2018, 6, 103–111 Search PubMed.
- U. Zulfiqar, T. Subhani and S. W. Husain, J. Asian Ceram. Soc., 2016, 4, 91–96 CrossRef.
- M. J. Mitchell, M. M. Billingsley, R. M. Haley, M. E. Wechsler, N. A. Peppas and R. Langer, Nat. Rev. Drug Discovery, 2021, 20, 101–124 CrossRef CAS PubMed.
- I. I. Slowing, J. L. Vivero-Escoto, C. W. Wu and V. S. Y. Lin, Adv. Drug Delivery Rev., 2008, 60, 1278–1288 CrossRef CAS PubMed.
- P. Huang, D. Lian, H. Ma, N. Gao, L. Zhao, P. Luan and X. Zeng, Chin. Chem. Lett., 2021, 32, 3696–3704 CrossRef CAS.
- S. Porrang, N. Rahemi, S. Davaran, M. Mahdavi, B. Hassanzadeh and A. M. Gholipour, J. Taiwan Inst. Chem. Eng., 2021, 123, 47–58 CrossRef CAS.
- B. I. Tamba, A. Dondas, M. Leon, A. N. Neagu, G. Dodi, C. Stefanescu and A. Tijani, Eur. J. Pharm. Sci., 2015, 71, 46–55 CrossRef CAS PubMed.
- K. T. Basuki, M. Fatuzzahroh, D. Ariyanti and A. Saputra, Int. J. Technol., 2021, 12, 625–634 CrossRef.
- Y. Li, Y. Wang, L. He, L. Meng, H. Lu and X. Li, J. Hazard. Mater., 2020, 383, 121144 CrossRef CAS PubMed.
- A. Tsuda and N. V. Konduru, NanoImpact, 2016, 2, 38–44 CrossRef PubMed.
- F. Ahangaran and A. H. Navarchian, Adv. Colloid Interface Sci., 2020, 286, 102298 CrossRef CAS PubMed.
- K. Trzeciak, A. Chotera-ouda, I. I. Bak-sypien and M. J. Potrzebowski, Pharmaceutics, 2021, 13(7), 950 CrossRef CAS PubMed.
- M. Hasan, A. L. Ahmad and B. H. Hameed, Chem. Eng. J., 2008, 136, 164–172 CrossRef CAS.
- H. Freundlich, Trans. Faraday Soc., 1932, 28, 195–201 RSC.
- A. Saputra, D. Swantomo, T. Ariyanto and H. Sulistyo, Water. Air. Soil Pollut., 2019, 230, 213 CrossRef CAS.
- Z. Wang, B. N. Ye, Y. T. Zhang, J. X. Xie, W. S. Li, H. T. Zhang, Y. Liu and N. P. Feng, AAPS PharmSciTech, 2019, 20, 1–12 CrossRef PubMed.
- S. Jangra, P. Girotra, V. Chhokar, V. K. Tomer, A. K. Sharma and S. Duhan, J. Porous Mater., 2016, 23, 679–688 CrossRef CAS.
- A. L. Myers, AIChE J., 2002, 48, 145–160 CrossRef CAS.
- R. Zhang, M. Hua, H. Liu and J. Li, Mater. Sci. Eng., B, 2021, 263, 114835 CrossRef CAS.
- L. Li, X. Zheng, C. Pan, H. Pan, Z. Guo, B. Liu and Y. Liu, RSC Adv., 2021, 11, 26229–26240 RSC.
- J. Siepmann, R. A. Siegel and M. J. Rathbone, Fundamentals and Applications of Controlled Release Drug Delivery, 2012, pp. 1–594 Search PubMed.
- B. P. Kolte, K. V. Tele, V. S. Mundhe and S. S. Lahoti, Asian J. Biomed. Pharm. Sci., 2012, 2, 21–28 Search PubMed.
- L. H. Nielsen, J. Nagstrup, S. Gordon, S. S. Keller, J. Østergaard, T. Rades, A. Müllertz and A. Boisen, Biomed. Microdevices, 2015, 17, 55 CrossRef PubMed.
- C. Illanes-Bordomás, M. Landin and C. A. García-González, Pharmaceutics, 2023, 15(11), 2639 CrossRef PubMed.
- R. A. K. Possomato-Vieira, S. José and R. A. Khalil, Physiol. Behav., 2017, 176, 139–148 CrossRef PubMed.
- A. Kamil Mohammad Al-Mosawi, A. R. Bahrami, S. Nekooei, A. S. Saljooghi and M. M. Matin, Front. Bioeng. Biotechnol., 2023, 10, 1–18 Search PubMed.
| This journal is © The Royal Society of Chemistry 2024 |

