 Open Access Article
Bi-doped BaBiO3 (x = 0%, 5%, 10%, 15%, and 20%) perovskite oxides by a sol–gel method: comprehensive biological assessment and RhB photodegradation†
Wissam Bouchala,
Faiçal Djani*a,
Djamel Eddine Mazouzia,
Rima Nour Elhouda Tiribc,
Soufiane Makhloufia,
Chaker Laiadid,
Arturo Martínez-Arias e,
Ayşenur Aygünbc and
Fatih Sen
 *bc
*bc
aMolecular Chemistry and Environment Laboratory, Mohammed KHIDER University Biskra, BP:145 RP, Biskra, 07000, Algeria. E-mail: f.djani@univ-biskra.dz
bSen Research Group, Department of Biochemistry, University of Dumlupınar, 43000, Kütahya, Turkey. E-mail: fatihsen1980@gmail.com
cSRG Incorporated Company, Kutahya Design & Technopole, Calca OSB Neighbourhood, 43100 Kutahya, Turkey
dDepartment of Chemical Engineering, Mohammed KHIDER University, Biskra 07000, Algeria
eInstituto de Catálisis y Petroleoquímica, CSIC, C/Marie Curie 2, Campus de Cantoblanco, 28049 Madrid, Spain
First published on 1st March 2024
Abstract
The BaBiO3 (BBO) perovskite oxide was prepared via a sol–gel method with different concentrations of Bi nitrate and examined as a photocatalyst for RhB degradation under sunlight, and its antioxidant and antibacterial activities were examined. X-ray diffraction (XRD) indicated the formation of a BaBiO3–BaCO3 (BBO–BCO) binary composite. For the degradation of RhB under solar radiation, high photocatalytic activity (73%) was observed. According to the antibacterial activity study, the addition of Bi enhanced the antibacterial activity of the resulting material against both Gram-positive and Gram-negative microorganisms. The Bi%–BBO (Bi 20%) inhibited 96.23% S. aureus. 10% Bi–BBO as an antioxidant agent had the most efficacious IC50 value of 2.50 mg mL−1. These results seem to suggest that BBO–BCO is a promising catalytic material with potential application in the fields of catalysis and medicine.
1. Introduction
Nanotechnology has become one of the major fields of science and the sixth most innovative and promising technology, with significant influence on the international economy and society.1–3 Nanomaterials are nanometre-sized particles (1 to 100 nm) that are frequently employed in nanoscience applications and research.4,5 Due to their thermal conductivity, high surface-to-volume ratio, catalytic reactivity, and nonlinear optical performance,6 these nanoparticles (NPs) are chemically stable. Nanotechnology is gaining importance owing to its various applications such as in electronics, information storage, optoelectronics,7,8 chemical industries, environmental protection, drugs and pharmaceuticals, catalysis, antibacterial,9 and antioxidants.10 Due to the unique chemical, physical, and biological properties of NPs,11 which include their high catalytic activity, chemical stability, and antibacterial and antioxidant medicinal activities,12,13 they have numerous and diverse applications. Materials nanoparticles such as CuO,11 ZnO,11,14,15 ZnFe2O4,16 and LaNiO3 (ref. 17) have been studied for environmental and biomedical applications. Alternatively, BaBiO3, since it was first manufactured in 1993, has attracted continuous interest from scientists.18 It is an oxide from the ABO3 perovskites class, possessing interconnected BiO6 octahedra19 and a structured arrangement of bismuth ions. According to X-ray and neutron diffraction data,20 the crystalline structure of the BaBiO3 perovskite can be duplicated (Ba2Bi3+Bi5+O6), comprising of bismuth in two valence states, i.e., Bi3+ and Bi5+.21 Various groups have classified its symmetry as monoclinic, orthorhombic, rhombohedral, and triclinic. The BBO mixed oxide is a p-type semiconductor22 with an extremely low bandgap (2 eV) and significant ability for absorbing visible light, resulting from the hybridized O 2p and Bi 6s orbitals in the valence bands (VBs), which reduce the bandgap.23 BaBiO3 particle samples have been synthesized using various techniques, including hydrothermal techniques,24 sol–gel method,25 and solid-state reactions.26 It has been reported that the preparation method has subtle effects on the electronic structure, morphology, particle size, and light intensity of this compound.27,28 The application of this ternary compound has been reported in various fields including superconductivity,29 photovoltaics,23 photoelectrochemical water splitting processes,30 and photocatalysis.31 Jain et al.32 prepared BBO from barium and bismuth nitrates using the Pechini method and confirmed the formation of BaBiO3 phase in a monoclinic structure and its band gap was calculated from UV-VIS DRS and found to be 2.07 eV. Subsequently, the prepared perovskite was used as a photocatalyst to degrade the drug ibuprofen under visible light. The removal rate was 60% after 180 min of irradiation. According to Tang and coworkers,31 the BBO perovskite synthesized from Ba(NO3)2 and Bi(NO3)3·5H2O showed photocatalytic properties for the degradation of acetaldehyde and methylene blue. The oxide crystallizes in a monoclinic structure, where the Bi3+ and Bi5+ ions coexist. The theoretical calculation indicated that this material has an indirect band gap (indirect semiconductor), and then the synthesized oxide can decompose methylene blue dye with a degradation rate of 75% after 120 min under Xe lamp irradiation. Sharma et al.33 used BaBiO3 synthesized via the Pechini route as a photocatalyst for the degradation of malachite green dye under visible light. The prepared oxide calcined at 800 °C had an optical band gap of 2.07 eV and showed a strong fundamental absorption edge at 600 nm. The decomposition of malachite green dye followed pseudo-first-order kinetics. This bismuthate was synthesized by Shilna et al.19 via the sol–gel technique using barium nitrate (Ba(NO3)2) and bismuth nitrate (Bi(NO3)3·5H2O) dissolved in ethylene glycol and they performed magnetic and resistivity measurements, indicating the presence of ferromagnetic domains. The research by Gao et al.34 revealed that the structural monoclinic BaBiO3 phase had optical band gaps between 2.07 and 1.81 eV. They also used DFT to perform first-principles calculations and discovered that BaBiO3 is predicted to be a promising p-type conductive oxide due to its excellent electrical conductivity (0.16 S cm−1) and light hole effective mass (0.445 m0 and 0.563 m0). The photocatalytic reduction of CO2 to methane and CO under visible light was investigated by Khraisheh et al.35 in the presence of BaBiO3 prepared via solid-phase synthesis and calcined at high temperature using Bi2O3 and BaCO3 as precursors, which had an absorption band edge of 2.04 eV. Based on previous studies, we determined that the above-mentioned oxide has been used in several applications and yielded highly effective results. However, it has never been used in the biological field as an antioxidant or antibacterial. BaBiO3 nanoscale powder was synthesized via the sol–gel method to investigate its catalytic activity for the degradation of Rhodamine B dye, one of the most difficult to degrade and dangerous colorants, under sunlight, and then the possibility of its reuse for multiple cycles studied. Rhodamine B, which is classified as a water-soluble cationic pigment, can cause many harmful effects such as cancer, respiratory infections, and skin problems. However, due to its stability and difficulty in degradation, its removal remains a challenge and there is a need to find an effective, economical, and environmentally friendly ways to achieve this. In addition, to examine the antioxidant activity of the prepared powder using the DPPH reduction technique and its antibacterial activity for two types of bacteria, i.e., E. coli and S. aureus, while considering the enhancement in both its physicochemical and catalytic properties, an excess of bi-nitrate was added to determine its effect on the studied properties.2. Materials and methods
2.1. Synthesis of BaBiO3 and Bi excess
To study the effect of excess Bi on the structure of the BaBiO3 (BBO) perovskite, via the sol–gel method: 1 mol of Ba(NO3)2 (from Panreac), 1 mol of Bi(NO3)3·5H2O (from Biochem), an excess of 5–10–15 and 20% of the mass of Bi(NO3)3·5H2O were dissolved in distilled water, and then mixed with 2 mol of citric acid under heating at 80 °C for 12 h until a white gel was obtained. Subsequently, this gel was placed in an oven overnight to dry. After grinding the dried powder, TG analysis was carried out to determine the calcination temperature. Finally, the resulting powder was treated thermally at 900 °C for 8 h at a rate of 5 °C min−1.2.2. Characterization of BaBiO3 and Bi excess
The thermal decomposition of the precursors (prior to calcination) was investigated by thermogravimetric analysis (TGA) using a METTLER TOLEDO TGA/DSC 3+ instrument from 25 °C to 1000 °C, at a heating rate of 10 °C min−1 in an air atmosphere. The crystallographic information of the powder samples was obtained via powder X-ray diffraction (Bruker AXS D8 Advance) employing Cu-Kα radiation (λ = 1.542 Å) in the 2θ range of 5° to 90°. The crystalline phases were identified by comparing them to the JCDDS standard using the X'pert High Score program. Fourier transform infrared spectroscopy was performed using a PerkinElmer VATR 2 spectrophotometer in ATR-FTIR mode to investigate the characteristic peaks of the as-synthesized powders in the spectral range of 2000–400 cm−1. The UV-VIS diffuse reflectance spectra of the synthesized samples were acquired using a Cary 60 UV-VIS spectrophotometer and the band gap Eg was determined using the obtained data. The surface morphology was examined using a Quanta SEM Prisma E de Thermo Scientific scanning electron microscope. The SEM was equipped with an energy-dispersive X-ray analyser (EDX), which was used to determine the elemental composition. The specific surface area (SBET) was obtained by applying the BET method to the nitrogen adsorption/desorption isotherm acquired at −196 °C with a Micrometrics ASAP 2020 Plus 2.00. All the samples were degassed overnight at 150 °C before adsorption. The Barrett–Joyner–Halenda (BJH) approach was used to determine the pore size distribution (pore diameter and sample volume).2.3. Determination of photocatalytic activity
The photocatalytic activity of the synthesized oxide was evaluated using Rhodamine B as the pollutant under sunlight irradiation. Before performing the various analyses, the decomposition of RhB was performed in the absence of photocatalyst with and without light for 24 h. No change in the absorbance of RhB was detected in these blank experiments. For this test, 250 mL of RhB solution (2.087 × 10⁻⁴ M) and 1 mg mL−1 of the oxide were placed in the dark for 30 min with agitation to ensure adsorption/desorption equilibrium. Subsequently, the solution was exposed to sunlight for 210 min, and the agitation process was maintained to preserve the homogeneity of the mixture. A specimen was withdrawn at 30 min intervals, followed by centrifugation for removing the NPs. The absorbance of the solution containing the supernatant was measured using a Uviline 9400 spectrophotometer. The photodegradation rate was calculated using the following equation:where C0 and Ct are the initial and the measured concentration of RhB in the solution, respectively, at λmax = 554 nm. The recycling studies were successfully carried out to study the recyclable properties of the BBO photocatalyst. Following each photocatalytic reaction, the BBO photocatalyst was centrifuged and rinsed with distilled water, followed by ethanol and acetone, and then dried at 60 °C for reuse.
2.4. Determination of antioxidant activity
The antioxidant power of BBO was evaluated via the DPPH (1,1-diphenyl-2-picrylhydrazyl) method, as described by Jaidee et al.36 Different concentrations of BBO powder (1, 2, 3, 4, and 5 mg mL−1) were incorporated in 1 mL of ethanoic DPPH solution and left in the dark for 30 min. The formula used to determine the percentage of inhibition:where A0 and At are the absorbance of the control and test sample, respectively, at λmax = 517 nm. A linear regression analysis was performed to determine the IC50 value for the sample. Subsequently, the obtained results were compared with that of ascorbic acid (1, 2, 3, 4, and 5 mg).
2.5. Antibacterial activity
The antibacterial properties of BBO against E. coli and S. aureus, two harmful bacteria to humans, were evaluated with a variation in excess Bi (%). A loop was used to transport the bacteria from the stock bacterial culture to a liquid medium, where they were cultured for 24 h. The absorbance values of the bacterial cultures were measured after 24 h and a 0.5 McFarland concentration of bacterial culture was added to the culture created for the antibacterial test trials of the catalyst in accordance with the reference procedure.37 The necessary calculations were done for the excess (%) Bi concentration tests at several levels (0%, 5%, 10%, 15%, 20%). The antimicrobial tests were performed using 96-well plates. The bacterial culture containing the catalyst was cultivated for 24 h in a shaker in an incubator at 37 °C to track the growth of the bacteria and effects of the nanoparticles. After 24 h, the absorbance values at 600 nm of the bacterial culture were measured using a spectrophotometer. The percentage of bacterial inhibition of the bacterial cells at various Bi (%)–BBO concentrations was assessed using the absorbance readings.3. Results and discussion
3.1. Characterization
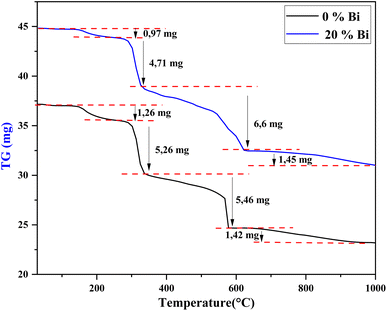
The first mass loss from 30 °C to 240 °C can be attributed to the evaporation of residual water and organic compounds (partial decomposition of the citric acid molecule).37 The second loss of mass between 240 °C and 330 °C corresponds to the pyrolysis and combustion of organic substances33 and the formation of BaCO3. The third mass loss between 330 °C and 625 °C is attributed to nitrate combustion (decomposition). The last mass loss detected from 625 °C to 1000 °C is relatively small and attributed to the formation of the perovskite structure. Accordingly, it was concluded that 900 °C is the optimal calcination temperature for achieving the intended phase.
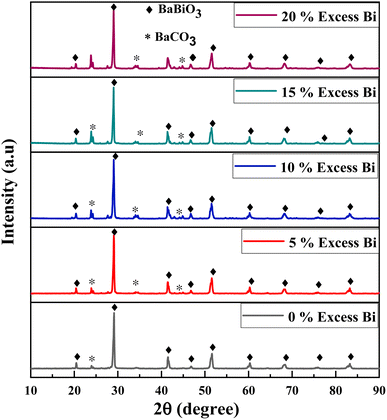
The diffraction peaks for the BaBiO3 system appear at the most intense 2θ diffraction angles (20.375°; 29.019°; 41.439°; and 51.174°), and peaks at 2θ angles corresponding to the BaCO3 system phase (23.9°; 34.087°; and 41.986°), with the Miller indices (hkl) of BaBiO3 and BaCO3 of (11−1) (111), (22−2), and (11−3), and (111), (112), and (221), respectively. The cell parameters of the binary composite formed were calculated for all the values of excess Bi from diffractograms with Rietveld refinement. All the structural parameters, including volume and crystalline size, are summarized in Table S1.† The crystallite size was calculated using the Scherrer equation,39 as follows:
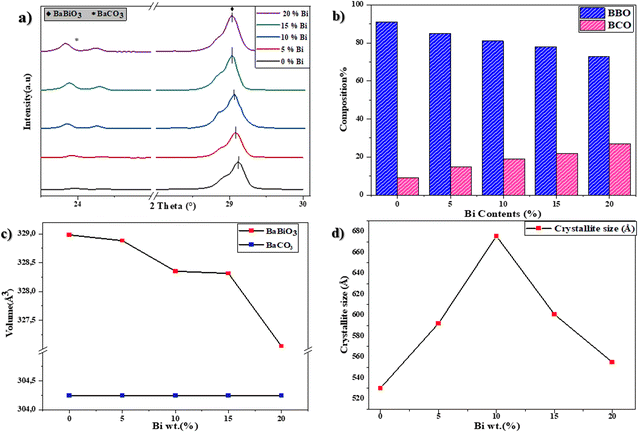
As shown in Fig. 3a, a gradual shift was observed in the main peak at 29.01° (111) for the BaBiO3 majority phase towards lower angles with an increase in Bi concentration, which is in contrast with the difference in rays between the Ba2+ ionic ray greater than the Bi3+ ionic ray and can be explained based on the cation valence states.40 Substitution at the A site of a valence Bi3+ ion for a Ba site causes a charge compensation transition from Bi3+ to Bi5+, shifting the peaks towards lower angles. The intensity of the main peak (most intense peak) 23.9° Miller index (111) of the BaCO3 minority phase, increased with an increase the Bi content and is related to the percentage of the BaCO3 formed (0% Bi: 9%, 5% Bi: 15%, 10% Bi: 19%, 15% Bi: 22%, and 20% Bi: 27%).
Fig. 3b shows the evolution of BaCO3 formation as a function of the Bi content added with the precursors. The percentage of BaCO3 formed with 0% Bi added to BaBiO3 (0% Bi–BBO) is 9%, and with an increase in the latter (20% Bi–BBO), 27% BaCO3 formed with 73% BaBiO3, indicating that Ba is substituted by the added excess Bi. Subsequently, the substituted Ba2+ ions are combined with the CO32− ions from the complexing agent (citric acid) to form BaCO3. The cell volume of BaBiO3 decreased with an increase in the Bi content in the samples. This decrease can be explained by the fact that the larger Ba2+ ions are replaced by the smaller Bi3+ ions in the perovskite A site (the atomic radius of Ba is larger than that of Bi). Alternatively, the volume of the BaCO3 lattice remains constant with all percentages of Bi excess given that the lattice did not undergo any substitution (Fig. 3c). As can be seen in Fig. 3d, the average crystallite size (ACS) of Bi%–BBO varied between 51 and 67 nm. It can be observed that as the Bi% content increased from 0 to 10%, the average crystallite size of the particles increased, while with a further increase in the Bi content to 15% and 20%, the ACS of the binary composite decreased gradually. The minimum crystalline size was observed for pure BBO (51 nm).
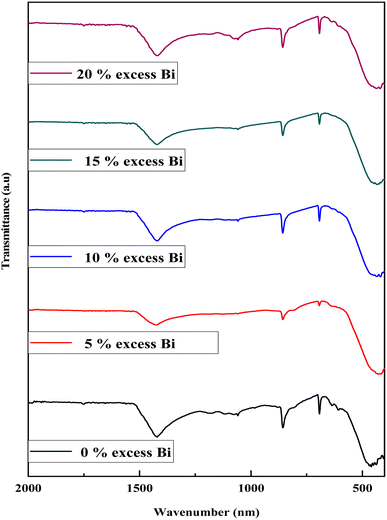
The bands at around 1420 cm−1 of the C–O bond of the carbonates41 found in the BaCO3 structure were confirmed by XRD, while the characteristic bands at around 850 cm−1 in the five spectra are attributed to the deformation vibration of the BO6 octahedra (Bi–O–Bi) and that of the Bi–O bond tetrahedral elongation vibrations are found at around 450 cm−1.42 The Ba–O band is present at around 690 cm−1.
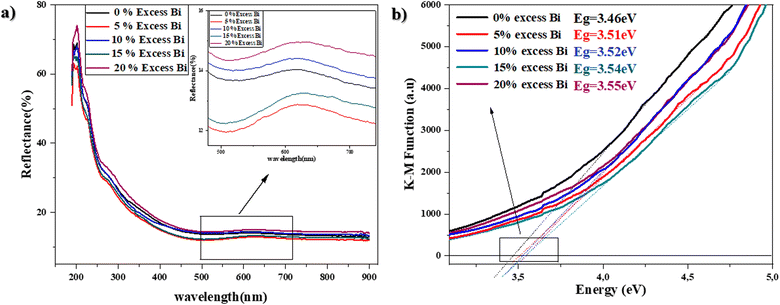
Two bands, one at 200 nm and another smaller one at around 600 nm, were observed for all the BBO samples, indicating the photocatalytic activity of the prepared powder in visible light.33 The optical gap of the powders was determined using the Kubelka–Munk function. The band gap value was obtained by extrapolating the linear part of the related plot of (αhν)2 vs. hν up to (αhν)2 = 0.31 The band gap energies (Eg) of the samples obtained at 900 °C are presented in Table 1. The Eg is between 3.55 and 3.46 eV (Fig. 5b), which is different from the previously reported values in the range of 1.81 eV to 2.25 eV in ref. 23 and 19. These high values can be explained by the presence of BaCO3 with a gap of 5.51 eV.43 These results show that the optical gap increased with the addition of Bi.
| Oxide | Particle size (μm) | Band gap (eV) | BET (g m−2) | Average pore diameter (nm) | Average particle size (nm) |
|---|---|---|---|---|---|
| Pure BBO | 26.18 | 3.46 | 0.1108 | 1.8213 | 6.84 |
| 5% Bi–BBO | 27.05 | 3.51 | 0.8047 | 0.3643 | 5.16 |
| 10% excess of Bi | 29.15 | 3.52 | 0.8770 | 0.8269 | 7.45 |
| 15% excess of Bi | 30.61 | 3.54 | 1.2314 | 1.6807 | 4.87 |
| 20% excess of Bi | 30.81 | 3.55 | 1.2853 | 1.8067 | 4.66 |
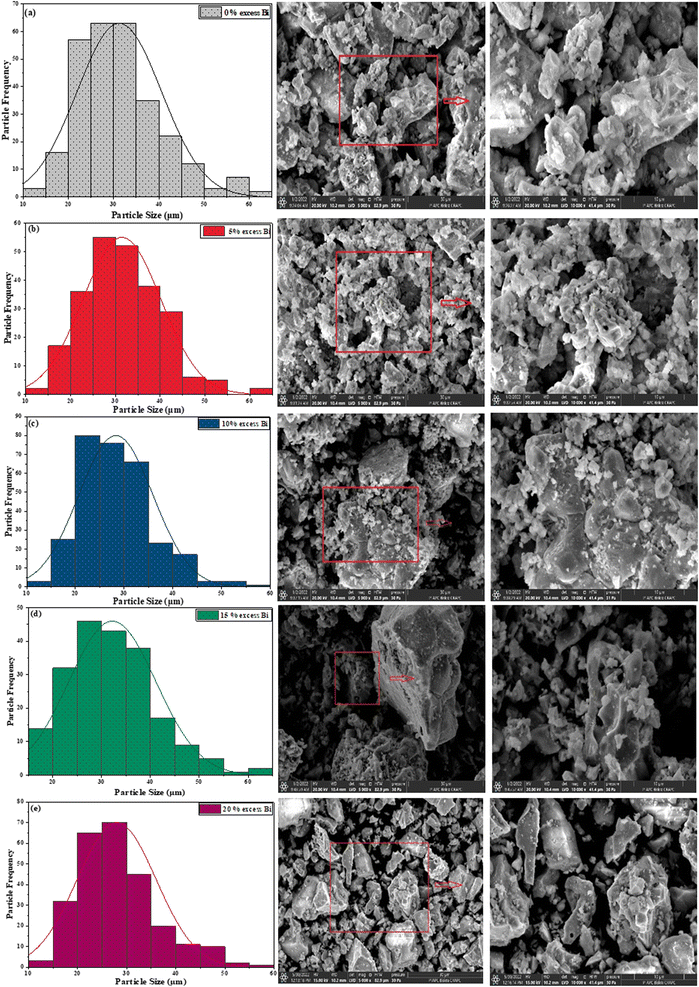 | ||
| Fig. 6 Micrographs and particle size histograms for BaBiO3–BaCO3: (a) pure BBO, (b) 5% excess Bi, (c) 10% excess Bi, (d) 15% excess Bi, and (e) 20% excess Bi particles. | ||
More than SEM, EDS was used to validate the information provided by SEM. As is clear from Fig. 7a, Ba, Bi, and O appeared in the EDS spectrum and the abundance of the elements in the composition of the synthesized composites was measured in weight percent. Fig. 7b and Table 2 show an increase in the Bi abundance percentage with an increase in Bi content.
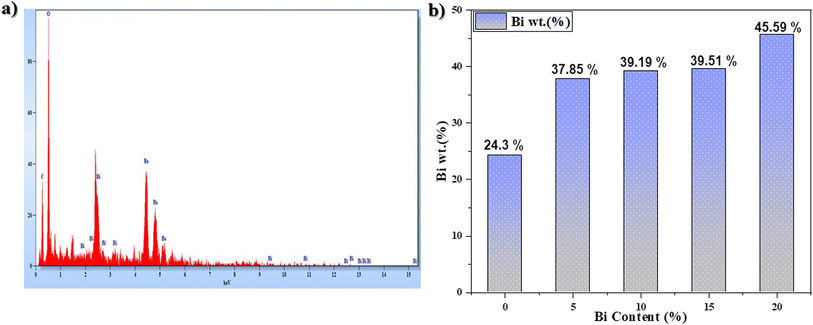 | ||
| Fig. 7 (a) EDS spectrum of the as-prepared sample (20% excess Bi) and (b) variation in Bi wt% as a function of Bi content. | ||
| Weight (%) | |||
|---|---|---|---|
| Ba | Bi | O | |
| Pure BBO | 59.25 | 24.3 | 16.45 |
| 5% excess Bi | 48.36 | 37.85 | 13.79 |
| 10% excess Bi | 55.52 | 39.19 | 5.29 |
| 15% excess Bi | 50.96 | 39.51 | 9.53 |
| 20% excess Bi | 12.97 | 45.59 | 41.16 |
3.2. Photocatalytic activity of Bi%–BBO
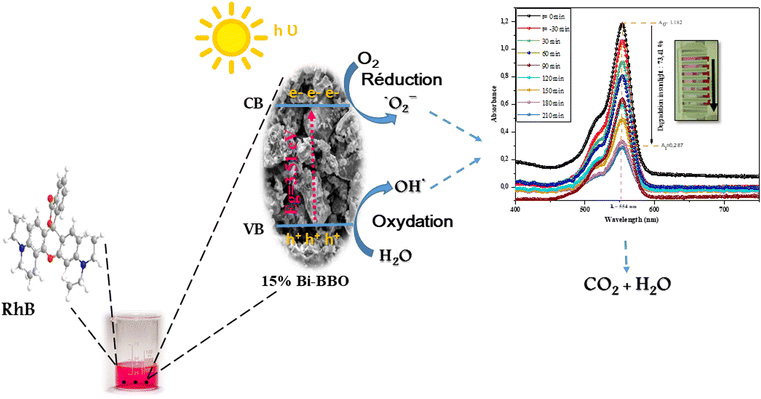
The photocatalytic activity of synthesized BBO was determined by examining its ability to degrade Rhodamine B under the influence of solar energy. The absorbance spectra of RhB in the present of BBO powder at various periods over 210 min are shown in Fig. 8, where the intensity of the characteristic peak at 554 nm decreased as a function of time.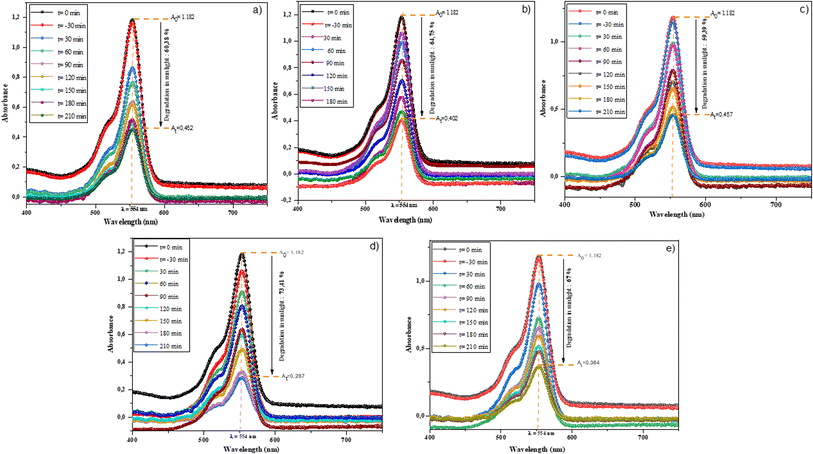 | ||
| Fig. 8 Absorption spectra of RhB by BBO–BCO NPs under solar energy for different durations: (a) 0% Bi–BBO, (b) 5% Bi–BBO, (c) 10% Bi–BBO, (d) 15% Bi–BBO, and (e) 20% Bi–BBO. | ||
The rate of RhB degradation for the samples of % Bi–BBO was between 59% and 73%, where 15% Bi–BBO exhibited the highest photodegradation compared to 10% Bi–BBO (Fig. 9a). It is clear that the crystallite size had no impact on the degradation efficiency. The unpredictable conduct in the consistent pace of photocatalytic decay with the progressive Bi surplus can be ascribed to the complex interplay in the electronic structure of the catalyst. This deviation may originate from non-monoclinic alterations in the dynamics of the charge carriers, surface reactivity, or recombination rates introduced by Bi, consequently impacting the general kinetics of decay.
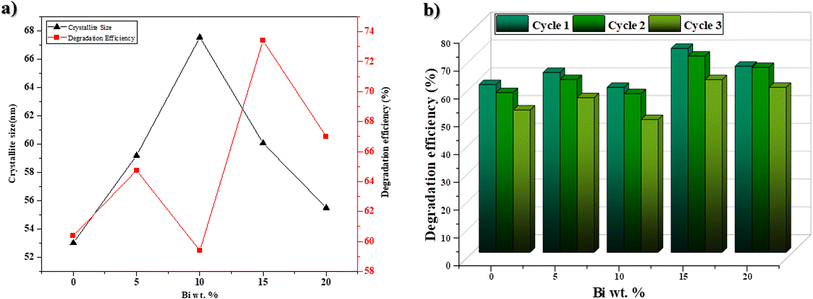 | ||
| Fig. 9 (a) Relationship between degradation efficiency and crystallite size and (b) recycling of Bi%–BBO for the photodegradation of RhB. | ||
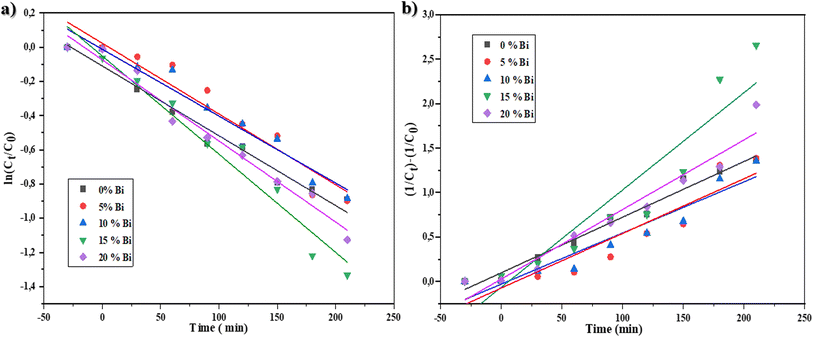
The kinetic investigation offers substantial proof for comprehending the mechanism of degradation through photocatalysis. This is achieved by the estimation of the rate constant (k). There several models for studying the kinetics of the photodegradation reaction, including the Langmuir, Freundlich, Temkin, pseudo-first-order (PFO) and pseudo-second-order (PSO) models.49–51 In this work, a kinetic study of the performance of the % Bi–BBO nanoparticles (NPs) in degrading RhB was conducted, and the data was analysed using the first- and second-order rate models, as indicated by eqn (1) and (2), respectively.
 | (1) |
 | (2) |
The rate constant values and regression correlation coefficient (R2) of the kinetic curves are provided in Table 3. The validity of the rate constants was assessed based on the regression correlation coefficient (R2) of the kinetic plots.49–52 It was observed that the R2 values for the first-order rates are greater than 0.9222, while the R2 values for the second-order rates were smaller (0.8). Consequently, the photocatalytic degradation follows the first-order rate model for the BBO catalyst ranging from 5% to 20%-Bi. However, the R2 values for 0%-Bi–BBO correspond to the second-order rate. This observation can be explained by the manner in which the recombination rate of e−–h+ occurs, with the rate following a first-order rate law when one electron is excited and recombined with h+, and a second-order rate law when multiple e−–h+ recombination occur simultaneously within a photocatalyst particle.49–53
| Bi% excess | First order | Second order | ||
|---|---|---|---|---|
| Rate constant (k1 × 10−2 min−1) | R2 | Rate constant (k2 × 10−2 min−1) | R2 | |
| 0% Bi–BBO | 0.41 | 0.9674 | 0.6291 | 0.9787 |
| 5% Bi–BBO | 0.41 | 0.9223 | 0.6149 | 0.8674 |
| 10% Bi–BBO | 0.39 | 0.9569 | 0.5757 | 0.9123 |
| 15% Bi–BBO | 0.57 | 0.9595 | 1.0951 | 0.8735 |
| 20% Bi–BBO | 0.47 | 0.9762 | 0.7832 | 0.9416 |
To examine the durability and reusability of the Bi%–BBO nanoparticles, RhB degradation recycling tests were carried out under the same conditions. As illustrated in Fig. 9b, the degradation efficiency of Bi%–BBO exhibited no apparent decrease after three cycles, indicating the outstanding stability and reusability of the photocatalyst. According to the above-mentioned study, a degradation mechanism was proposed for RhB molecules. Fig. 11 illustrates the mechanism of the degradation of RhB in the presence of BBO, playing the role of a photocatalyst and absorbing a photon whose energy is higher than the energy of its gap band. This absorption leads to the generation of an electron–hole pair in the valence band (VB) and the conduction band (CB), respectively.54 The interaction between a pair of electron holes and oxygen and water molecules leads to the formation of superoxide radical ions and hydroxyl radicals, which are extremely active species that target dye molecules![[thin space (1/6-em)]](https://www.rsc.org/images/entities/char_2009.gif) and degrade them into non-toxic molecules such as water (H2O), carbon dioxide (CO2), and inorganic ions.55 The possible mechanism can be summarized be the following reactions:
and degrade them into non-toxic molecules such as water (H2O), carbon dioxide (CO2), and inorganic ions.55 The possible mechanism can be summarized be the following reactions:
| Bi%–BBO + hν → h+ + e− |
| e− + O2 → ˙O2− |
| ˙O2− + H+ → OH˙ |
| RhB + ˙O2−/OH˙ → CO2 + H2O + inorganic ions |
3.3. Antioxidant activity of Bi%–BBO
The DPPH method was effectively used to evaluate the antioxidant activity of the as-prepared % Bi–BBO NPs, which showed a change in color from violet to pale yellow (reduction). This reduction was examined by spectrophotometry at 517 nm. The DPPH radical scavenging activity varied as the concentration of BBO nanoparticles increased, as shown in Fig. 12a. Bi–BBO nanoparticles at 1 mg mL−1 concentrations of 0%, 5%, 10%, 15%, and 20% exhibited an inhibition percentage of 35.03%, 14.8%, 41.87%, 43.33%, and 29.45%, respectively. This percentage was 61.3%, 59.23%, 89.64%, 63.85%, and 60.66% at 5 mg mL−1.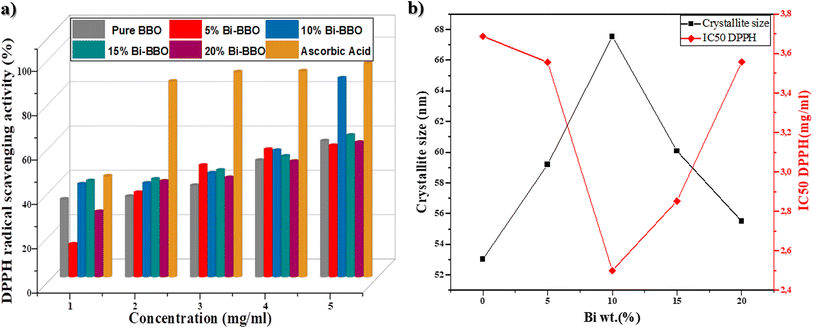 | ||
| Fig. 12 (a) DPPH radical scavenging activity of % Bi–BBO and ascorbic acid. (b) Relationship between IC50 DPPH and crystallite size. | ||
In addition to the observation of antioxidant activity by the nanoparticles, the antioxidant activity of ascorbic acid as a standard at 1 mg mL−1 was determined to be 45.47%, while at 5 mg mL−1 it was noted to be 96.42%. The results illustrate absolutely that the Bi%–BBO nanoparticles capture free radicals in a dose dependent manner. To evaluate the efficacy of the antioxidant activity, the IC50 value was calculated. The IC50 is the sample concentration required to capture 50% of the free radicals. The IC50 value decreases as the antioxidant capacity increases. The most effective (optimum) IC50 value was obtained for 10% Bi–BBO, with a concentration of 2.50 mg mL−1 (Table 4). The reason for this is possibly related to the size of the crystallites (67 nm), as mentioned in Fig. 12b.
| NPs | IC50 DPPH (mg mL−1) |
|---|---|
| Ascorbic acid | 1.178 |
| Pure BBO | 3.688 |
| 05% Bi–BBO | 3.556 |
| 10% Bi–BBO | 2.500 |
| 15% Bi–BBO | 2.853 |
| 20% Bi–BBO | 3.557 |
3.4. Bi%–BBO as antibacterial agent
The 96-well plate microdilution method was used to test the antibacterial impact of the Bi%–BBO. The percentage of bacterial inhibition with pure BBO and BBO with various amounts of extra Bi (5%, 10%, 15%, and 20%) is shown in Fig. 13. The bacterial inhibition % against S. aureus (39%) and E. coli (61%) was demonstrated by pure BBO. S. aureus (96.23%) and E. coli (85%) were the two bacteria with the highest percentage of bacterial inhibition when Bi was present in excess of 20% (Fig. 12). The antibacterial activity of Bi%–BBO was found to be directly related to the excess % of Bi. The excess of Bi in the material is due to the fact that Bi substitutes Ba in increasing proportions, while the Ba1−xBixBiO3 structure tends to become Bi2O3, which has excellent antibacterial activity according to the works of Liu et al.56 with a percentage of bacterial inhibition of 92%.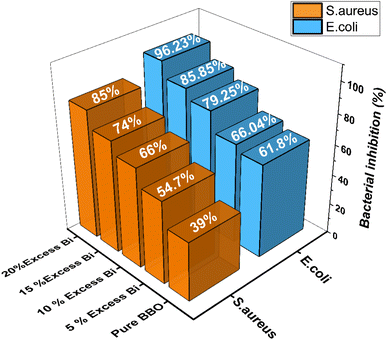 | ||
| Fig. 13 Bacterial inhibition (%) of pure BBO and BBO with different excess Bi (%) against E. coli and S. aureus. | ||
At a Bi 20% surplus, the bacteria showed the strongest antibacterial action. Compared to the other microorganisms utilized in the experiment, Bi%–BBO (Bi 20%) demonstrated the strongest antibacterial activity against S. aureus. This may be explained by the absence of exterior lipids, which all Gram-positive bacteria possess and protect the cell wall, making them the most vulnerable in contrast to Gram-negative bacteria.47
4. Conclusion
Herein, a sol–gel process was used to prepare BaBiO3 nanoparticles. The structural, morphological, and optical properties of the as-synthesized material were successively studied. The XRD analysis revealed the formation of a monoclinic structure of BaBiO3 and the existence of a secondary BaCO3 phase in all the Bi%–BBO samples (BaBiO3–BaCO3). 20% Bi–BBO exhibited a higher specific surface area than 0% Bi–BBO. Furthermore, the series of Bi%–BBO showed enhanced photocatalytic activity, where the highest degradation rate was exhibited by 15% Bi%–BBO (73%). The synthesized BBO exhibited antibacterial activity against Gram-positive and Gram-negative, where the highest antibacterial activity was found against S. aureus (96.23%). In addition, strong antioxidant effects were observed against the DPPH radical (89%). Therefore, the synthesis of BBO with differing excess of Bi resulted in the formation of a BBO–BCO binary composite. The successful application of BBO–BCO nanoparticles in the treatment of polluted water, as well as their efficacy for numerous medical applications have been proven.Conflicts of interest
There are no conflicts to declare.References
- S. Larsson, M. Jansson and Å. Boholm, J. Nanopart. Res., 2019, 21, 1–17 CrossRef.
- M. Nasrollahzadeh, M. Atarod, M. Sajjadi, S. M. Sajadi and Z. Issaabadi, Interface Sci. Technol., 2019, 28, 199–322 CAS.
- M. Knell, Nanotechnology and the Challenges of Equity, Equality and Development, 2010, pp. 127–143 Search PubMed.
- S. Linic, U. Aslam, C. Boerigter and M. Morabito, Nat. Mater., 2015, 146, 567–576 CrossRef PubMed.
- R. Darabi, F. E. D. Alown, A. Aygun, Q. Gu, F. Gulbagca, E. E. Altuner, H. Seckin, I. Meydan, G. Kaymak, F. Sen and H. Karimi-Maleh, Int. J. Hydrogen Energy, 2023, 48, 21270–21284 CrossRef CAS.
- S. T. Khan, J. Musarrat and A. A. Al-Khedhairy, Colloids Surf., B, 2016, 146, 70–83 CrossRef CAS PubMed.
- S. Kaushal, S. S. Nanda, S. Samal and D. K. Yi, ChemBioChem, 2020, 21, 576–600 CrossRef CAS PubMed.
- M. T. Yaraki, S. Zahed Nasab, I. Zare, M. Dahri, M. Moein Sadeghi, M. Koohi and Y. N. Tan, Ind. Eng. Chem. Res., 2022, 61, 7547–7593 CrossRef CAS.
- A. Muthuvel, M. Jothibas and C. Manoharan, Nanotechnol. Environ. Eng., 2020, 5, 1–19 CrossRef.
- A. Muthuvel, M. Jothibas and C. Manoharan, J. Environ. Chem. Eng., 2020, 8, 103705 CrossRef CAS.
- S. Zeghoud, H. Hemmami, B. Ben Seghir, I. Ben Amor, I. Kouadri, A. Rebiai, M. Messaoudi, S. Ahmed, P. Pohl and J. Simal-Gandara, Mater. Today Commun., 2022, 33, 104747 CrossRef CAS.
- H. Daneshvar, A. Tavakoli Kareshk, I. Sharifi, A. Keyhani, R. Tavakoli Oliaee and A. Asadi, Iran. J. Parasitol., 2018, 13, 515 Search PubMed.
- F. Ameen, A. Aygun, A. Seyrankaya, R. N. Elhouda Tiri, F. Gulbagca, İ. Kaynak, N. Majrashi, R. Orfali, E. N. Dragoi and F. Sen, Environ. Res., 2023, 220, 115231 CrossRef CAS PubMed.
- L. H. Mohammed, F. Gulbagca, R. N. E. Tiri, A. Aygun, M. Bekmezci and F. Sen, Chem. Eng. J. Adv., 2023, 14, 100495 CrossRef CAS.
- R. Darabi, H. Karimi-Maleh, S.-A. Shahidi, F. Gulbagca, R. Nour Elhouda Tiri, A. Monadi Sefidan, N. Dehdashtian, W. Alhrasishawi, A. Aygun, E. Esra Altuner and F. Sen, Fuel, 2023, 352, 128841 CrossRef CAS.
- A. Aridi, D. Naoufal, H. El-Rassy and R. Awad, Chem. Afr., 2023, 1–14 Search PubMed.
- A. L. Jadhav and S. M. Khetre, Int. Nano Lett., 2020, 10, 23–31 CrossRef CAS.
- R. Scholder, K. -W Ganter, H. Gläser and G. Merz, Zeitschrift für anorganische und allgemeine Chemie, 1963, 319, 375–386 CrossRef CAS.
- K. V. Shilna, S. C. Sahoo and K. J. Thomas, Appl. Mater. Today, 2022, 27, 101427 CrossRef.
- C. Chaillout, A. Santoro, J. P. Remeika, A. S. Cooper, G. P. Espinosa and M. Marezio, Solid State Commun., 1988, 65, 1363–1369 CrossRef CAS.
- N. V. Barkovskii, Russ. J. Gen. Chem., 2019, 892, 173–184 CrossRef.
- R. P. S. M. Lobo and F. Gervais, Phys. Rev. B: Condens. Matter Mater. Phys., 1995, 52, 13294 CrossRef CAS PubMed.
- A. S. Chouhan, E. Athresh, R. Ranjan, S. Raghavan and S. Avasthi, Mater. Lett., 2018, 210, 218–222 CrossRef CAS.
- D. E. Cox and A. W. Sleight, Acta Crystallogr., Sect. B: Struct. Sci., 1979, 35, 1–10 CrossRef.
- R. P. S. M. Lobo and F. Gervais, Solid State Commun., 1996, 98, 61–63 CrossRef CAS.
- R. Bhargava, S. Khan, N. Ahmad and M. M. N. Ansari, AIP Conf. Proc., 2018, 1953, 030034 CrossRef.
- M. B. Tahir, M. Sohaib, M. Sagir and M. Rafique, Encyclopedia of Smart Materials, 2022, 578 Search PubMed.
- Q. Guo, Y. Huang, H. Xu, D. Luo, F. Huang, L. Gu, Y. Wei, H. Zhao, L. Fan and J. Wu, Solid State Sci., 2018, 78, 95–106 CrossRef CAS.
- A. W. Sleight, Phys. C, 2015, 514, 152–165 CrossRef CAS.
- J. Ge, W. J. Yin and Y. Yan, Chem. Mater., 2018, 30, 1017–1031 CrossRef CAS.
- J. Tang, Z. Zou and J. Ye, J. Phys. Chem. C, 2007, 111, 12779–12785 CrossRef CAS.
- S. Jain, K. Sharma and U. Chandrawat, Iran. J. Energy Environ., 2016, 7(1), 64–71 CAS.
- K. Sharma, S. Jain and U. Chandrawat, Iran. J. Energy Environ., 2016, 7, 274–281 CAS.
- J. Gao, W. Zeng, B. Tang, M. Zhong and Q. J. Liu, Chem. Phys. Lett., 2020, 761, 138054 CrossRef CAS.
- M. Khraisheh, A. Khazndar and M. A. Al-Ghouti, Int. J. Energy Res., 2015, 39, 1142–1152 CrossRef CAS.
- W. Jaidee, W. Maneerat, R. J. Andersen, B. O. Patrick, S. G. Pyne and S. Laphookhieo, Fitoterapia, 2018, 130, 219–224 CrossRef CAS PubMed.
- F. Djani, M. Omari and A. Martínez-Arias, J. Sol-Gel Sci. Technol., 2016, 78, 1–10 CrossRef CAS.
- N. Hashemi, H. Q. Alijani, F. Mousazadeh, S. Rahi, S. Darijani, F. Sharifi, H. Khalili, S. Iravani, F. Borhani, N. Zafarnia and M. Khatami, Bioprocess Biosyst. Eng., 2021, 44, 1957–1964 CrossRef CAS PubMed.
- U. Holzwarth and N. Gibson, Nat. Nanotechnol., 2011, 69, 534 CrossRef PubMed.
- H. Fodil and M. Omari, J. Inorg. Organomet. Polym. Mater., 2017, 27, 1473–1481 CrossRef CAS.
- M. S. Martín-González, J. García-Jaca, E. Morán and M. Á. Alario-Franco, Phys. C, 1998, 297, 185–191 CrossRef.
- V. N. Sonkusare, R. G. Chaudhary, G. S. Bhusari, A. R. Rai and H. D. Juneja, Nano-Struct. Nano-Objects, 2018, 13, 121–131 CrossRef CAS.
- T. Shahid, M. Arfan, A. Zeb, T. Bibi and T. M. Khan, Nanomater. Nanotechnol., 2018, 8 DOI:10.1177/1847980418761775.
- F. Legesse, K. Sreenu, S. Kena and K. Legesse, Sci., Technol. Arts Res. J., 2015, 4, 80 CrossRef CAS.
- D. S. Shtarev, A. V. Shtareva, R. Kevorkyants, M. S. Molokeev and N. Serpone, Photochem. Photobiol. Sci., 2021, 20, 1147–1160 CrossRef CAS PubMed.
- T. T. Lee, C. Y. Huang, C. Y. Chang, I. K. Cheng, C. L. Hu, C. Te Lee and M. Fujimoto, J. Mater. Res., 2012, 27, 2495–2502 CrossRef CAS.
- R. Strobel, M. Maciejewski, S. E. Pratsinis and A. Baiker, Thermochim. Acta, 2006, 445, 23–26 CrossRef CAS.
- S. Yurdakal, C. Garlisi, L. Özcan, M. Bellardita and G. Palmisano, Heterogeneous Photocatalysis: Relationships with Heterogeneous Catalysis and Perspectives, 2019, pp. 87–152 Search PubMed.
- P. C. Bhomick, A. Supong, S. Kumar, A. I. Sema, T. Merry and D. Sinha, Water Conservation Science and Engineering, 2023, 8, 1–15 CrossRef.
- J. Huang, A. R. Zimmerman, H. Chen and B. Gao, Environ. Pollut., 2020, 258, 113809 CrossRef CAS PubMed.
- A. I. Sema and J. Bhattacharyya, J. Indian Chem. Soc., 2022, 99, 100791 CrossRef CAS.
- B. Ohtani, J. Photochem. Photobiol., C, 2010, 11, 157–178 CrossRef CAS.
- M. Madhukara Naik, H. S. Bhojya Naik, G. Nagaraju, M. Vinuth, K. Vinu and R. Viswanath, Nano-Struct. Nano-Objects, 2019, 19, 100322 CrossRef CAS.
- V. Gupta and S. Singh, Chemistry of Inorganic Materials, 2023, 1, 100008 CrossRef.
- T. L. Yusuf, B. O. Orimolade, D. Masekela, B. Mamba and N. Mabuba, RSC Adv., 2022, 12, 26176–26191 RSC.
- Q. Liu, J. Li, X. Zhong, Z. Dai, Z. Lu, H. Yang and R. Chen, Adv. Powder Technol., 2018, 29, 2082–2090 CrossRef CAS.
Footnote |
| † Electronic supplementary information (ESI) available. See DOI: https://doi.org/10.1039/d3ra06354b |
| This journal is © The Royal Society of Chemistry 2024 |


