 Open Access Article
Folate conjugated albumin as a targeted nanocarrier for the delivery of fisetin: in silico and in vitro biological studies†
Raghu Solanki a,
Amit Kumar Srivastavb,
Sejal Patela,
Sanju Kumari Singha,
Bhavana Jodhaa,
Umesh Kumarbc and
Sunita Patel
 *a
*a
aSchool of Life Sciences, Central University of Gujarat, Gandhinagar 382030, India. E-mail: sunitap@cug.ac.in
bSchool of Nano Sciences, Central University of Gujarat, Gandhinagar 382030, India
cNutrition Biology Department, School of Interdisciplinary and Applied Sciences, Central University of Haryana, Mahendergarh 123031, India
First published on 1st March 2024
Abstract
Fisetin (FST), a natural flavonoid compound derived from various fruits and vegetables, including apple, strawberry, and onion, demonstrates potential for a wide range of pharmaceutical applications, including potential anticancer properties. However, challenges such as low bioavailability, poor aqueous solubility, and limited permeability restrict the use of FST in the pharmaceutical sector. Nowadays, targeted nanomedicines have garnered attention to overcome limitations associated with phytochemicals, including FST. In the present study, we have designed and successfully prepared folate-targeted FST nanoparticles (FFNPs). Characterization through DLS and FE-SEM revealed the successful preparation of monodisperse (PDI: 0.117), nanoscale-sized (150 nm), and spherical nanoparticles. Physicochemical characterization including FTIR, XRD, DSC, and TGA analysis, confirmed the encapsulation of the FST within the Folic acid (FA) – conjugated nanoparticles (CNPs) and revealed its amorphous nature. Molecular docking analysis revealed the strong binding affinity and specific amino acid interactions involved in the BSA–FST–FA complex, suggesting the potential synergistic effect of FST and FA in enhancing the therapeutic activity of the FFANPs. Cytotoxic assessments by the MTT assay, migration assay, AO-EtBr staining assay, colony formation assay, and cellular uptake study demonstrated enhanced anticancer efficacy, apoptosis induction, and enhanced uptake of FFNPs compared to pure FST. These findings propose prepared FFNPs as a promising targeted drug delivery nanocarrier for effective FST delivery in cancer therapy.
1. Introduction
Cancer is the deadliest disease and causes major mortality worldwide. According to the International Agency for Research on Cancer (IARC), 19.3 million incidence cases and 10 million deaths were reported in 2020 globally.1 For several decades, chemotherapy has been a mainstay in the treatment of various cancers.2 But still faces challenges including multidrug resistance,3 non-selectivity between healthy and cancer tissue4 and cytotoxic side effects such as hepatotoxicity,5 cardiotoxicity,6 neurotoxicity,7 nephrotoxicity8 etc. are remaining challenges for chemotherapeutic drugs. Naturally available plant-derived phytoconstituents have gained therapeutic interest due to their beneficial pharmacological properties including anticancer activity and lower toxicity.Fisetin (FST), a natural flavonoid compound, is found in various fruits and vegetables, such as strawberries, apples, persimmons, grapes, onions, and cucumbers.9 FST possesses health beneficiary properties such as anti-oxidant,10 anti-inflammatory,11 anti-microbial,12 neuroprotective,13 hepatoprotective,14 anti-obesity,15 anti-depressant16 and anti-cancer effects.17,18 Studies revealed that FST exerts anti-cancer activity via inhibiting the cell growth,19 invasion,20 migration21 and inducing cell cycle arrest22 and apoptosis.23 In spite of having such promising anti-cancer properties, its use in pharmaceuticals is limited due to limitations such as low oral bioavailability, poor aqueous solubility, short half-life and poor permeability.24 To overcome these limitations of FST, nano-drug delivery systems could be an alternative approach.
Nowadays, various nanomaterials have been used for delivery of therapeutic drugs to tumor site.25 Among different nanomaterials such as liposome, metallic, dendrimers, polymers, hydrogels and so forth, protein-based nanocarriers are actively used in pharmaceutical science.26,27 Albumin proteins are versatile nanocarriers and have advantageous properties like biocompatibility, biodegradability, non-immunogenic, non-toxicity and high drug-binding capacity.28,29 Abraxane is an example for the FDA-approved albumin-based innovation for cancer treatment.30 Studies have shown albumin's potential as a nanocarrier for the delivery of berberine,31 piperlongumine,32 ginsenoside compound K,33 teniposide,34 niclosamide,35 silibinin,36 imatinib37 and paclitaxel.38
Further, targeted nanomedicines have emerged as potential solutions to delivery of hydrophobic anticancer molecules which enhance the effectiveness of therapeutic drugs and reducing side effects.39–41 These systems provide the advantages of increased aqueous solubility, controlled drug release and site-specific drug delivery.42,43 Various ligands such as small molecules (folic acid, phenylboronic acid), peptides (RGD), proteins (antibodies, transferrin), polysaccharides (hyaluronic acid), aptamers have been employed to achieve targeted nanomedicines.44 Folic acid (FA) (also known as folate or vitamin B9) is widely used for the functionalization of various nano-drug delivery systems.45,46 FA-functionalized nanocarriers specifically target folate receptor alpha (FRα), which is highly overexpressed on the surface of many cancer cells.47,48 In this study, folate-conjugated bovine serum albumin (BSA) nanoparticles were investigated as a promising delivery platform for FST, aiming to enhance its efficacy and targeted delivery for cancer treatment.
2. Experimental section
2.1 Materials
Folic acid (FA), N-hydroxy succinimide (NHS), Bovine Serum Albumin (BSA) (98%, 66 kDa), Ethanol, 1-ethyl-3-(3-dimethylaminopropyl) carbodiimide hydrochloride (EDC⋅HCL), Chloroform, Ethidium Bromide (EtBr), Coumarine-6 (C6), 3-(4,5-dimethylthiazol-2-yl)-2,5-diphenyl tetrazolium bromide (MTT), Dimethyl Sulfoxide (DMSO) and Acridine Orange (AO) were procured from Sigma Aldrich (Saint Louis, MO, USA). 0.25% Trypsin EDTA, Fetal Bovine Serum (FBS) and Minimum Essential Medium (MEM) were obtained from Thermo-fisher Scientific (Waltham, MA, USA). HeLa cell line was purchased from National Centre for Cell Science (NCCS, Pune, India).2.2 Preparation of folic acid conjugated albumin nanoparticles (CNPs)
CNPs were synthesized by using the carbodiimide coupling reaction. Briefly, 10 mg FA, 20 mg EDC⋅HCL and 3 mg NHS were dissolved in 5 ml ethanol. NHS and EDC⋅HCL act as cross-linker which activates the carboxyl group of FA and forms amide bond between carboxyl group of FA and amine group of BSA. In a Round Bottle flask, FA solution was poured and stirred continuously on magnetic stirrer for 3 h in dark condition. Then, 100 mg BSA was dissolved in 10 ml Milli-Q water added in above prepared FA solution and reaction was kept for 12 h in dark condition with continuous stirring. After completion of 12 h, the solution was transferred to a dialysis bag and subjected to dialysis against Milli-Q water for 24 h under dark conditions with continuous stirring at 100 rpm. Prepared CNPs was then lyophilized for further use.2.3 Preparation of fisetin loaded CNPs (FFANPs)
For the preparation of FFANPs, desolvation method was used as per previously reported.49 Briefly, 10 mg of CNPs were dissolved in 2 ml of Milli-Q water and stirred for 30 min. Then, 2 mg of FST was dissolved in 4 ml ethanol and added in CNPs solution dropwise manner with continuous stirring. After 24 h, the prepared nanoparticles underwent three rounds of centrifugation at 10![[thin space (1/6-em)]](https://www.rsc.org/images/entities/char_2009.gif) 000 rpm for 10 min each, followed by 5 min of sonication. Subsequently, the nanoparticles were washed with the original volume of Milli-Q water. Purified nanoparticle was lyophilized for further use. The identical procedure was employed for the synthesis of FST loaded BSA-NPs (FNPs), with the exception of utilizing CNPs instead of pure BSA.
000 rpm for 10 min each, followed by 5 min of sonication. Subsequently, the nanoparticles were washed with the original volume of Milli-Q water. Purified nanoparticle was lyophilized for further use. The identical procedure was employed for the synthesis of FST loaded BSA-NPs (FNPs), with the exception of utilizing CNPs instead of pure BSA.
2.4 Characterization of CNPs and FFANPs
| EE% = (the initial amount of FA ‒ free form of FA)/(the initial amount of FA) × 100 |
2.5 Estimation of drug content
Encapsulation of FST within FFANPs and drug content was estimated using UV-vis spectroscopy. Drug encapsulation efficiency (EE%) and loading capacity (LC%) were calculated using the following formula:2.6 Molecular docking study
To examine the molecular interactions between BSA and FST with and without the presence of FA, molecular study was done. AutoDock v4.2 (https://autodock.scripps.edu/) with the Lamarckian genetic algorithm was utilized for the docking analysis.51 This algorithm facilitates the exploration of conformational space and prediction of binding poses and affinities between ligands and receptors. The BSA structure (PDB ID: 3V03) was obtained from the Protein Data Bank (PDB). Structure of FST was converted into PDB format using PyMOL software. Open Babel software was employed to convert the ligand structure from 2D to 3D, followed by optimization using UCSF Chimera software. The docking calculations were performed to explore the conformational space and predict the binding affinity. Subsequently, the docking results were analyzed, and the docked conformations with the highest binding affinities were selected for further investigation. The visual analysis and examination of the docked complexes were conducted using PyMOL, UCSF Chimera, LigPlot+ v2.2.4, and Discovery Studio 2020.2.7 MD simulation study
MD simulation study was conducted to explore the dynamic behavior and stability of the BSA–FST complex in the presence of FA. The GROMACS software package, specifically GROMACS v2022, was employed for the MD simulations. The simulation process involved two stages of equilibration. Firstly, an NVT ensemble simulation was performed to control the system's temperature. The NVT simulation was conducted for an appropriate duration, typically tens of picoseconds, to allow the system to equilibrate at the desired temperature. After NVT equilibration, an NPT ensemble simulation was carried out, controlling both temperature and pressure. A barostat algorithm, such as the Parrinello–Rahman or Berendsen barostat, was employed to maintain the pressure within the desired range (e.g., 1 bar). Once equilibration was achieved, production MD simulations were conducted for a total duration of 100 ns. A suitable time step in the order of femtoseconds was chosen for stable and accurate integration of the equations of motion using the leap-frog Verlet algorithm. Trajectory output files were saved at regular intervals to record atomic coordinates and velocities throughout the simulation. Analysis of the MD trajectories, including the monitoring of system properties, ligand–receptor interactions, conformational changes, and stability, was performed using various tools available within the GROMACS software package. The MD simulations using GROMACS provided insights into the dynamic behavior and stability of the BSA–FST complex in the presence of FA over the 100 ns simulation time. The employed NVT and NPT ensembles, coupled with the OPLS-AA/L all-atom force field, ensured an accurate description of interatomic interactions and system properties.2.8 Cell culture
In vitro anticancer activity of FFANPs was evaluated against human cervical HeLa cells. Cells were maintained in MEM supplemented with 10% FBS and incubated in a 5% CO2 condition at 37 °C. Cells were observed regularly and after reaching up to 80% to 90%, anticancer studies were performed.2.9 Assessment of anticancer activity of prepared FFANPs
In vitro cytotoxic effects of FFANPs against HeLa cells was assessed using MTT Assay. 7.0 × 10³ cells per well were cultured in 96-well plates. Next day, cells were treated with the different concentration (0.625, 1.25, 2.5, 5, 10, 20 and 40 µg ml−1) of CNPs, FST, drug loaded non-functionalized nanoparticles (FNPs), and drug loaded functionalized nanoparticles (FFANPs) for 24 h and 48 h. Then, cells were incubated with MTT reagent for 4 h and formazan crystals were dissolved by adding DMSO for 15 min. The absorbance was measured at 570 nm using a multimode ELISA plate reader (Synergy H1, USA), and the percentage of cell viability was determined using the following equation.Morphology of cells was also observed after treatment with FST, FNPs, and FFANPs at 10 µg ml−1 concentration for 24 h and 48 h.
2.10 Migration assay
Cell migration plays a crucial role in tumor progression and metastasis.52 The impact of FST, FNPs, and FFANPs on cell migration was assessed through a scratch assay. In this assay, cells were seeded in 12-well plates and allowed to form a confluent monolayer. A scratch was created in the cell monolayer using a sterile pipette tip, generating a wound area. Subsequently, the cells were treated with FST, FNPs, and FFANPs at 10 µg ml−1 concentration. Images of the wound area were captured after 24 h and 48 h treatment. The degree of cell migration into the scratch area was quantified by measuring wound closure through ImageJ analysis software.2.11 Apoptotic evaluation of FFANPs
The AO-EtBr staining assay was conducted to assess apoptosis in HeLa cells treated with FFANPs. Cells were seeded in 12-well plates and exposed to a 10 µg ml−1 concentration of CNPs, FST, FNPs, and FFANPs for 24 h. Following the incubation, cells were rinsed with PBS and incubated with a mixture of acridine orange and ethidium bromide (each at a concentration of 100 µg ml−1). Acridine orange stains live and apoptotic cells in green, while ethidium bromide stains late apoptotic and necrotic cells in red.53 The stained cells were visualized using a Confocal Scanning Laser Microscope (CSLM, LSM-710, Germany), and images were captured.2.12 Colony formation assay
The colony formation assay was conducted to assess the anti-tumor efficacy of FFANPs. A total of 700 cells per well were seeded in 6-well plates and exposed to a 10 µg ml−1 concentration of CNPs, FST, FNPs, and FFANPs for one week. Following the incubation period, cells were washed with PBS, fixed with ethanol![[thin space (1/6-em)]](https://www.rsc.org/images/entities/char_2009.gif) :
:![[thin space (1/6-em)]](https://www.rsc.org/images/entities/char_2009.gif) glacial acetic acid (95
glacial acetic acid (95![[thin space (1/6-em)]](https://www.rsc.org/images/entities/char_2009.gif) :
:![[thin space (1/6-em)]](https://www.rsc.org/images/entities/char_2009.gif) 5), and stained with 2% crystal violet. The number of colonies was counted using a microscope, and images were captured. Colony formation efficiency was calculated by dividing the number of colonies formed in the treated wells by the number of colonies in the control wells.
5), and stained with 2% crystal violet. The number of colonies was counted using a microscope, and images were captured. Colony formation efficiency was calculated by dividing the number of colonies formed in the treated wells by the number of colonies in the control wells.
2.13 Cellular uptake study
Efficient cellular uptake is crucial for targeted drug delivery systems to achieve maximum therapeutic efficacy. To assess uptake of synthesized FNPs and FFANPs by HeLa cells, cellular uptake study was carried out. Coumarin-6 (C6) dye was selected as a fluorescent marker to track the internalization of the nanoparticles in cancer cells. C6 loaded BSA NPs (C6NPs) and C6 loaded FA conjugated BSA NPs (C6FANPs) were prepared using same protocols used during drug loaded non-targeted and targeted nanoparticles. Then, cells were seeded in 35 mm culture plates at an appropriate cell density and allowed to adhere overnight. The cells were then treated with free C6 dye, C6NPs and C6FANPs at equivalent concentrations. After a specific incubation period, the cells were rinsed with PBS and cellular uptake was analyzed using CSLM. The quantitative cellular uptake analysis was conducted using ImageJ software.2.14 Statistical analysis
The experiments were conducted in triplicate, and the results were presented as mean ± standard deviation (S.D). Quantification and graph preparation were performed using Origin (Version 2017) and GraphPad Prism (Version 8.0) software. Significance differences between groups were calculated using One-way ANOVA.3. Results and discussion
3.1 Preparation of folate conjugated fisetin loaded albumin nanoparticles (FFANPs)
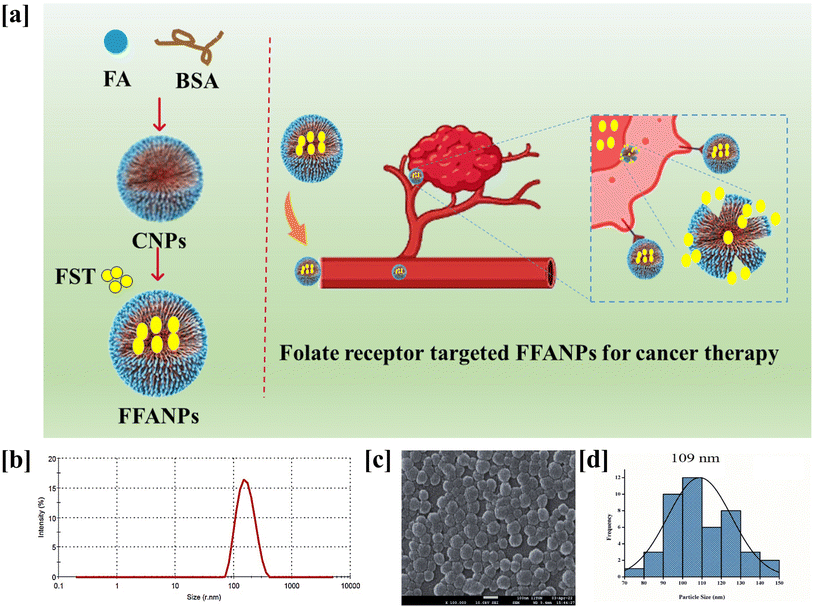
CNPs and FFANPs were successfully prepared using the desovation method. Fig. 1a represents the preparation of FFANPs. Prepared nanoparticles were characterized using various techniques and in vitro anticancer activity was explored in folate receptor positive cervical cancer cell line (HeLa cells). The size, shape, and morphology of any nano systems are crucial parameters with respect to internalization by cancer cells.54 Thus, we have assessed these parameters using DLS and FESEM analysis.The hydrodynamic particle size of the FFANPs was determined by DLS and it was found to be 150 nm (Fig. 1b). The particle size of FFANPs was larger than CNPs (126 nm) and FNPs (141 nm) revealed the encapsulation of drug and conjugation with FA (Fig. S1†). Fig. 1c confirmed that the FFANPs exhibited a spherical shape and displayed a smooth morphology, as observed through FE-SEM analysis. Further, particle size distribution was calculated using ImageJ software and it was measured to be 109 nm (Fig. 1d). The particle size of the nanoparticles, as determined by FE-SEM analysis, was found to be smaller compared to the size obtained by DLS. In DLS, the size distribution of the nanoparticles was assessed in an aqueous solution, while for FE-SEM analysis, lyophilized nanoparticles were utilized. The observed larger size of the nanoparticles in DLS could be attributed to the presence of water molecules surrounding the particles during the measurement. The EE% and LC% were measured to be 92.36% ± 3.84 and 8.39% ± 3.04 (Table 1).
| NPs | Size (nm) | PDI | EE% | LC% |
|---|---|---|---|---|
| CNPs | 126 ± 1.86 | 0.167 ± 0.06 | — | — |
| FNPs | 141 ± 0.71 | 0.138 ± 0.37 | 87.94 ± 2.08 | 7.99 ± 2.16 |
| FFANPs | 150 ± 1.07 | 0.117 ± 0.80 | 92.36 ± 3.84 | 8.39 ± 3.04 |
3.2 Characterization of FFANPs using UV, FTIR, XRD, DSC and TGA analysis
To confirm the encapsulation of FST within the prepared nanoparticles, UV, FTIR and XRD analysis were conducted. Fig. S2† represents the UV spectrum of pure FA, pure FST, pure BSA, CNPs and FFANPs. During UV visible spectrum analysis, the UV spectrum of the pure compounds were shifted in FFANPs suggesting the conjugation of FA with BSA and encapsulation of FST within nanoparticles. Furthermore, the amount of FA conjugated with BSA was determined using UV analysis and it was found to be 94.64% ± 1.07 (Fig. S3†) which implies a significant conjugation of FA with BSA.Fig. 2a demonstrates the FTIR spectra of FA, FST, BSA, CNPs and FFANPs. The BSA spectrum exhibited significant peaks at 1643 cm−1 and 1515 cm−1, indicating the presence of amide bond I and II.31 FA exhibited characteristic peaks including 3562 cm−1, 1692 cm−1, 1604 cm−1, 1487 cm−1, O–H stretching, C![[double bond, length as m-dash]](https://www.rsc.org/images/entities/char_e001.gif) O stretching of acid group,
O stretching of acid group, ![[double bond, length as m-dash]](https://www.rsc.org/images/entities/char_e001.gif) O stretching of amide group and C
O stretching of amide group and C![[double bond, length as m-dash]](https://www.rsc.org/images/entities/char_e001.gif) C stretching, respectively. Other characteristics peaks were observed at 1409 cm−1, 1338–1196 cm−1, and 1040–685 cm−1 representing the C–O stretching and C–H bending, respectively.53 FST displayed characteristic absorptions at 3467 cm−1, 1634 cm−1, 1505 cm−1, 1227 cm−1, and 1104 cm−1, confirming the presence of specific structural groups of FST such as O–H stretching, C
C stretching, respectively. Other characteristics peaks were observed at 1409 cm−1, 1338–1196 cm−1, and 1040–685 cm−1 representing the C–O stretching and C–H bending, respectively.53 FST displayed characteristic absorptions at 3467 cm−1, 1634 cm−1, 1505 cm−1, 1227 cm−1, and 1104 cm−1, confirming the presence of specific structural groups of FST such as O–H stretching, C![[double bond, length as m-dash]](https://www.rsc.org/images/entities/char_e001.gif) N stretching, aromatic C
N stretching, aromatic C![[double bond, length as m-dash]](https://www.rsc.org/images/entities/char_e001.gif) C vibrations, and sulfate ions. In FFANPs, significant peaks were observed at 1648 cm−1 and 1528 cm−1, indicating the existence of amide I and amide II bonds from BSA. Characteristic peaks such as 1338–1196 cm−1 and 1040–685 cm−1 confirm FA conjugation as well. Significant peaks at 1233 cm−1 and 1100 cm−1 confirm the presence of sulfate ions from FST. Overall, the FTIR data confirm the successful encapsulation of FST within the CNPs.
C vibrations, and sulfate ions. In FFANPs, significant peaks were observed at 1648 cm−1 and 1528 cm−1, indicating the existence of amide I and amide II bonds from BSA. Characteristic peaks such as 1338–1196 cm−1 and 1040–685 cm−1 confirm FA conjugation as well. Significant peaks at 1233 cm−1 and 1100 cm−1 confirm the presence of sulfate ions from FST. Overall, the FTIR data confirm the successful encapsulation of FST within the CNPs.
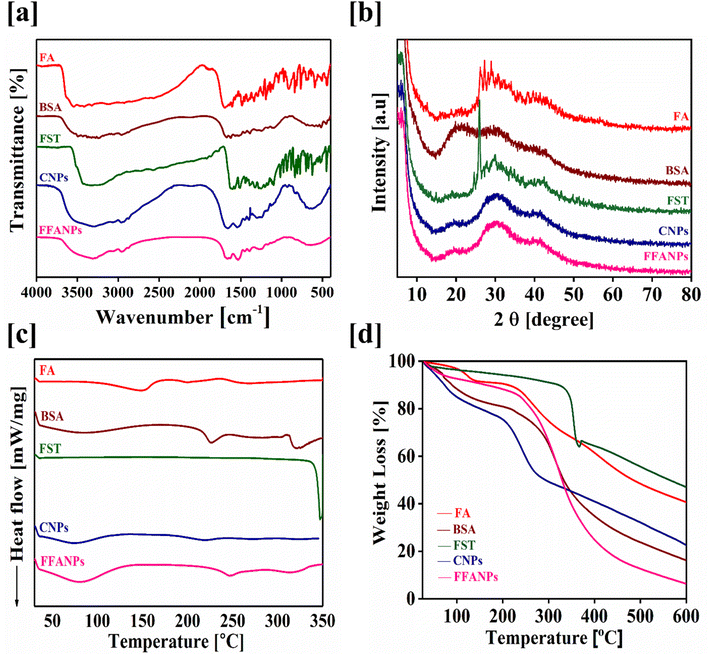 | ||
| Fig. 2 Physicochemical characterization of FFANPs. FTIR spectra (a), XRD patterns (b), DSC thermograms (c) and TGA thermograms (d) of pure FA, pure BSA, pure FST, CNPs and FFANPs. | ||
XRD analysis was also conducted to determine the physical state of FFANPs. Fig. 2b displays the powder XRD diffractograms of FA, FST, BSA, CNPs, and FFANPs. FA and FST exhibit sharp peaks, indicating their crystalline nature. However, after the encapsulation of FST in nanoparticles, the sharp peaks of FST disappeared as shown in XRD patterns of FFANPs, implying that FST was encapsulated within the nanoparticles in an amorphous form.
Fig. 2c represents the DSC thermograms of pure compounds and prepared nanoparticles. It was observed that FST exhibited an endothermic peak around 330 °C, while FFANPs showed only a single peak near 160 °C. This indicates that FST was entrapped amorphously within the nanocarrier. The reduction of crystallinity increases the amorphous property of the drug within nanoparticles. Further, thermal stability was confirmed using TGA analysis. Fig. 2d represents the TGA thermograms of pure compounds and prepared nanoparticles. The total %weight loss of FFANPs (94%) is higher than pure drug FST (53%), suggesting the amorphous nature of nanoparticles compared to free drug.
3.3 Molecular docking study
Fig. 3 demonstrated the molecular docking analysis, revealing the binding energies and specific amino acid interactions involved in the BSA/FST and BSA/FST/FA complexes. The detailed molecular docking score along with respective amino acid is shown in Table S1.† The BSA/FST complex exhibited a binding energy of −8.1 kcal mol−1, with notable interactions including hydrophobic interactions with GLU-125(A) and hydrogen bonding with LYS-136(A), LYS-350(B), VAL-481(B), and LEU-480(B). The BSA/FA complex showed a higher binding energy of −8.8 kcal mol−1, indicating a stronger affinity. The key interactions in this complex involved hydrogen bonding with TYR-149(A), GLU-152(B), GLN-220(B), HIS-287(B), GLU-339(B), TYR-340(B), and VAL-342(B), as well as hydrophobic and π interactions with TYR-156(A), LYS-187(A), ARG-194(A), and ARG-256(A).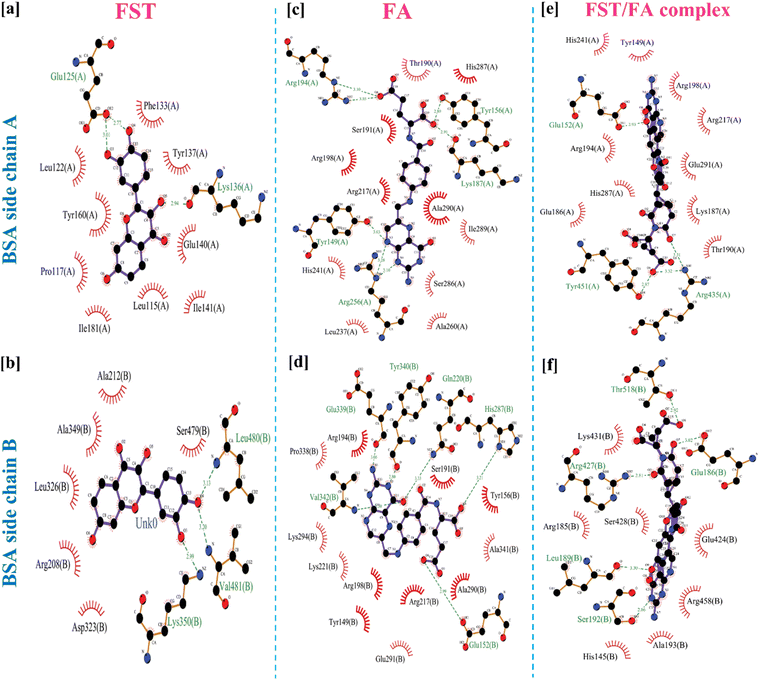 | ||
| Fig. 3 2D representation of molecular docked structure of BSA with FST (a and b), FA (c and d) and FST/FA complex (e and f). | ||
Furthermore, we investigated the combined BSA–FST–FA complex, which demonstrated the highest binding energy of −12.3 kcal mol−1. The interactions in this complex included hydrogen bonding with GLU-152(A), TYR-451(A), GLU-186(B), LEU-189(B), SER-192(B), ARG-427(B), and THR-518(B), as well as hydrophobic and π–cation interactions with ARG-435(A). The 3D structure of BSA and BSA/FA/FST is shown in figure for comparison analysis (Fig. S4†). The results of molecular docking analysis provide valuable insights into the binding affinities and specific amino acid interactions involved in the BSA–FST, BSA–FA and BSA–FST–FA complexes. The enhanced binding affinity observed in the presence of FA suggests a synergistic effect between BSA, FST, and FA. These finding suggested that the hydrogen bonding, hydrophobic, and π interactions were key interactions in FFANPs.
3.4 MD simulations study
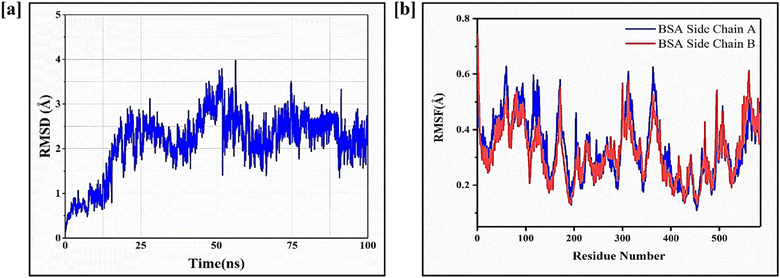
Molecular dynamics (MD) simulations were performed to investigate the conformational changes, stability, and binding energies of the BSA/FST/FA complex. The RMSD value of 2.3 Å indicated that the complex maintained its structural integrity throughout the simulation, suggesting stability (Fig. 4a). The RMSF plot revealed specific amino acid residues that exhibited increased fluctuations, indicating their involvement in dynamic interactions with FST (Fig. 4b).This suggests that FST induces conformational changes and interactions within the binding site of BSA. Further, the Ramachandran plot analysis assessed the backbone dihedral angles of the BSA/FST/FA complex (Fig. S5†). The majority of amino acid residues (91.6%) fell into the most favored regions, indicating a favorable protein backbone conformation. This suggests that the complex adopts a stable and preferred conformation. A small portion of residues (5.9%) occupied additional allowed regions, while a generously allowed region accounted for 1.9% of the residues. Only a minimal percentage (0.6%) was found in the disallowed regions, indicating overall structural stability (Table S2†). The free energy analysis using the MM-PB(GB)SA approach revealed a strong binding affinity between BSA, FST, and FA. The calculated binding free energy (ΔG) of −71.12 ± 0.07 kcal mol−1 indicated a favorable interaction (Table S3†). The individual energy components contributed to the overall stability of the complex. The electrostatic interaction energy (ΔEelectrostatic) was −39.28 ± 0.38 kcal mol−1, while the van der Waals interaction energy (ΔEvdw) was −46.87 ± 0.20 kcal mol−1. The solvation energy (ΔGGB) was 18.35 ± 0.52 kcal mol−1, and the surface area energy (ΔGSA) was −22.82 ± 0.87 kcal mol−1. The enthalpy (ΔH) was −35.77 ± 0.77 kcal mol−1, and the entropy (−TΔS) was 19.5 ± 0.33 kcal mol−1. These energy components collectively contributed to the stability and binding affinity of the BSA/FST/FA complex. In summary, the MD simulations demonstrated the stability of the BSA/Fisetin/Folic Acid complex with minimal conformational changes. The Ramachandran plot analysis indicated a favorable protein backbone conformation. The free energy analysis revealed a strong binding affinity between BSA, FST, and FA, suggesting a stable and energetically favorable interaction. These findings enhance our understanding of the complex behavior, structural stability, and molecular interactions of the BSA/FST/FA system, providing valuable insights for further applications in drug design and delivery.
3.5 FFANPs shows dose and time dependently cytotoxicity
For the determination of cytotoxicity of FFANPs on human cervical cancer cells, MTT assay was performed. As shown in Fig. 5a and b, CNPs have no cytotoxic effects on HeLa cells suggesting that prepared nanoparticles were biocompatible in nature. Cytotoxic effects of FST, FNPs and FFANPs increased in dose dependent and time dependent manner. However, FFANPs showed higher cytotoxicity compared to free FST and FNPs.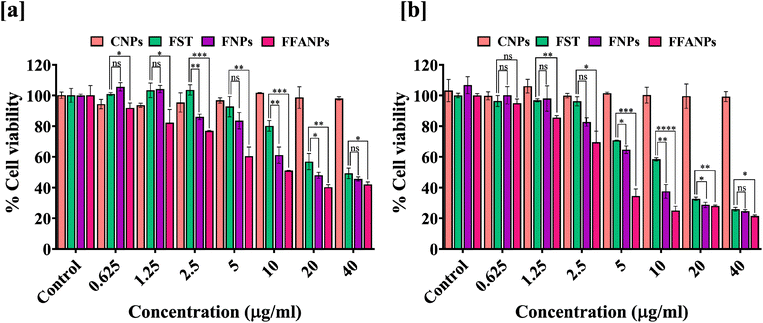 | ||
| Fig. 5 In vitro anticancer activity of FFANPs measured by MTT assay. %Cell viability of HeLa cells after treatment with CNPs, FST, FNPs, and FFANPs for 24 h (a) and 48 h (b). | ||
IC50 values after 24 h treatment, suggested that FFANPs (14.02 ± 0.54 µg ml−1) has lower IC50 values compared to FST (32.18 ± 3.35 µg ml−1) and FNPs (23.26 ± 1.24 µg ml−1) (Table 2). After 48 h treatment, IC50 values were also seen decreasing with FFANPs (5.54 ± 0.62 µg ml−1) compared to FST (13.38 ± 0.19 µg ml−1) and FNPs (9.75 ± 1.05 µg ml−1). This indicates that functionalized nanocarrier has more potential to kill cervical cancer cells in comparison to non-functionalized nanoparticles and free FST.
| Time | FST | FNPs | FFANPs |
|---|---|---|---|
| 24 h | 32.18 ± 3.35 µg ml−1 | 23.26 ± 1.24 µg ml−1 | 14.02 ± 0.54 µg ml−1 |
| 48 h | 13.38 ± 0.19 µg ml−1 | 9.75 ± 1.05 µg ml−1 | 5.54 ± 0.62 µg ml−1 |
Morphological changes were also observed after the treatment with FFANPs. At the 10 µg ml−1 concentration of drug (equivalent to nanoparticles), round cell morphology and cell shrinkage characteristics were observed in FST, FNPs and FFANPs treated cells. However, FFANPs treated cells have more round cells, cell shrinkage and cell bubbling were observed, suggesting higher anticancer activity of FFANPs compared to FST and FNPs (Fig. S6†).
3.6 FFANPs inhibits cell migration
The migration assay results revealed distinct effects of FST, FNPs and FFANPs on cell migration. As shown in Fig. 6, cells treated with FST exhibited limited inhibition of cell migration, with partial closure of the scratch area observed. FNPs showed a moderate inhibitory effect on cell migration, leading to a slower closure of the scratch area compared to the free drug. Remarkably, treatment with FFANPs significantly inhibited cell migration, resulting in a substantial delay in scratch area closure compared to both FST and FNPs. %Wound closure was calculated and it was observed that FFANPs (29.44% ± 1.50) had lower %wound closure compared to FST (50.83% ± 2.06) and FNPs (39.15 ± 0.39) (Fig. S7†).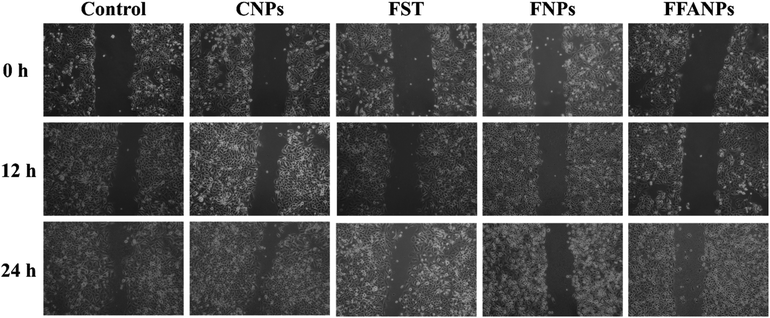 | ||
| Fig. 6 Migration assay. Cells were treated with 10 µg ml−1 concentration of CNPs, FST, FNPs and FFANPs for 12 h and 24 h. | ||
The results demonstrated that FFANPs exhibited significantly higher inhibition of cell migration compared to FST and FNPs. This enhanced inhibitory effect can be attributed to the targeted delivery achieved by FFANPs through folic acid conjugation.
3.7 Induction of apoptosis in HeLa cells by FFANPs
The AO-EtBr staining assay was performed to assess the apoptotic potential of FFANPs on cervical cancer cells. Fig. 7 represents CSLM images of HeLa cells after treatment with CNPs, FST, FNPs, and FFANPs for 24 h. The untreated control cells exhibited predominantly green fluorescence, indicating viable cells. CNPs treated cells also emit green fluorescence suggesting that prepared blank nanocarrier was biocompatible for cervical cancer cells.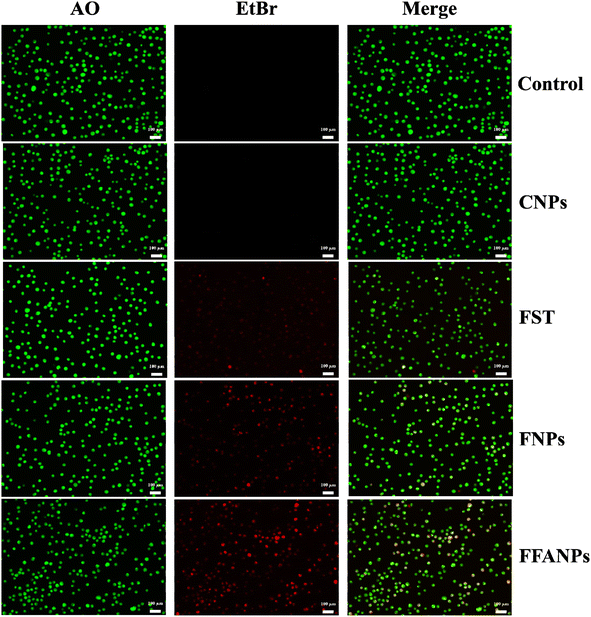 | ||
| Fig. 7 AO-EtBr staining assay. HeLa cells were treated with CNPs, FST, FNPs, and FFANPs at 10 µg ml−1 concentration for 24 h and CSLM images were captured after staining with AO-EtBr dyes. | ||
The cells treated with FST, FNPs, and FFANPs showed apoptotic and necrotic characteristics, characterized by orange-red or red fluorescence. Moreover, a maximum number of apoptotic cells with red fluorescence were observed in FFANPs treated cells, suggesting the high apoptotic effect of FFANPs compared to free FST and FNPs. AO-EtBr results were in-line with MTT results and demonstrated that FFANPs induced higher apoptosis compared to free drug and non-targeted nanoparticles in cervical cancer cells.
3.8 FFANPs inhibits colony forming activity of HeLa cells
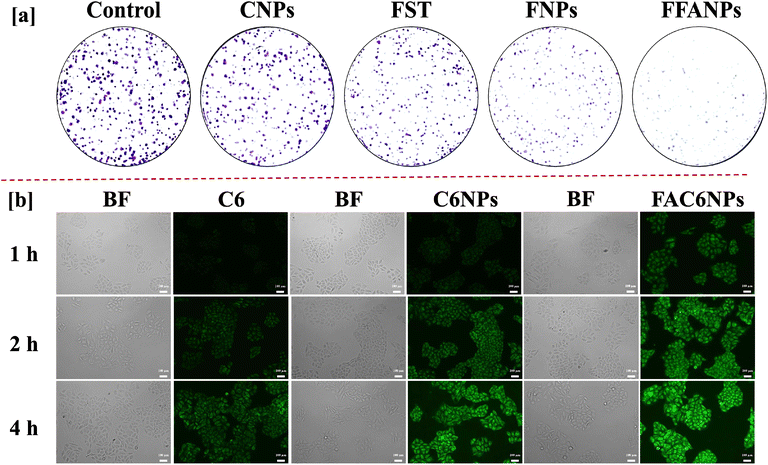
Fig. 8a represents colony inhibition after treatment with CNPs, FST, FNPs and FFANPs. The untreated control cells and CNPs treated cells exhibited a high number of well-formed colonies, indicating live and healthy cells. Cells treated with the FST, FNPs and FFANPs showed a reduction in colony formation compared to the control cells, indicating anti-tumor activity. However, the colony formation efficiency was significantly lower in cells treated with FFANPs compared to FST and FNPs. FFANPs exhibited a significant ability to inhibit colony formation in cancer cells, demonstrating their high anticancer activity compared to free drug and non-targeted nanoparticles.3.9 Folate receptor mediated cellular uptake of FFANPs by cervical cancer cells
The cellular uptake study revealed distinct differences in the internalization of free coumarin-6 dye (C6), non-targeted nanoparticles (C6NPs), and targeted nanoparticles (FAC6NPs). As shown in Fig. 8b, cells treated with free coumarin-6 dye showed relatively low fluorescence intensity, indicating limited cellular uptake. In contrast, cells treated with non-targeted nanoparticles exhibited slightly higher fluorescence, indicating non-specific uptake by the cells. Remarkably, cells treated with FAC6NPs displayed significantly higher fluorescence intensity, indicating enhanced cellular uptake compared to both free C6 and non-targeted nanoparticles. Furthermore, CTCF values were calculated for HeLa cells treated with C6, C6NPs, and FAC6NPs for 1 h, 2 h, and 4 h. The quantitative cellular uptake analysis suggests that targeted FAC6NPs were taken up more by cancer cells compared to non-targeted C6NPs and the free dye C6 (Fig. S8†). The targeted delivery achieved by FA conjugated nanocarrier was attributed to the specific binding of folic acid to the folate receptors overexpressed on cervical cancer cells (HeLa), facilitating their efficient internalization. Enhanced cellular uptake of FA conjugated nanocarrier could be a possible reason of higher anticancer activity and apoptosis compared to free drug and non-targeted nanoparticles.4. Conclusion
In the present study, FFANPs were successfully prepared and characterized as a targeted drug delivery system for delivery of FST in cervical cancer therapy. The FFANPs exhibited spherical shape with a hydrodynamic size of 150 nm. The encapsulation of FST within CNPs was confirmed through FTIR analysis. FFANPs has amorphous nature confirmed by XRD and DSC analysis. Molecular docking analysis revealed the strong binding affinity and specific amino acid interactions involved in the BSA–FST–FA complex, suggesting the potential synergistic effect of FST and FA in enhancing the therapeutic efficacy of the FFANPs. MD simulations demonstrated the structural stability of the complex throughout the simulation, with minimal conformational changes. The free energy analysis indicated a strong binding affinity between BSA, FST, and FA, further supporting the stability of the complex. In vitro studies demonstrated the cytotoxicity of FFANPs in a dose- and time-dependent manner, with significantly higher cytotoxicity observed compared to free FST and FNPs. FFANPs also exhibited potent inhibition of cell migration and induction of apoptosis in HeLa cells. The colony formation assay further confirmed the anti-tumor activity of FFANPs, with significantly reduced colony formation compared to free FST and FNPs. The enhanced cellular uptake of FFANPs in cervical cancer cells was attributed to the targeting effect of folic acid conjugation, which specifically binds to folate receptors overexpressed on the cancer cells. This targeted delivery mechanism contributes to the increased anticancer activity and apoptosis induction observed with FFANPs. Overall, the findings of this study highlight the potential of FFANPs as a promising nanocarrier system for the targeted delivery of FST in cervical cancer treatment.Conflicts of interest
The authors declare no conflict of interest.Acknowledgements
The authors thank the Central University of Gujarat, Gandhinagar and Central Instrumentation Facilities (CIF), Central University of Gujarat, Gandhinagar for providing necessary facilities and support. R. S. acknowledges the Council of Scientific and Industrial Research (CSIR SRF India) for the support, in the form of a research fellowship. A. K. S acknowledges the University Grant Commission (UGC NET), New Delhi for Ph.D. fellowship. S. S. and B. J. acknowledges the University Grant Commission (UGC), New Delhi for Ph.D. fellowships.References
- H. Sung, J. Ferlay, R. L. Siegel, M. Laversanne, I. Soerjomataram, A. Jemal and F. Bray, Ca-Cancer J. Clin., 2021, 71, 209–249 CrossRef PubMed.
- B. A. Chabner and T. G. Roberts Jr., Nat. Rev. Cancer, 2005, 5, 65–72 CrossRef CAS PubMed.
- K. Bukowski, M. Kciuk and R. Kontek, Int. J. Mol. Sci., 2020, 21, 3233 CrossRef CAS PubMed.
- S. Zahler, N. G. Ghazi and A. D. Singh, in Clinical Ophthalmic Oncology: Basic Principles, ed. A. D. Singh and B. E. Damato, Springer International Publishing, Cham, 2019, pp. 129–142 Search PubMed.
- P. D. King and M. C. Perry, Oncologist, 2001, 6, 162–176 CrossRef CAS PubMed.
- J.-J. Monsuez, J.-C. Charniot, N. Vignat and J.-Y. Artigou, Int. J. Cardiol., 2010, 144, 3–15 CrossRef PubMed.
- S. Taillibert, E. Le Rhun and M. C. Chamberlain, Curr. Neurol. Neurosci. Rep., 2016, 16, 1–14 CrossRef CAS PubMed.
- S. Gupta, I. Portales-Castillo, A. Daher and A. Kitchlu, Adv. Chronic Kidney. Dis, 2021, 28, 402–414 CrossRef PubMed.
- T. Rengarajan and N. S. Yaacob, Eur. J. Pharmacol., 2016, 789, 8–16 CrossRef CAS PubMed.
- A. F. Naeimi and M. Alizadeh, Trends Food Sci. Technol., 2017, 70, 34–44 CrossRef CAS.
- H.-H. Park, S. Lee, J.-M. Oh, M.-S. Lee, K.-H. Yoon, B. H. Park, J. W. Kim, H. Song and S.-H. Kim, Pharmacol. Res., 2007, 55, 31–37 CrossRef CAS PubMed.
- M. Gabor and E. Eperjessy, Nature, 1966, 212, 1273 CrossRef CAS PubMed.
- A. R. Ravula, S. B. Teegala, S. Kalakotla, J. P. Pasangulapati, V. Perumal and H. K. Boyina, Eur. J. Pharmacol., 2021, 910, 174492 CrossRef CAS PubMed.
- H. Polimati, R. R. Pragada, N. H. Thuan and V. B. Tatipamula, Stud. Nat. Prod. Chem., 2022, 72, 259–285 CAS.
- S. C. Kim, Y. H. Kim, S. W. Son, E.-Y. Moon, S. Pyo and S. H. Um, Biochem. Biophys. Res. Commun., 2015, 467, 638–644 CrossRef CAS PubMed.
- Y. Wang, B. Wang, J. Lu, H. Shi, S. Gong, Y. Wang, R. C. Hamdy, B. H. L. Chua, L. Yang and X. Xu, J. Neurochem., 2017, 143, 561–568 CrossRef CAS PubMed.
- K. Sundarraj, A. Raghunath and E. Perumal, Biomed. Pharmacother., 2018, 97, 928–940 CrossRef CAS PubMed.
- T. Rengarajan and N. S. Yaacob, Eur. J. Pharmacol., 2016, 789, 8–16 CrossRef CAS PubMed.
- D. N. Syed, J.-C. Chamcheu, M. I. Khan, M. Sechi, R. K. Lall, V. M. Adhami and H. Mukhtar, Biochem. Pharmacol., 2014, 89, 349–360 CrossRef CAS PubMed.
- H. C. Pal, S. Sharma, L. R. Strickland, S. K. Katiyar, M. E. Ballestas, M. Athar, C. A. Elmets and F. Afaq, PLoS One, 2014, 9, e86338 CrossRef PubMed.
- R.-H. Chou, S.-C. Hsieh, Y.-L. Yu, M.-H. Huang, Y.-C. Huang and Y.-H. Hsieh, PLoS One, 2013, 8, e71983 CrossRef CAS PubMed.
- M. L. Smith, K. Murphy, C. D. Doucette, A. L. Greenshields and D. W. Hoskin, J. Cell. Biochem., 2016, 117, 1913–1925 CrossRef CAS PubMed.
- T.-H. Ying, S.-F. Yang, S.-J. Tsai, S.-C. Hsieh, Y.-C. Huang, D.-T. Bau and Y.-H. Hsieh, Arch. Toxicol., 2012, 86, 263–273 CrossRef CAS PubMed.
- P. Mehta, A. Pawar, K. Mahadik and C. Bothiraja, Biomed. Pharmacother., 2018, 106, 1282–1291 CrossRef CAS PubMed.
- L. R. G. Palacios and A. G. Bracamonte, RSC Adv., 2022, 12, 12806–12822 RSC.
- S. Hong, D. W. Choi, H. N. Kim, C. G. Park, W. Lee and H. H. Park, Pharmaceutics, 2020, 12, 604 CrossRef CAS PubMed.
- A. MaHam, Z. Tang, H. Wu, J. Wang and Y. Lin, Small, 2009, 5, 1706–1721 CrossRef CAS PubMed.
- A. O. Elzoghby, W. M. Samy and N. A. Elgindy, J. Controlled Release, 2012, 157, 168–182 CrossRef CAS PubMed.
- R. Solanki, H. Rostamabadi, S. Patel and S. M. Jafari, Int. J. Biol. Macromol., 2021, 193, 528–540 CrossRef CAS PubMed.
- E. Miele, G. P. Spinelli, E. Miele, F. Tomao and S. Tomao, Int. J. Nanomed., 2009, 4, 99 CrossRef CAS.
- R. Solanki, K. Patel and S. Patel, Colloids Surf., A, 2021, 608, 125501 CrossRef CAS.
- K. Patel, P. Jain, P. K. Rajput, A. K. Jangid, R. Solanki, H. Kulhari and S. Patel, Colloids Surf., A, 2022, 129738 CrossRef CAS.
- P. Singh, H. Singh, V. Castro-Aceituno, S. Ahn, Y. J. Kim and D. C. Yang, RSC Adv., 2017, 7, 15397–15407 RSC.
- H. Guo, S. Fei, Y. Zhang, Y. Zhang, J. Gou, L. Zhang, H. He, T. Yin, Y. Wang and X. Tang, RSC Adv., 2016, 6, 81110–81119 RSC.
- B. Bhushan, P. Dubey, S. U. Kumar, A. Sachdev, I. Matai and P. Gopinath, RSC Adv., 2015, 5, 12078–12086 RSC.
- R. Solanki and S. Patel, Food Biosci., 2023, 56, 103150 CrossRef CAS.
- M. Kamali, R. Dinarvand, H. Maleki, H. Arzani, P. Mahdaviani, H. Nekounam, M. Adabi and M. Khosravani, RSC Adv., 2015, 5, 62214–62219 RSC.
- X. Tang, B. Lin, S. Cui, X. Zhang, Y. Zhong, Q. Wu, X. Shen and T. Wang, RSC Adv., 2016, 6, 43284–43292 RSC.
- S. Hejmady, R. Pradhan, A. Alexander, M. Agrawal, G. Singhvi, B. Gorain, S. Tiwari, P. Kesharwani and S. K. Dubey, Drug Discovery Today, 2020, 25, 2227–2244 CrossRef CAS PubMed.
- Z. Zhao, A. Ukidve, J. Kim and S. Mitragotri, Cell, 2020, 181, 151–167 CrossRef CAS PubMed.
- M. J. Nirmala, U. Kizhuveetil, A. Johnson, G. Balaji, R. Nagarajan and V. Muthuvijayan, RSC Adv., 2023, 13, 8606–8629 RSC.
- M. Rizwanullah, S. Amin, S. R. Mir, K. U. Fakhri and M. M. A. Rizvi, J. Drug Targeting, 2018, 26, 731–752 CrossRef CAS PubMed.
- R. Solanki, B. Jodha, K. E. Prabina, N. Aggarwal and S. Patel, J. Drug Delivery Sci. Technol., 2022, 103832 CrossRef CAS.
- R. Bajracharya, J. G. Song, B. R. Patil, S. H. Lee, H.-M. Noh, D.-H. Kim, G.-L. Kim, S.-H. Seo, J.-W. Park and S. H. Jeong, Drug Deliv., 2022, 29, 1959–1970 CrossRef CAS PubMed.
- K. Öztürk, H. Eroğlu and S. Çalış, J. Drug Targeting, 2018, 26, 633–642 CrossRef PubMed.
- M. Fernández, F. Javaid and V. Chudasama, Chem. Sci., 2018, 9, 790–810 RSC.
- B. Bhushan and P. Gopinath, RSC Adv., 2015, 5, 86242–86253 RSC.
- S. Dhanasekaran, Phytomedicine, 2019, 56, 279–285 CrossRef CAS PubMed.
- R. Solanki, M. Saini, J. Mochi, A. Pappachan and S. Patel, J. Drug Delivery Sci. Technol., 2023, 104501 CrossRef CAS.
- N. A. N. Hanafy, R. F. Sheashaa, E. A. Moussa and M. E. Mahfouz, Int. J. Biol. Macromol., 2023, 245, 125572 CrossRef CAS PubMed.
- G. M. Morris, R. Huey, W. Lindstrom, M. F. Sanner, R. K. Belew, D. S. Goodsell and A. J. Olson, J. Comput. Chem., 2009, 30, 2785–2791 CrossRef CAS PubMed.
- U. Modi, D. Kedaria and R. Vasita, Macromol. Biosci., 2022, 22, 2200196 CrossRef CAS PubMed.
- R. Solanki, A. K. Jangid, M. Jadav, H. Kulhari and S. Patel, Macromol. Biosci., 2023, 2300077 CrossRef CAS PubMed.
- W. Zhang, R. Taheri-Ledari, F. Ganjali, S. S. Mirmohammadi, F. S. Qazi, M. Saeidirad, A. KashtiAray, S. Zarei-Shokat, Y. Tian and A. Maleki, RSC Adv., 2023, 13, 80–114 RSC.
Footnote |
| † Electronic supplementary information (ESI) available. See DOI: https://doi.org/10.1039/d3ra08434e |
| This journal is © The Royal Society of Chemistry 2024 |


