 Open Access Article
Methane hydrate efficient formation in a 3D-rGO/SDBS composite†
Meijiao Wang a,
Shaojiu Yan*ab,
Nan Wangb,
Wen Gec and
Wei Zhanga
aKey Laboratory of Geological Survey and Evaluation of Ministry of Education, China University of Geosciences, Wuhan 430074, China. E-mail: shaojiuyan@126.com
bResearch Centre of Graphene Applications, AECC Beijing Institute of Aeronautical Materials, Beijing 100095, China
cFaculty of Materials Science and Chemistry, China University of Geosciences, Wuhan 430078, China
First published on 26th January 2024
Abstract
The optimization of storage space and material composition can significantly improve the generation rate and storage capacity of methane hydrate, which is important for the industrial application of solidified natural gas (SNG) technology. In our report, the effects of the presence of SDBS (sodium dodecylbenzene sulfonate), GO (graphene oxide), 3D-rGO (3D-reduced graphene oxide) and 3D-rGO/SDBS (3D-reduced graphene oxide/sodium dodecylbenzene sulfonate) on the methane hydrate generation process are investigated. The results show that the heterogeneous effect on the solid-phase surface of 3D-rGO/SDBS and its interconnected three-dimensional (3D) structure can achieve rapid nucleation. In addition, the presence of 3D-rGO/SDBS can increase the dissolution and dispersion of gas in solution and further enhance the gas–liquid mass transfer, thus realizing efficient methane storage. The maximum methane storage capacity of 188 v/vw is obtained with 600 ppm of 3D-rGO/SDBS in water, reaching 87% of the theoretical maximum storage capacity. The addition of 3D-rGO/SDBS also significantly reduces the induction time and accelerates the formation rate of methane hydrate. This study reveals that 3D graphene materials have excellent kinetic promotion effects on methane hydrate formation, explores and enriches the hydrate-promoting mechanism, and provides essential data and theoretical basis for the research of new promoters in the field of SNG technology.
1 Introduction
In nature, the combination of methane and water under certain temperature and pressure conditions can form crystalline compounds with cage structure where water molecules form water cages by hydrogen bonding, encasing methane molecules within them.1 Methane hydrates have a cubic structure called structure I (sI) hydrate. The structure consists of two different types of water cages: one is 6 large cages consisting of 24 water molecules with 12 pentagonal and 2 hexagonal faces (denoted as 51262), the other is 2 small cages consisting of 20 water molecules with 12 pentagonal faces (denoted as 512). The average radii of the large and small cages are 0.433 and 0.395 nm. So theoretically each cage has enough space to hold one methane molecule.2 The discovery of natural methane hydrates inspired the transportation of methane in solidified form. First of all, the formation of methane hydrates is thermodynamically favourable (“narrow” pressure range of 3–10 MPa and mild temperatures). Secondly, they have superior theoretical gas storage capacities. If all water cages were filled with methane, approximately 180 volumes (STP) of methane would be released per volume of hydrate decomposition.3 The resulting concept of solidified natural gas (SNG) technology has received a lot of attention in recent years. In addition, compared to current mature natural gas transportation technologies such as compressed natural gas (CNG) and liquefied natural gas (LNG), which require the use of higher pressures (25 MPa and 25 °C) or lower temperatures (−162 °C and 0.1 MPa) to process the gas, the SNG technology is a safer, more economical, and more environmentally friendly alternative.However, the formation of artificial methane hydrates in the laboratory exhibits unfavourable kinetic constraints due to (1) the low solubility of methane in water, (2) the limited contact interface between methane and water that inhibits diffusion of methane in water to the critical concentration required to initiate nucleation, and (3) the limitation of mass transfer due to the formation of a hydrate film from the aggregation of hydrate crystals at the gas–liquid interface.4 As a result, methane hydrate formation in the pure water system (CH4 + H2O) exhibits low nucleation kinetics and slow growth rates, which make it difficult to generate large quantities in reasonable time scales, and the actual gas storage capacity is lower than the theoretical value. These circumstances limit the commercial development of SNG technology. By introducing solid surface to form non-homogeneous nucleation centres, the energy barrier for crystal nucleation in liquid-phase can be effectively reduced to accelerate the nucleation kinetics.5,6 In recent years, there has been a rapid increase in research results on solid porous materials such as activated carbon,7 natural sand,8 porous glass,9 silica powder,10 hydrogels11 and metal–organic frameworks12 as host structures for methane hydrate formation. Porous materials have stable 3D space, large specific surface area and variable mineral composition, which largely increase the effective interface between the gas and liquid phases and contribute to the rapid formation of methane hydrates. The ultra-high specific surface area and excellent thermal conductivity properties of graphene materials make them of great interest in the field of gas hydrates.13–15 Ghozatloo et al.16 researched graphene prepared by the Hummers' method for the first time in the formation process of natural gas hydrates, and the results showed that using a small amount of graphene could shorten the induction time by 61.07% and increase the gas storage capacity by 12.9% compared with the pure water system. Hosseini et al.17 used 1 wt% CVD graphene nanosheets to promote the formation of natural gas hydrates, and the incorporation of graphene nanosheets reduced the induction time by 54.7% and increased the gas storage capacity by 7.6%. Liu et al.18 found that the addition of graphene can induce an increase in intermediate water (IW), and IW has the potential to accelerate the nucleation of methane hydrate. Compared with sodium cholate solution, the mixed solution of graphene and sodium cholate was able to shorten the induction time and generation period of methane hydrate by 47.87% and 36.90%, respectively. In addition, utilizing the self-assembly characteristics of graphene can provide ideas for the design of novel graphene-based promoters. Graphene sheets can be constructed to form 3D graphene materials with interconnected 3D structures through non-covalent π–π interactions.19–21 3D graphene does not mean graphite, which is layered graphene, but a 3D interconnected porous material. 3D graphene can firstly preserve the exceptional 2D physical and chemical properties of graphene, and secondly its 3D structure enables high degree of porosity, large accessible surface area and efficient mass transport, which is important for promoting the formation of methane hydrates.22
On the other hand, the activity of porous materials as promoters of hydrate formation also depends on their surface properties, especially the surface functional groups.23,24 Thus, the properties of porous materials can be further enhanced by introducing surface functional groups. McElligott et al.25 introduced nitrogen-containing functional groups into graphene and prepared low- and high-nitrogen doped graphene nanoflakes (LN-GNFs and HN-GNFs), which accelerated the dissolution rate of methane in the solution of LN-GNFs by 17.54% and increased the hydrate growth rate by 77.20% as compared to that of the pure water system. Wang et al.26 prepared sulfonated graphene oxide (SGO) for promoting methane hydrate formation by grafting –SO3− groups onto graphene oxide sheets. When the concentration of SGO was 0.75 g L−1, most of the hydrate was formed in about 312 min, and the storage capacity reached an optimal value of 143.9 v/v (volumes of gas/volume of water). Sodium dodecylbenzene sulfonate (SDBS) is a common surfactant that increases methane solubilization in solution through nonpolar adsorption, and its –SO3− active group also enhances the mass transfer process from the gas phase to the aqueous phase, which collectively improves methane hydrate formation.27 Due to the presence of benzene ring, SDBS can form π-like stacking on the surface of carbon materials, which can enhance the binding of surfactant molecules to graphene, giving the surface of 3D graphene unique characteristics.28–30 Currently, two-dimensional (2D) graphene sheets and their composites have been attempted to promote methane hydrate formation, but studies combining the unique structure of 3D graphene and surface modification to produce synergistic effects for solidified gas efficient storage have not been reported.
In this study, 3D reduced graphene oxide/sodium dodecylbenzene sulfonate (3D-rGO/SDBS) was prepared from graphene oxide (GO) and sodium dodecylbenzene sulfonate (SDBS) by combining the chemical reduction and self-assembly method with freeze-drying technique. For comparison, 3D reduced graphene oxide (3D-rGO) was also prepared. The effects of the presence of SDBS, GO, 3D-rGO and 3D-rGO/SDBS on the formation of methane hydrates were comparatively investigated using pure water as a control group, and the mechanism of action of 3D graphene-based promoters was explored in the context of the kinetic processes of methane hydrate nucleation and growth.
2 Experimental section
2.1 Materials
GO (industrial grade) was purchased from Beijing Graphene Technology Research Institute Co., Ltd (Beijing, China). SDBS (A.R.) and L-ascorbic acid (A.R.) were purchased from Sinopharm Chemical Reagent Co., Ltd (Beijing, China). Methane gas (purity of 99.9%) was supplied by Jing Gao Gas Co., Ltd (Beijing, China). Deionized water was laboratory-made and the resistivity was 18.3 MΩ cm (298.15 K).![[thin space (1/6-em)]](https://www.rsc.org/images/entities/char_2009.gif) :
:![[thin space (1/6-em)]](https://www.rsc.org/images/entities/char_2009.gif) 1), followed by ultrasonication for 1 hour to make the mixture well dispersed. Then L-ascorbic acid was added to the mixed solution (the mass ratio of GO and L-ascorbic acid was 1
1), followed by ultrasonication for 1 hour to make the mixture well dispersed. Then L-ascorbic acid was added to the mixed solution (the mass ratio of GO and L-ascorbic acid was 1![[thin space (1/6-em)]](https://www.rsc.org/images/entities/char_2009.gif) :
:![[thin space (1/6-em)]](https://www.rsc.org/images/entities/char_2009.gif) 4) and the sonication process was continued for 1 h. Subsequently, the solution was transferred to hydrothermal autoclave reactor and reacted at a constant temperature of 90 °C for 12 h. The hydrogels taken out were washed and freeze-dried in the same way to obtain 3D-rGO/SDBS.
4) and the sonication process was continued for 1 h. Subsequently, the solution was transferred to hydrothermal autoclave reactor and reacted at a constant temperature of 90 °C for 12 h. The hydrogels taken out were washed and freeze-dried in the same way to obtain 3D-rGO/SDBS.2.2 Characterization
The microscopic morphology of the materials was observed using a scanning electron microscope (SEM, model SU8010, Hitachi Co., Ltd, Tokyo, Japan) with an accelerating voltage of 20 kV. An X-ray diffractometer (XRD, model D8 Advance, Bruker AXS Inc., Billerica, MA, USA) was used to characterize the crystal structure of the materials using Cu Kα X-rays. The diffraction angle 2θ was analysed over a range of 5° to 90° with an operating voltage of 40 kV and a scanning step of 0.03°. Changes in the chemical composition of graphene-based materials were analysed using a Fourier transform infrared spectrometer (FTIR, model Nicolet IS50, Thermo Fisher Scientific Inc., Waltham, MA, USA) with a scan range of 400 to 4000 cm−1. The structural characterization of the materials was carried out using a Raman spectrometer (model Renishaw in Via, Renishaw PLC., Wotton-under-Edge, Gloucestershire, UK) with a laser wavelength of 532 nm and a wave number range of 100 to 3500 cm−1. The nitrogen adsorption and desorption isotherm (77 K) of the 3D-rGO/SDBS material was tested using a surface area and porosity analyser (model TriStar II 3020, Micromeritics Instrument Corp., Norcross, Georgia, USA). The surface area was calculated based on the Brunauer–Emmett–Teller (BET) method. The total pore volume was evaluated based on adsorption branch at a relative pressure of 0.99 and the pore size distribution was calculated using the Barrett–Joyner–Halenda (BJH) method.2.3 Methane hydrate formation
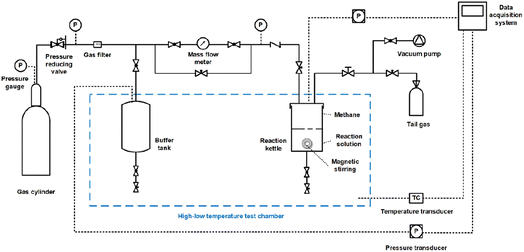
The reaction kettle was first washed with deionized water and then filled it with 10 mL of the configured solution after the kettle was dry. The kettle was then fixed in the high-low temperature test chamber and sealed tightly. The buffer tank and kettle were evacuated, then filled with methane and evacuated again to remove the air. Subsequently, methane at a pressure higher than the experimental pressure (about 10 MPa) was injected into the buffer tank. The temperature of the high-low temperature test chamber was set to the experimental temperature of 275.15 K to achieve cooling of the gas in the buffer tank and the solution in the kettle. When the pressure fluctuation in the buffer tank was less than 5 kPa for at least 30 min, methane was injected from the buffer tank into the reaction kettle to the required pressure for the experiment, and then the inlet valve of the kettle was closed. Then the magnetic stirring (rotating speed of 300 rpm) was immediately turned on. Finally, methane hydrate was formed in the reactor kettle.
In addition, the methane hydrate formation kinetics in the 3D-rGO/SDBS-water system at concentrations of 200, 400, 600, and 800 ppm were tested. The operating procedures were consistent with the five systems described above.
 | (1) |
The number of moles of gas-phase methane (ng,t) in the reaction kettle at time t is calculated by eqn (2), where the dissolved consumed methane is not taken into account due to the too small amount dissolved.32
 | (2) |
| Vg,t = Vb − Vl(1 − xt) − 1.25Vlxt | (3) |
The number of moles of captured gas (nh) in the hydrate at time t is calculated from eqn (4):
 | (4) |
The mass balance of methane in the reaction kettle can be expressed as eqn (5) below:
| na,t = ng,t + nh,t | (5) |
Combining eqn (1)–(5) gives the water-to-hydrate conversion ratio (xt):
 | (6) |
The gas storage capacity (Cs, in v/vw) of the system at moment t is defined as the ratio of the volume of captured gas to solution, and is calculated by eqn (7):
| Cs = 22.4nh/Vl | (7) |
Experiments with pure, single-phase methane gas will only form sI hydrates, both in the pure water system and in the system with the addition of different types of kinetic promoters.35 The sI methane hydrate can be stable over a wide range of pressures and temperatures, and kinetic promoters do not affect the structure.36,37 In sI methane hydrate, the theoretical ratio of water to gas in hydrate is 5.75 mol mol−1 with all cavities filled with gas molecules.38 That is, in these experiments one volume of water can theoretically encapsulate 216 volumes (STP) of methane gas.39 The methane storage capacity of each system is calculated and compared with the theoretical value.
3 Results and discussion
3.1 Characterization of GO, 3D-rGO and 3D-rGO/SDBS
SEM images show that GO presents 2D lamellar structure with ripple-like folds and wide and large surface (Fig. 2a). In contrast, the interior of 3D-rGO presents interconnected 3D porous structure (Fig. 2b), which is formed by self-assembly of GO sheets, so that the 3D-rGO surface still retains the folds of GO, resulting in a larger surface. The 3D porous structure inside the composite 3D-rGO/SDBS is well maintained (Fig. 2c), indicating that the π-like stacking of SDBS on the graphene surface does not disrupt the 3D structural features of 3D-rGO/SDBS.The XRD spectra of GO, 3D-rGO and 3D-rGO/SDBS are shown in Fig. 3a. It can be seen that the peak at 2θ of 8.78° is the (001) characteristic diffraction peak of GO,40 and the layer spacing of GO is calculated to be 1.005 nm according to Bragg's equation.41 The reason for the relatively large layer spacing of GO is the grafting of many oxygen-containing groups on its surface. When GO is chemically reduced, the diffraction peak located at 8.78° disappears utterly, and a broad and weak (002) diffraction peak of 3D-rGO appears at 2θ of 25.41°,42 and the lamellar spacing is reduced to 0.350 nm. This is attributed to the fact that the chemical reduction process efficiently eliminates the oxygen-containing groups grafted on the surface of GO, and its product, reduced graphene oxide (rGO) flakes, self-assemble to form 3D structure. This process reduces phonon scattering due to oxygen-containing groups and excessive individual dispersed interfaces, enhances phonon transport, and thus improves the thermal conductivity of 3D graphene materials.43 The XRD spectra of 3D-rGO and 3D-rGO/SDBS show similar shapes, which change only by a shift of the broad diffraction peak from 25.41° to a lower angle of 24.21°, corresponding to an increase in the interlayer spacing from 0.350 nm to 0.367 nm. This result indicates that the reduced rGO surface was re-grafted with new groups, resulting in a slight increase in the lamellar spacing of rGO, which suggests that SDBS was successfully bound to the 3D-rGO surface to form 3D-rGO/SDBS. In addition, SDBS grafted on the graphene surface could keep 3D-rGO/SDBS dispersed and stable in solution.
 | ||
| Fig. 3 (a) XRD and (c) Raman spectra of GO, 3D-rGO and 3D-rGO/SDBS; (b) Infrared spectra of 3D-rGO, 3D-rGO/SDBS and SDBS. | ||
Fig. 3b shows the infrared spectra of 3D-rGO, 3D-rGO/SDBS and SDBS. Comparing 3D-rGO, four new characteristic peaks attributed to the sulfonic acid group of SDBS appeared in 3D-rGO/SDBS at 1160, 1125, 1036, and 1008 cm−1; in addition, a new characteristic peak also appeared at 1450 cm−1, which was the effect of C![[double bond, length as m-dash]](https://www.rsc.org/images/entities/char_e001.gif) C bond of the benzene ring of SDBS and the C
C bond of the benzene ring of SDBS and the C![[double bond, length as m-dash]](https://www.rsc.org/images/entities/char_e001.gif) C bond of 3D-rGO. These test results further indicate that SDBS and 3D-rGO have been successfully combined. For 3D-rGO and 3D-rGO/SDBS, the peak at 3435 cm−1 is attributed to the O–H stretching vibration of the hydroxyl group, the peak near 1724 cm−1 is attributed to the C
C bond of 3D-rGO. These test results further indicate that SDBS and 3D-rGO have been successfully combined. For 3D-rGO and 3D-rGO/SDBS, the peak at 3435 cm−1 is attributed to the O–H stretching vibration of the hydroxyl group, the peak near 1724 cm−1 is attributed to the C![[double bond, length as m-dash]](https://www.rsc.org/images/entities/char_e001.gif) O stretching vibration of the carboxyl group, and the peak near 1568 cm−1 is attributed to the C–H stretching vibration. The intensities of the above three peaks in both 3D-rGO and 3D-rGO/SDBS spectra are weakened compared with GO (Fig. S1†), indicating that only few oxygen-containing groups remain on the surface of GO after chemical reduction, and the reduction process is relatively thorough.
O stretching vibration of the carboxyl group, and the peak near 1568 cm−1 is attributed to the C–H stretching vibration. The intensities of the above three peaks in both 3D-rGO and 3D-rGO/SDBS spectra are weakened compared with GO (Fig. S1†), indicating that only few oxygen-containing groups remain on the surface of GO after chemical reduction, and the reduction process is relatively thorough.
Fig. 3c shows the Raman spectra of GO, 3D-rGO and 3D-rGO/SDBS, the 1350 cm−1 characteristic peak corresponds to the disordered vibration peak (D peak) of graphene, and the 1590 cm−1 characteristic peak corresponds to vibration of sp2 hybridization carbon atoms on the hexagonal lattice of graphene peak (G peak). The larger intensity ratio (ID/IG) of the D and G peaks indicates that the disorder of the material is higher.44 As can be seen from the figure, the ID/IG of 3D-rGO and 3D-rGO/SDBS is higher than that of GO, which indicates that the disorder of graphene increases after chemical reduction. The reduction process causes 3D-rGO to produce more planar defects, which can be used as nucleation sites for hydrates.45,46
The nitrogen adsorption and desorption isotherm and pore size distribution of 3D-rGO are shown in Fig. 4. It can be seen that 3D-rGO reveals typical type IV isotherms with H3-type hysteresis loops, which indicates that the sample is rich in mesopores, and the corresponding pore size distributions confirm this. Most importantly, the 3D-rGO formed by chemical reduction and self-assembly of 2D GO sheets has huge specific surface area of 1443 m2 g−1 and a pore volume of 2.36 cm3 g−1.
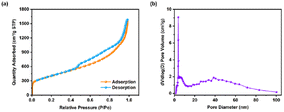 | ||
| Fig. 4 (a) 77 K nitrogen adsorption and desorption isotherms and (b) pore size distribution of 3D-rGO. | ||
3.2 Methane hydrate formation
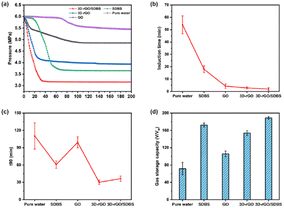
Fig. 5a shows the variation of gas pressure during methane hydrate formation, which was used to investigate the dependence of methane hydrate formation on the type of promoter. The experimental temperature was 275.15 K, the initial pressure was 6 MPa, and the stirring speed was 300 rpm. The promoter types included SDBS, GO, 3D-rGO and 3D-rGO/SDBS, and pure water was used as a control group. Taking pure water as an example, it can be seen that the typical pressure changes during the formation of methane hydrate are as follows: the pressure is relatively stable at first (induction stage), followed by a rapid decrease in pressure (hydrate formation stage in large quantities), and then the pressure returns to be stable again (end of hydrate formation). The trend of the pressure change curves in each system is similar, but the specific behaviour at each stage is quite different.The induction time, defined as the time required from the initial equilibrium state to hydrate nucleation, is a key parameter to quantify the nucleation process of methane hydrates.47,48 It can provide information about the kinetics of hydrate nucleation and growth.49 Fig. 5b shows the induction time of methane hydrate formation in the presence of different types of promoters. The results showed that the addition of GO, 3D-rGO and 3D-rGO/SDBS all significantly shortened the induction time of hydrate formation. Among them, the induction time of hydrate formation in the 3D-rGO/SDBS system was the shortest at 1.9 min, which was 96.5% shorter than that of the pure water system (53.9 min) and 89.3% shorter than that of the SDBS system (17.7 min) on average. The larger specific surface area of graphene can provide more nucleation sites for hydrates at the initial stage, which has been shown to be effective in promoting the non-homogeneous nucleation of hydrates. In addition to its huge specific surface area, the interconnected 3D porous structure of 3D-rGO/SDBS upscales the 2D material into freestanding 3D space with better thermal conductivity, which is capable of releasing the heat generated from hydrate formation in time and accelerating the hydrate nucleation kinetics.
t90 is the time taken for 90% completion of hydrate formation and is important for measuring the formation cycle of hydrate.50 Fig. 5c shows the effect of the addition of different types of promoters on t90. While the t90 of the pure water system was about 111 min, the presence of 3D-rGO and 3D-rGO/SDBS significantly reduced the t90 to less than 35 min, shortening the formation cycle of hydrate by about 68.5%. Previous studies have shown that SDBS is able to reduce the surface tension of the solution without forming a hydrate film covering the entire methane–water interface, which enhances the mass transfer from the gas phase to the liquid phase, and the formation cycle of hydrate is thus shortened.51 Furthermore, according to Kim et al. excessive oxygen-containing groups on the surface of GO produce strong interactions with the surrounding water molecules and reduce the water activity, thus inhibiting the rapid formation of gas hydrates.52 In this study, we compare the t90 of 3D-rGO/SDBS, 3D-rGO, SDBS, and GO and find that methane is trapped at a faster rate in the 3D-rGO/SDBS and 3D-rGO systems, and that the substantial reduction in the formation cycle of hydrate correlates with the 3D graphene structure. On the one hand, most of the oxygen-containing groups on the surface of GO are eliminated due to the chemical reduction process, which largely attenuates the effect of oxygen-containing groups on water activity. On the other hand, 3D-rGO formed by self-assembly of rGO sheets has 3D porous structure, which can adsorb nonpolar methane molecules both on its surface and within its pore size, significantly increasing the solubility of methane in solution. In addition, the rate of gas consumption is restricted by the dispersion rate of gas in the bulk solution.53 The 3D-rGO dispersed in solution promotes the mass transfer of methane and the rate of hydrate formation is subsequently accelerated.
Fig. 5d shows the final gas storage capacity of each system in the presence of different types of promoters. It can be seen that the gas storage capacity of pure water is only 71 v/vw, which is 33% of the theoretical maximum storage capacity, and the addition of 3D-rGO/SDBS increases this result to about 188 v/vw, which is 87% of the theoretical value. The higher gas storage capacity of 3D-rGO/SDBS compared to that of SDBS suggests that the combination of 3D-rGO and SDBS may have synergistically promoted methane hydrate formation. And the excellent specific surface area of 3D-rGO/SDBS can bind more SDBS. In addition to the adsorption of methane by the 3D structure itself, the numerous –SO3− groups of SDBS on the surface of 3D-rGO/SDBS are able to bind more water molecules, and methane and water are aggregated in the vicinity of 3D-rGO/SDBS, and the chances of contacting the two are significantly increased, which is conducive to the sustained formation of methane hydrates.
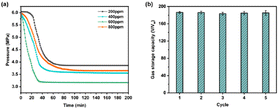
Fig. 6a shows the effects of different additions of 3D-rGO/SDBS on the methane hydrate formation process. The corresponding induction time, t90 and gas storage capacity are shown in Fig. S2–S4.† Among all the systems, the induction time and formation cycle of hydrate are shortest and the gas storage capacity is highest when the addition amount of 3D-rGO/SDBS is 600 ppm. This may be due to the strongest synergistic effect on methane hydrate formation by the combination of 3D-rGO and SDBS at 600 ppm. When the addition amount of 3D-rGO/SDBS continues to increase to 800 ppm, the formation cycle of hydrate becomes longer and the gas storage capacity decreases. The gas storage capacity of 3D-rGO/SDBS (600 ppm addition) after five methane hydrate formation-dissociation cycles is shown in Fig. 6b. The gas storage capacity was stabilized at around 185 v/vw (86% of the theoretical value) for all five cycling experiments, which indicates that 3D-rGO/SDBS has excellent cycling stability performance and can be recycled and reused many times.
3.3 Analysis of promoting mechanisms
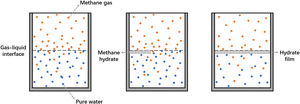
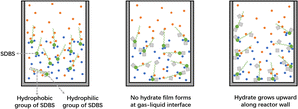
Fig. 7 shows the schematic diagram of the methane hydrate formation process in pure water, where hydrate nucleation usually occurs at the gas–liquid interface due to a higher initial methane concentration than that of the bulk phase. Nucleation of crystals in the liquid phase is characterized by the existence of the crystal-liquid interfacial energy barrier, and a sufficiently large number of molecules must be aggregated to form nuclei larger than critical size, so a long induction time is required for hydrate formation in pure water.54 The growth of hydrate uses the gas–liquid interface as the reaction surface and gradually forms a hydrate film covering the entire interface. This hydrate film separates the gas phase from the liquid phase, which severely weakens the gas–liquid mass transfer, and the rate of hydrate formation slows down or even stops.As shown in Fig. 8, the addition of SDBS can improve the above situation. The hydrophilic head of the SDBS molecule attracts water molecules through polar interactions, which reduces the surface tension of the solution. Meanwhile, the non-polar hydrocarbon chains of SDBS can adsorb methane gas, increasing the amount and rate of methane dissolution in solution. Based on this, the chance of hydrate film formation at the gas–liquid interface in the SDBS system is significantly reduced, and the limitation of the hydrate film on the gas–liquid mass transfer will disappear, resulting in the shortening of the induction time and accelerating of the formation rate of hydrate.
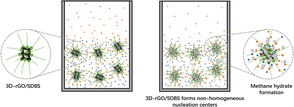
As shown in Fig. 9, 3D-rGO/SDBS combines the advantages of 3D-rGO and SDBS for solidified gas efficient storage. During the initial induction phase, on the one hand, the solid surface can provide the supercritical size required for hydrate nucleation and reduce the effect from the interfacial energy. 3D graphene has 3D space and superior specific surface area, so 3D-rGO/SDBS in solution can form many non-homogeneous nucleation centers and use heterogeneous effect to avoid the formation of hydrate film. On the other hand, the chemical reduction process efficiently eliminates the oxygen-containing groups grafted on the surface of GO, which can reduce the in-plane phonon scattering and enhance phonon transport.55–57 In addition, the self-assembly of individual dispersed 2D graphene to form 3D continuous network structure can effectively decrease the amount of interfaces, which in turn decreases the boundary interface phonon scattering and the interfacial thermal resistance, and further improves the thermal conductivity of 3D-rGO/SDBS.58–60 As a result, the heat generated from hydrate generation can be released in time for rapid nucleation. In the hydrate formation stage in large quantities, the 3D space of 3D-rGO/SDBS can adsorb more methane molecules, which increases the dissolution of methane in solution. And the dispersion of 3D-rGO/SDBS in solution also accelerates the mass transfer process of methane in the liquid phase. Compared with SDBS solution, 3D-rGO/SDBS surface binds more SDBS molecules, which can adsorb more water molecules to interact with methane, thus shortening the formation cycle of hydrate, increasing the final gas storage capacity, and breaking the kinetic limitation of the formation process of artificial methane hydrate.
4 Conclusions
In this study, the effects of the presence of SDBS, GO, 3D-rGO and 3D-rGO/SDBS on the induction time, formation cycle, and final gas storage capacity during the formation of methane hydrates were investigated. The experimental results show that 3D-rGO/SDBS combines the advantages of 3D-rGO and SDBS, and can promote methane hydrate formation in terms of both structure and surface properties. The maximum methane storage capacity of 188 v/vw is obtained with 600 ppm of 3D-rGO/SDBS in water, reaching 87% of the theoretical maximum storage capacity, which can realize the efficient storage of methane gas. And the addition of 3D-rGO/SDBS also significantly shortens the induction time and accelerates the formation rate of methane hydrate with excellent kinetic promotion. In addition, 3D-rGO/SDBS shows excellent cyclic stability performance during five methane hydrate formation–dissociation processes, and has the potential to be used as an environmentally-friendly, fast, and efficient promoter to support SNG technology.Conflicts of interest
There are no conflicts of interest to declare.References
- C. A. Koh, A. K. Sum and E. D. Sloan, State of the art: Natural gas hydrates as a natural resource, J. Nat. Gas Sci. Eng., 2012, 8, 132–138 CrossRef.
- E. D. Sloan and C. A. Koh, Clathrate Hydrates of Natural Gases, CRC press, 2007 Search PubMed.
- Y. F. Makogon, S. A. Holditch and T. Y. Makogon, Natural gas-hydrates—A potential energy source for the 21st Century, J. Pet. Sci. Eng., 2007, 56, 14–31 CrossRef CAS.
- H. P. Veluswamy, A. Kumar, R. Kumar and P. Linga, An innovative approach to enhance methane hydrate formation kinetics with leucine for energy storage application, Appl. Energy, 2017, 188, 190–199 CrossRef CAS.
- K. B. Yu and A. O. Yazaydin, Does Confinement Enable Methane Hydrate Growth at Low Pressures? Insights from Molecular Dynamics Simulations, J. Phys. Chem. C, 2015, 124, 11015–11022 CrossRef PubMed.
- S. Takeya, A. Hori, T. Hondoh and T. Uchida, Freezing-memory Effect of Water on Nucleation of CO2 Hydrate Crystals, J. Phys. Chem. B, 2000, 104, 4164–4168 CrossRef CAS.
- M. E. Casco, J. Silvestre-Albero, A. J. Ramírez-Cuesta, F. Rey, J. L. Jordá, A. Bansode, A. Urakawa, I. Peral, M. Martínez-Escandell, K. Kaneko and F. Rodríguez-Reinoso, Methane hydrate formation in confined nanospace can surpass nature, Nat. Commun., 2015, 6, 6432 CrossRef CAS PubMed.
- K. U. Heeschen, J. M. Schicks and G. Oeltzschner, The promoting effect of natural sand on methane hydrate formation: Grain sizes and mineral composition, Fuel, 2016, 181, 139–147 CrossRef CAS.
- G. C. Fitzgerald, M. J. Castaldi and J. M. Schicks, Methane Hydrate Formation and Thermal Based Dissociation Behavior in Silica Glass Bead Porous Media, Ind. Eng. Chem. Res., 2014, 53, 6840–6854 CrossRef CAS.
- Y. Zhang, L. Zhang, C. Y. Zhu, L. X. Xu, X. S. Li and Z. Y. Chen, Formation Behaviors of Methane Hydrate in Partially Water-Saturated Porous Media with Different Particle Sizes, Energy Fuels, 2021, 35, 19399–19409 CrossRef CAS.
- B. H. Shi, L. Yang, S. S. Fan and X. Lou, An investigation on repeated methane hydrates formation in porous hydrogel particles, Fuel, 2017, 194, 395–405 CrossRef CAS.
- S. Denning, A. A. A. Majid, J. M. Lucero, J. M. Crawford, M. A. Carreon and C. A. Koh, Metal–Organic Framework HKUST-1 Promotes Methane Hydrate Formation for Improved Gas Storage Capacity, ACS Appl. Mater. Interfaces, 2020, 12, 53510–53518 CrossRef CAS PubMed.
- H. Q. Liu, Y. C. Song, C. R. Shi, J. F. Zhao and Z. Ling, Investigating the synergistic initiating effect on promoting methane hydrate formation via mixed graphene and sodium cholate, J. Mol. Liq., 2022, 349, 118134 CrossRef CAS.
- A. McElligott, J. L. Meunier and P. Servio, Effects of nitrogen-doped graphene nanoflakes on methane hydrate formation, J. Nat. Gas Sci. Eng., 2021, 96, 104336 CrossRef CAS.
- S. Yan, W. J. Dai, S. L. Wang, Y. C. Rao and S. D. Zhou, Graphene Oxide: An Effective Promoter for CO2 Hydrate Formation, Energies, 2018, 11, 1756 CrossRef.
- A. Ghozatloo, M. Hosseini and M. Shariaty-Niassar, Improvement and enhancement of natural gas hydrate formation process by Hummers' graphene, J. Nat. Gas Sci. Eng., 2015, 27, 1229–1233 CrossRef CAS.
- M. Hosseini, A. Ghozatloo and M. Shariaty-Niassar, Effect of CVD graphene on hydrate formation of natural gas, J. Nanostruct. Chem., 2015, 5, 219–226 CrossRef CAS.
- H. Q. Liu, Y. C. Song, C. R. Shi, J. F. Zhao and Z. Ling, Investigating the synergistic initiating effect on promoting methane hydrate formation via mixed graphene and sodium cholate, J. Mol. Liq., 2021, 349, 118134 CrossRef.
- D. Li, M. B. Müller, S. Gilje, R. B. Kaner and G. G. Wallace, Processable aqueous dispersions of graphene nanosheets, Nat. Nanotechnol., 2008, 3, 101–105 CrossRef CAS PubMed.
- W. Chen and L. Yan, In situ self-assembly of mild chemical reduction graphene for three-dimensional architectures, Nanoscale, 2011, 3, 3132–3137 RSC.
- R. M. Firdaus, N. Berrada, A. Desforges, A. R. Mohamed and B. Vigolo, From 2D Graphene Nanosheets to 3D Graphene-based Macrostructures, Chem. - Asian J., 2020, 15, 2902–2924 CrossRef PubMed.
- J. H. Han, I. Johnson and M. W. Chen, 3D Continuously Porous Graphene for Energy Applications, Adv. Mater., 2021, 34, 2108750 CrossRef PubMed.
- F. Wang, F. P. Song, C. Li and M. T. Sun, Promoted methane hydrate formation in –SO3−-rich hydrogel clathrate, Fuel, 2022, 323, 124398 CrossRef CAS.
- A. N. Nesterov, A. M. Reshetnikov, A. Y. Manakov, T. V. Rodionova, E. A. Paukshtis, I. P. Asanov, S. P. Bardakhanov and A. I. Bulavchenko, Promotion and inhibition of gas hydrate formation by oxide powders, J. Mol. Liq., 2015, 204, 118–125 CrossRef CAS.
- A. McElligott, J. L. Meunier and P. Servio, Effects of nitrogen-doped graphene nanoflakes on methane hydrate formation, J. Nat. Gas Sci. Eng., 2021, 96, 104336 CrossRef CAS.
- F. Wang, H. L. Meng, G. Guo, S. J. Luo and R. B. Guo, Methane hydrate formation promoted by –SO3−-coated graphene oxide nanosheets, ACS Sustainable Chem. Eng., 2018, 5, 6597–6604 CrossRef.
- Z. E. Zhang, Z. M. Liu, Z. Pan, F. M. Baena-Moreno and M. R. Soltanian, Effect of porous media and its distribution on methane hydrate formation in the presence of surfactant, Appl. Energy, 2020, 261, 114373 CrossRef CAS.
- F. Palazzesi, M. Calvaresi and F. Zerbetto, A molecular dynamics investigation of structure and dynamics of SDS and SDBS micelles, Soft Matter, 2011, 7, 9148–9156 RSC.
- S. H. Zhou, D. L. Wei, H. Y. Shi, X. Feng, K. W. Xue, F. Zhang and W. B. Song, Sodium dodecyl benzene sulfonate functionalized graphene for confined electrochemical growth of metal/oxide nanocomposites for sensing application, Talanta, 2013, 107, 349–355 CrossRef CAS PubMed.
- H. Y. Sun and X. N. Yang, Molecular simulation of self-assembly structure and interfacial interaction for SDBS adsorption on graphene, Colloids Surf., A, 2014, 462, 82–89 CrossRef CAS.
- D. Y. Peng and D. B. Robinson, A new two-constant equation of state, Indian J. Pure Appl. Math., 1976, 15, 59–64 CAS.
- L. K. Wang, G. J. Chen, G. H. Han, X. Q. Guo and T. M. Guo, Experimental study on the solubility of natural gas components in water with or without hydrate inhibitor, Fluid Phase Equilib., 2003, 207, 143–154 CrossRef CAS.
- P. Xiao, X. M. Yang, C. Y. Sun, J. L. Cui, N. Li and G. J. Chen, Enhancing methane hydrate formation in bulk water using vertical reciprocating impact, Chem. Eng. J., 2018, 336, 649–658 CrossRef CAS.
- V. D. Chari, P. S. R. Prasad and S. R. Murthy, Structural stability of methane hydrates in porous medium: Raman spectroscopic study, Spectrochim. Acta, Part A, 2014, 120, 636–641 CrossRef CAS PubMed.
- C. A. Koh, Towards a fundamental understanding of natural gas hydrates, Chem. Soc. Rev., 2002, 31, 157–167 RSC.
- Y. F. Makogon, Natural gas hydrates – A promising source of energy, J. Nat. Gas Sci. Eng., 2010, 2, 49–59 CrossRef CAS.
- A. Kumar, G. Bhattacharjee, B. D. Kulkarni and R. Kumar, Role of Surfactants in Promoting Gas Hydrate Formation, Ind. Eng. Chem. Res., 2015, 54, 12217–12232 CrossRef CAS.
- H. Ganji, M. Manteghian, K. S. Zadeh, M. R. Omidkhah and H. R. Mofrad, Effect of different surfactants on methane hydrate formation rate, stability and storage capacity, Fuel, 2007, 86, 434–441 CrossRef CAS.
- E. D. Sloan, Fundamental principles and applications of natural gas hydrates, Nature, 2003, 426, 353–359 CrossRef CAS PubMed.
- T. T. Vu, T. C. Hoang, T. H. L. Vu, T. S. Huynh and T. V. La, Template-free fabrication strategies for 3D nanoporous Graphene in desalination applications, Arabian J. Chem., 2021, 14, 103088 CrossRef CAS.
- C. G. Pope, X-ray diffraction and the Bragg equation, J. Chem. Educ., 1997, 74, 129–131 CrossRef CAS.
- L. Zhang and G. Q. Shi, Preparation of Highly Conductive Graphene Hydrogels for Fabricating Supercapacitors with High Rate Capability, J. Phys. Chem. C, 2011, 115, 17206–17212 CrossRef CAS.
- S. C. Lin and M. J. Buehler, Thermal transport in monolayer graphene oxide: Atomistic insights into phonon engineering through surface chemistry, Carbon, 2014, 77, 351–359 CrossRef CAS.
- T. Kuila, S. Bose, A. K. Mishra, P. Khanra, N. H. Kim and J. H. Lee, Chemical functionalization of graphene and its applications, Prog. Mater. Sci., 2012, 57, 1061–1105 CrossRef CAS.
- Y. Y. Peng, Y. M. Liu, J. K. Chang, C. H. Wu, M. D. Ger, N. W. Pu and C. L. Chang, A facile approach to produce holey graphene and its application in supercapacitors, Carbon, 2015, 81, 347–356 CrossRef CAS.
- H. Q. Liu, Y. C. Song, C. R. Shi, J. F. Zhao and Z. Ling, Investigating the synergistic initiating effect on promoting methane hydrate formation via mixed graphene and sodium cholate, J. Mol. Liq., 2022, 349, 118134 CrossRef CAS.
- D. Kashchiev and A. Firoozabadi, Induction time in crystallization of gas hydrates, J. Cryst. Growth, 2003, 250, 499–515 CrossRef CAS.
- S. R. Wang, M. J. Yang, W. G. Liu, J. F. Zhao and Y. C. Song, Investigation on the induction time of methane hydrate formation in porous media under quiescent conditions, J. Pet. Sci. Eng., 2016, 145, 565–572 CrossRef CAS.
- S. Abedi-Farizhendi, M. Iranshahi, A. Mohammadi, M. Manteghian and A. H. Mohammadi, Kinetic study of methane hydrate formation in the presence of carbon nanostructures, Pet. Sci., 2019, 16, 657–668 CrossRef CAS.
- C. R. Shi, F. Y. Chai, M. J. Yang, Y. C. Song, F. Q. Wang, H. Zhou and Z. Ling, Enhance methane hydrate formation using fungus confining sodium dodecyl sulfate solutions for methane storage, J. Mol. Liq., 2021, 333, 116020 CrossRef CAS.
- O. Nashed, B. Partoon, B. Lal, K. M. Sabil and A. M. Shariff, Review the impact of nanoparticles on the thermodynamics and kinetics of gas hydrate formation, J. Nat. Gas Sci. Eng., 2018, 55, 452–465 CrossRef CAS.
- D. Kim, D. W. Kim, H. K. Lim, J. Jeon, H. Kim, H. T. Jung and H. Lee, Inhibited phase behavior of gas hydrates in graphene oxide: influences of surface and geometric constraints, Phys. Chem. Chem. Phys., 2014, 16, 22717–22722 RSC.
- Y. S. Yu, C. G. Xu and X. S. Li, Evaluation of CO2 hydrate formation from mixture of graphite nanoparticle and sodium dodecyl benzene sulfonate, J. Ind. Eng. Chem., 2018, 59, 64–69 CrossRef CAS.
- S. Takeya, A. Hori, T. Hondoh and T. Uchida, Freezing-memory Effect of Water on Nucleation of CO2 Hydrate Crystals, J. Phys. Chem. B, 2000, 27, 4164–4168 CrossRef.
- J. J. Chen and L. K. Li, Effect of oxidation degree on the thermal properties of graphene oxide, J. Mater. Res. Technol., 2020, 9, 13740–13748 CrossRef CAS.
- H. F. Song and F. Y. Kang, Recent Progress on Thermal Conduction of Graphene, Acta Phys.-Chim. Sin., 2022, 38, 2101013 Search PubMed.
- S. F. Pei and H. M. Cheng, The reduction of graphene oxide, Carbon, 2012, 50, 3210–3228 CrossRef CAS.
- Z. W. Chen, X. Y. Zhang and Y. Z. Pei, Manipulation of Phonon Transport in Thermoelectrics, Adv. Mater., 2018, 30, 1705617 CrossRef PubMed.
- W. Y. Zhang, Q. Q. Kong, Z. C. Tao, J. C. Wei, L. J. Xie, X. Y. Cui and C. M. Chen, 3D Thermally Cross-Linked Graphene Aerogel-Enhanced Silicone Rubber Elastomer as Thermal Interface Material, Adv. Mater. Interfaces, 2019, 6, 1900147 CrossRef.
- M. Loeblein, S. H. Tsang, M. Pawlik, E. J. R. Phua, H. Yong, X. W. Zhang, C. L. Gan and E. H. T. Teo, High-Density 3D-Boron Nitride and 3D-Graphene for High-Performance Nano-Thermal Interface Material, ACS Nano, 2017, 11, 2033–2044 CrossRef CAS PubMed.
Footnote |
| † Electronic supplementary information (ESI) available. See DOI: https://doi.org/10.1039/d3ra08478g |
| This journal is © The Royal Society of Chemistry 2024 |

