 Open Access Article
Interpretable machine learning-assisted screening of perovskite oxides†
Jie Zhao *a,
Xiaoyan Wang*b,
Haobo Lic and
Xiaoyong Xu
 *c
*c
aCollege of Chemical Engineering, Nanjing Tech University, Nanjing, Jiangsu 211816, China. E-mail: j.zhao1@njtech.edu.cn
bSchool of Computer Science, Nanjing Audit University, Nanjing, Jiangsu 211815, China. E-mail: xywang@nau.edu.cn
cSchool of Chemical Engineering, The University of Adelaide, Adelaide, SA 5005, Australia. E-mail: xiaoyong.xu@adelaide.edu.au
First published on 26th January 2024
Abstract
Perovskite oxides are extensively utilized in energy storage and conversion. However, they are conventionally screened via time-consuming and cost-intensive experimental approaches and density functional theory. Herein, interpretable machine learning is applied to identify perovskite oxides from virtual perovskite-type combinations by constructing classification and regression models to predict their thermodynamic stability and energy above the convex hull (Eh), respectively, and interpreting the models using SHapley Additive exPlanations. The highest occupied molecular orbital energy and the elastic modulus of the B-site elements of perovskite oxides are the top two features for stability prediction, whereas the Stability Label and features involving the elastic modulus and ionic radius are crucial for Eh regression. A classification model, which displays an accuracy of 0.919, precision of 0.937, F1-score of 0.932, and recall of 0.935, screens 682![[thin space (1/6-em)]](https://www.rsc.org/images/entities/char_2009.gif) 143 stable perovskite oxides from 1
143 stable perovskite oxides from 1![[thin space (1/6-em)]](https://www.rsc.org/images/entities/char_2009.gif) 126
126![[thin space (1/6-em)]](https://www.rsc.org/images/entities/char_2009.gif) 668 virtual perovskite-type combinations. The Eh values of the predicted stable perovskites are forecasted by a regression model with a coefficient of determination of 0.916, and root mean square error of 24.2 meV atom−1. Good agreement is observed between the regression model predicted and density functional theory-calculated Eh values.
668 virtual perovskite-type combinations. The Eh values of the predicted stable perovskites are forecasted by a regression model with a coefficient of determination of 0.916, and root mean square error of 24.2 meV atom−1. Good agreement is observed between the regression model predicted and density functional theory-calculated Eh values.
1. Introduction
Perovskite oxides have attracted significant attention as prospective materials for a diverse range of scientific applications due to their fascinating physical and chemical properties.1,2 Notably, perovskite oxides that manifest both ionic and electronic conductivities and possess catalytic activities for oxygen reduction and fuel oxidation are frequently employed as electrode materials in solid oxide fuel cells.3–5 Additionally, they also have been broadly utilized as chemical sensors, photocatalysts for water splitting, and electrode materials for batteries and supercapacitors.6–8The wide-ranging applications of perovskite oxides can also be attributed to their compositional flexibility.9 The structure diagrams of single and double perovskite oxides are displayed in Fig. 1. Despite the simple general formula of single perovskite oxides for ABO3 and double perovskite oxides for A2B′B′′O6, where A and B are different metal cations, and O represents oxygen, a wide variety of cations can be incorporated into their A- and B-sites.10 For an ideal cubic perovskite oxide, the larger A-site cation, typically a rare-earth or alkaline-earth metal, is situated in a 12-fold coordinated site surrounded by 12 oxygen ions. In comparison, the smaller B-site cation, usually a transition metal, occupies an octahedral site surrounded by six oxygen ions (BO6 octahedron).2
 | ||
| Fig. 1 Structure diagrams of (a) single and (b) double perovskite oxides.11 | ||
Up to now, several strategies have been proposed to screen thermodynamically stable perovskite oxides from perovskite-type compounds. Among these approaches, empirical regularities are initially advocated. For example, Goldschmidt suggested a tolerance factor, defined as
 | (1) |
 | (2) |
Density functional theory (DFT) was also employed to predict the thermodynamic stability of perovskite oxides. This is achieved by the calculation of their energy above the convex hull (Eh).16–20 Basically, Eh is calculated with the energy difference between the perovskite oxides and the convex hull which is constructed by linking phases or linear combination of phases with the lowest formation energy using tie lines at specific compositions.17,21 It can be calculated by eqn (3) and (4):17
 | (3) |
 | (4) |
 and E(ABO3) are the formation energy and total energy of the ABO3 compound, respectively, μA, μB and μO are the chemical potentials of A, B and O, respectively, and
  and Hf are the energy above the convex hull and the convex hull energy of the ABO3 compound, respectively.
Theoretically, for stable perovskite oxides, their Eh values equal to zero. The bigger the Eh values, the worse the phase stability of perovskite oxides.22 For instance, Emery et al.18 filtered 383 perovskite oxides for thermochemical water splitting from 5329 ABO3 compounds based on the criteria of their stability and oxygen vacancy formation energy using high-throughput DFT. Jacobs et al.19 used high-throughput DFT to investigate the phase stability of perovskite oxides under their operating conditions. They calculated the Eh values of 2145 perovskite compounds and obtained 52 potential perovskite cathode materials for solid oxide fuel cells with superior thermodynamic stability. Ma et al.23 employed DFT calculations to screen stable perovskite oxides for high-power vacuum electronic and thermionic energy conversion devices. From 2900 perovskite oxides, they obtained seven promising candidates with the Eh values of lower than 42 meV atom−1. Emery and Wolverton17 predicted the thermodynamic stability of 5329 compounds using DFT, from which 395 stable perovskite oxides were filtered based on the Eh threshold value of 25 meV atom−1.
Even though DFT is effective in predicting the stability of perovskite oxides, it is limited by high cost and computation time.24,25 Recently, machine learning (ML) methods have been employed to predict the stability and/or Eh values of perovskite oxides.22,26–31 ML models are constructed on sample data originating from experimental and computational methods to make classification and regression with higher efficiency, lower cost, and less computation time.25 For example, Zhao and Wang12 built a random forest classification model to predict the stability of single perovskite oxides. They found that the highest occupied molecular orbital (HOMO) energy and Zunger's pseudopotential radius of the B-site elements were two of the most important features. 430 stable perovskite oxides such as HfVO3, OsVO3, and TaCrO3 were screened from 2229 perovskite-type combinations under the threshold of Eh ≤ 50 meV atom−1. Liu et al.32 constructed a random forest regression model to screen stable perovskite oxides for solar cells. The model successfully filtered out 236 promising stable ferroelectric photovoltaic perovskite oxides with suitable band gaps from a pool of 4![[thin space (1/6-em)]](https://www.rsc.org/images/entities/char_2009.gif) 058
058![[thin space (1/6-em)]](https://www.rsc.org/images/entities/char_2009.gif) 905 candidate compositions with a coefficient of determination (R2) of 0.932 and a root mean square error (RMSE) of 0.196 eV. Liu et al.26 constructed classification models to screen stable and metastable perovskite oxides from ABO3 compounds. They observed that a gradient boosting decision tree classifier outperformed its counterparts in accuracy, and the tolerance factor played the dominant role in differentiating perovskites from oxide compounds. 37 stable and 13 metastable perovskites were regarded as promising candidates for further investigation. Li et al.22 trained classification and regression models to project the thermodynamic stability and Eh values of perovskite oxides. The top-performing extra trees classification algorithm achieved an accuracy of around 0.93, whereas the leading kernel ridge regression model had a RMSE of approximately 28.5 meV atom−1. Chen et al.33 developed a particle swarm optimization-support machine regression (PSO-SVR) model to predict the Eh values of ABO3-type compounds. The R2 and RMSE of the model were 0.957 and 87 meV atom−1, respectively. YVO3, YNiO3, SrZrO3, RbPaO3, LaFeO3, and PrAlO3 were predicted as stable perovskite oxides. Schmidt et al.34 presented a ML strategy to predict the thermodynamic stability of solids including perovskites by predicting their Eh values. ML models trained on algorithms of ridge regression, random forests, extremely randomized trees, and neural networks, were applied to a dataset that contained around 250
905 candidate compositions with a coefficient of determination (R2) of 0.932 and a root mean square error (RMSE) of 0.196 eV. Liu et al.26 constructed classification models to screen stable and metastable perovskite oxides from ABO3 compounds. They observed that a gradient boosting decision tree classifier outperformed its counterparts in accuracy, and the tolerance factor played the dominant role in differentiating perovskites from oxide compounds. 37 stable and 13 metastable perovskites were regarded as promising candidates for further investigation. Li et al.22 trained classification and regression models to project the thermodynamic stability and Eh values of perovskite oxides. The top-performing extra trees classification algorithm achieved an accuracy of around 0.93, whereas the leading kernel ridge regression model had a RMSE of approximately 28.5 meV atom−1. Chen et al.33 developed a particle swarm optimization-support machine regression (PSO-SVR) model to predict the Eh values of ABO3-type compounds. The R2 and RMSE of the model were 0.957 and 87 meV atom−1, respectively. YVO3, YNiO3, SrZrO3, RbPaO3, LaFeO3, and PrAlO3 were predicted as stable perovskite oxides. Schmidt et al.34 presented a ML strategy to predict the thermodynamic stability of solids including perovskites by predicting their Eh values. ML models trained on algorithms of ridge regression, random forests, extremely randomized trees, and neural networks, were applied to a dataset that contained around 250![[thin space (1/6-em)]](https://www.rsc.org/images/entities/char_2009.gif) 000 cubic perovskites. They found that extremely randomized trees displayed the best performance, with a mean absolute error (MAE) of 121 meV atom−1.
000 cubic perovskites. They found that extremely randomized trees displayed the best performance, with a mean absolute error (MAE) of 121 meV atom−1.
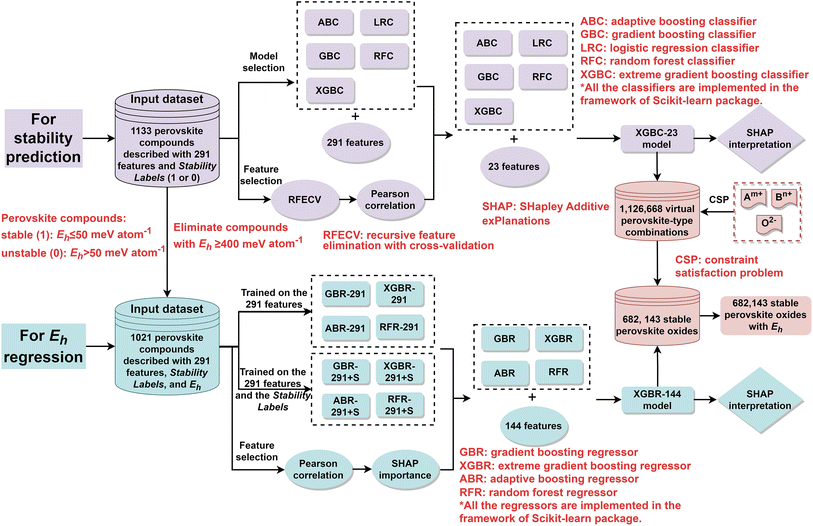
However, the black box nature of ML models poses a challenge in model interpretation. Herein, interpretable ML was applied to screen perovskite oxides from virtual perovskite-type combinations and extract scientific insights. The workflow of this study is shown in Fig. 2. Initially, five classification models were trained on an input dataset composed of 1133 single and double perovskite compounds14,28,35–37 that are described with 291 features. For feature selection, recursive feature elimination with cross-validation (RFECV) and Pearson correlation were successively applied to the 291 features, and 23 features were finally selected. After feature selection, five classification models were constructed on the optimal 23 features, and a XGBC-23 that outperformed its counterparts was then interpreted by SHapley Additive exPlanations (SHAP), which is a powerful tool for interpreting and understanding the predictions of ML models based on SHAP values which measures the contribution of each feature to the output of the models.38 The model was thereafter utilized to screen stable perovskites from 1![[thin space (1/6-em)]](https://www.rsc.org/images/entities/char_2009.gif) 126
126![[thin space (1/6-em)]](https://www.rsc.org/images/entities/char_2009.gif) 668 virtual perovskite-type combinations that were generated by a constraint satisfaction problem (CSP) technique.12 Afterward, various regression models, trained on an input dataset composed of 1021 perovskite compounds that were described with the 291 features, and the 291 features plus the stability label of the compounds, were constructed. It has to be noted that 112 compounds with Eh values of higher than 400 meV atom−1 were deleted for regression model training since we focus our attention on screen stable perovskite oxides. After Pearson correlation and SHAP importance investigation, 143 features were selected. Then, four regression models were constructed on 144 features (143 features and the stability label), and a XGBR-144 model which displayed the best performance. The model was then interpreted by SHAP, and the Eh values of 682
668 virtual perovskite-type combinations that were generated by a constraint satisfaction problem (CSP) technique.12 Afterward, various regression models, trained on an input dataset composed of 1021 perovskite compounds that were described with the 291 features, and the 291 features plus the stability label of the compounds, were constructed. It has to be noted that 112 compounds with Eh values of higher than 400 meV atom−1 were deleted for regression model training since we focus our attention on screen stable perovskite oxides. After Pearson correlation and SHAP importance investigation, 143 features were selected. Then, four regression models were constructed on 144 features (143 features and the stability label), and a XGBR-144 model which displayed the best performance. The model was then interpreted by SHAP, and the Eh values of 682![[thin space (1/6-em)]](https://www.rsc.org/images/entities/char_2009.gif) 143 predicted stable perovskites were projected by it. It is believed that the models proposed in this study can be used to screen stable perovskite oxides for diverse applications, such as perovskite-type electrode materials for solid oxide fuel cells and protonic ceramic fuel cells.
143 predicted stable perovskites were projected by it. It is believed that the models proposed in this study can be used to screen stable perovskite oxides for diverse applications, such as perovskite-type electrode materials for solid oxide fuel cells and protonic ceramic fuel cells.
2. Experimental
An input dataset composed of 337 single perovskite compounds and 706 double perovskite compounds was collected for ML model training. The number of occurrences for each element in the perovskite compounds from the input dataset is shown in Fig. 3. 44 and 63 elements were, respectively, involved for the A- and B-sites. For the sake of uniformity, we recognized the appearance frequency for each A- and/or B-site element of single and symmetric double perovskites as two times. Hence, the overall number of appearances for the A-site or B-site was 2266 times. For the A-site, Ba was the most frequent element, followed by Sr, Ca, La, and Pb, which all of them appeared more than 100 times. Regarding the B-site, Mn was the most frequent element with 122 times, followed by Nb, Fe, Co, and Ta, which all of them appeared more than 90 times. The B-site elements were more scattered than the A-site elements, which is because more elements can occupy the B-site of perovskite oxides.39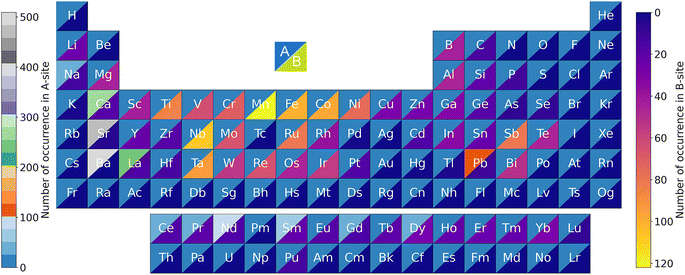 | ||
| Fig. 3 Number of occurrences of the A- and B-site elements of the perovskite compounds in the input dataset. | ||
Each compound in the input dataset was described with 291 features, a stability label, and a Eh value. An Eh cutoff value of 50 meV atom−1 was used to separate stable and unstable perovskite compounds, where those with 0 meV atom−1 ≤ Eh ≤ 50 meV atom−1 and Eh > 50 meV atom−1 were labeled as stable (label 1) and unstable perovskite oxides (label 0), respectively.12 The appearance frequency distribution of the Eh values of the perovskite compounds in the input dataset is shown in Fig. 4. It can be seen that 508 samples had the Eh values of 0 meV atom−1, while the Eh values of 182 samples were in the range of (0, 50) meV atom−1, and 112 samples had the Eh values of bigger than 400 meV atom−1. For regression model training, the compounds from the input dataset with Eh values of bigger than 400 meV atom−1 (112 compounds) were deleted since we focused our attention on screening stable perovskite oxides. Therefore, 237 single perovskite compounds and 784 double perovskite compounds were adopted for regression model training.
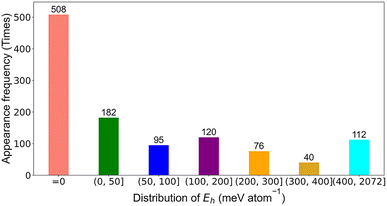 | ||
| Fig. 4 The appearance frequency distribution of the Eh values of the perovskite compounds in the input dataset. | ||
The thermodynamic stability of perovskite oxides is fundamentally determined by their constituents, which manifest in their properties and interactions. Therefore, three types of fundamental features: geometric, atomic, and elemental features were employed for the A- and B-site elements (Table 1). Based on these three types of fundamental features, 291 features were generated. Since the A- and B-site cations of antisymmetric double perovskite oxides are different, supplementary features generated from the fundamental features except for TF, OF, IRR, and MF were introduced. For example, for the fundamental feature BP, 11 supplementary features were generated which were the boiling points of elements A and B (A1_BP, A2_BP, B1_BP, B2_BP), the average and mismatch boiling points of them (BP_A+, BP_A−, BP_B+, BP_B−), the average, difference, and ratio of the BP between them (BP_AB_avg, BP_AB_diff, BP_AB_ratio). A1, A2, B1, and B2 represent the A- and B-site elements of double perovskite oxides (A1A2B1B2O6), respectively. For single perovskites (ABO3), A1 and B1 are, respectively, the same as A2 and B2. In addition, two complex features: ΔENAO * IRR and ΔENBO * OF were also introduced.26
| Types | Features |
|---|---|
| Geometric features | Tolerance factor (TF, t),40 octahedral factor (OF, μ),41 the ratio of ionic radii ratio a to O (IRR, rA/rO), mismatch factor (MF),37 bond length (BL, Å), atomic volume (AV, cm3 mol−1), ICSD (inorganic crystal structure database) volume (IV, Å3)42 |
| Atomic features | Highest occupied molecular orbital energy (HOMO, eV),37 lowest unoccupied molecular orbital energy (LUMO, eV),37 ionic radius (IR, Å), atomic weight (AW), covalent radius (CR, pm), ionization energy (IE, kJ mol−1), atomic radius (AR, Å), electron affinity (EA, kJ mol−1), mendeleev number (MN), first ionization potential (FIP, V), electronegativity (EN), Zunger's pseudopotential radius (ZR, a.u.)43 |
| Elemental features | Modulus of elasticity (ME, MMPa), boiling point (BP, K), melting point (MP, K), density (DT, kg m−3), coefficient of thermal expansion (CTE, ×10−6 K−1), specific heat capacity (SHC, J g−1 K−1)), thermal conductivity (TC, W m−1 K−1), electrical conductivity (EC, ×10−6 m−1 Ω−1), the heat of fusion (HF, kJ mol−1), the heat of vaporization (HV, kJ mol−1) |
| Complex features | ΔENAO * IRR, ΔENBO * OF |
Regarding feature selection for perovskite stability classification, a recursive feature elimination with cross-validation (RFECV) executed in the Scikit-learn package was employed to eliminate redundant features from the 291 features.44 The pairwise Pearson correlate coefficients of the residual features were then calculated, and the features with strong correlations were abandoned. Finally, 23 features were used for classification model training (Table S1†). In terms of feature selection for Eh regression, the pairwise Pearson correlate coefficients of the 291 features were initially calculated, and the features with high correlations were deleted. Afterward, the importance of the remaining features was investigated by SHAP, and those with zero mean absolute SHAP values were eliminated. 143 features were finally singled out from the 291 features for regression model training.
To choose suitable algorithms for the prediction of the stability and Eh values of perovskite oxides, several different algorithms were employed to train classification and regression models. For classification models, an adaptive boosting classifier (ABC), gradient boosting classifier (GBC), logistic regression classifier (LRC), random forest classifier (RFC), and extreme gradient boosting classifier (XGBC) executed in the Scikit-learn package in Python were adopted.44 Regarding the regression models, four algorithms: gradient boosting regressor (GBR), adaptive boosting regressor (ABR), random forest regressor (RFR), and extreme gradient boosting regressor (XGBR) in the framework of the Scikit-learn package in Python were utilized.44 During model training, the input dataset was divided into training and testing datasets with a ratio of 75![[thin space (1/6-em)]](https://www.rsc.org/images/entities/char_2009.gif) :
:![[thin space (1/6-em)]](https://www.rsc.org/images/entities/char_2009.gif) 25. Grid search with 10-fold cross-validation was employed to optimize the hyperparameters of the models. The hyperparameters for various classification and regression models are listed in Table S2.† During algorithm selection, statistical significance tests were executed in the SciPy package of Python for some models with similar performance. We employed t-test to assess the significance of differences in accuracy and R2 among the tested classification and regression algorithms, respectively. The significance level was set at 0.05.
25. Grid search with 10-fold cross-validation was employed to optimize the hyperparameters of the models. The hyperparameters for various classification and regression models are listed in Table S2.† During algorithm selection, statistical significance tests were executed in the SciPy package of Python for some models with similar performance. We employed t-test to assess the significance of differences in accuracy and R2 among the tested classification and regression algorithms, respectively. The significance level was set at 0.05.
For classification models, five indices: accuracy, precision, recall, F1-score and area under the receiver operating characteristic (ROC) curve (AUC) calculated from binary confusion matrices were used to evaluate their performance. The binary confusion matrix is a two-dimensional table, of which the rows and columns represent the actual and predicted classes that the perovskite compounds belong to, respectively. Therefore, four types of results: true positives (TP), false negatives (FN), false positives (FP), and true negatives (TN) are included in the matrix.12 The formulas of the four indices are shown in eqn (5)–(8). Accuracy refers to the proportion of correct predictions made by the classification models, while precision and recall measure the percentage of TP out of all predicted positives and actual positives, respectively. Regarding F1-score, it is calculated as the harmonic mean of precision and recall, which attempts to strike a balance between them. A ROC curve, plotting the true positive rate (TPR, eqn (9)) against the false positive rate (FPR, eqn (10)) at different thresholds, depicts the performance of a classification model at all discrimination thresholds.
In terms of the regression models, three indices: R2, RMSE and MAE were employed to evaluate their quality.45,46 R2 is a measure of how accurately regression models can predict unseen instance. A higher R2 value indicates better model performance and overall quality. RMSE is a commonly used index for indicating the accuracy of regression models, as it quantifies the discrepancies between predicted values and actual values. MAE is the average of the absolute differences between practical and forecasted values. The formulas for these three indices are shown in eqn (11)–(13), where yi and ỹi are the actual values and predicted values of the ith instance in the testing dataset, respectively, ȳ is the mean actual values of all the n instances.
 | (5) |
 | (6) |
 | (7) |
 | (8) |
 | (9) |
 | (10) |
 | (11) |
 | (12) |
 | (13) |
To screen potential single and double perovskite oxides from previously unseen instances, virtual perovskite-type combinations with symmetric and antisymmetric double perovskite compounds were generated using a constraint satisfaction problem (CSP) technique under the restrictions of charge neutrality and Goldschmidt tolerance factor t, which had been reported in our previous study.12 It should be emphasized that the symmetric virtual double perovskite-type combinations were regarded as single perovskite-type combinations. Since the t values of perovskite oxides are normally in the range of 0.89 to 1.06,47 we limited it to the range of 0.90 to 1.10 during virtual combinations generation.
3. Results and discussion
3.1 Perovskite stability classification
The performance of the classification models trained on the 291 features is shown in Fig. 5(a) and Table 2. The XGBC model outperforms its counterparts. The accuracy, precision, recall, F1-score, and the receiver operating characteristic (ROC) curves (AUCs) of it were 0.908, 0.922, 0.932, 0.927, and 0.970, respectively. Achieving identical results in accuracy (0.901), precision (0.916), recall (0.921), and F1-score (0.927), the GBC and LRC models diverged only in their AUCs, with values of 0.968 and 0.937, respectively. Regarding the ABC and RFC models, they yielded similar results in terms of accuracy, recall, and AUC. However, a distinction emerged in their precision and F1-score, with the ABC model achieving 0.935 and 0.898, respectively, and the RFC model attaining 0.925 and 0.910, respectively. During the training of these models, default hyperparameters of these algorithms were used. Given the comparable performance of the GBC and XGBC models, a statistical significance test (t-test) was conducted to assess their difference. The p-value for it was 0.00195, indicating that there was a significant difference between the two algorithms.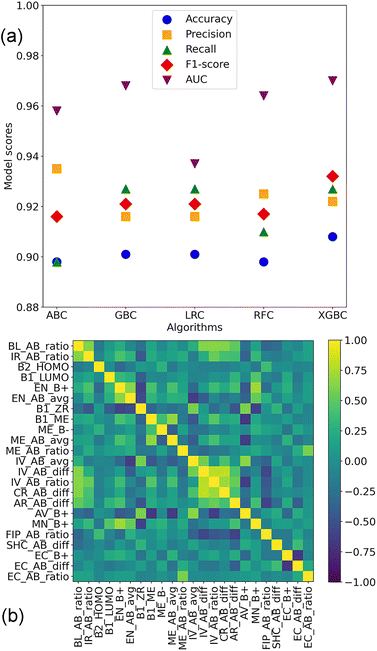 | ||
| Fig. 5 (a) Performance of the classification models trained on the 291 features. (b) Pairwise Pearson correlation coefficient heatmap of the 23 features. | ||
| Algorithms | Accuracy | Precision | Recall | F1-score | AUC |
|---|---|---|---|---|---|
| ABC | 0.898 | 0.935 | 0.916 | 0.898 | 0.958 |
| GBC | 0.901 | 0.916 | 0.921 | 0.927 | 0.968 |
| LRC | 0.901 | 0.916 | 0.921 | 0.927 | 0.937 |
| RFC | 0.898 | 0.925 | 0.917 | 0.910 | 0.964 |
| XGBC | 0.908 | 0.922 | 0.932 | 0.927 | 0.970 |
Concerning feature selection for classification, 34 features were singled out from the 291 features (Table S1†). The pairwise Pearson correlation coefficient heatmap of them was investigated (Fig. S1†). It was found that 17 pairs of them were with strong correlations. For instance, the pairwise coefficient between AR_AB_avg and IV_AB_avg is 0.99. Thus, 11 of the 34 features (Table S1†) were removed, and the pairwise Pearson correlation coefficient heatmap of the 23 optimal features is shown in Fig. 5b. Apart from geometrical and atomic properties, elemental properties such as modulus of elasticity of elements A and B were also essential in predicting the thermodynamic stability of perovskite oxides. Moreover, out of the 23 features, 14 of them involved the characteristics of both the A- and B-site elements, 9 features engaged the attributes of the B-site elements, while none of the features exclusively pertained to the A-site elements. This indicated that the perovskite stability was determined by the attributes of the A- and B-site elements, especially for the B-site elements.
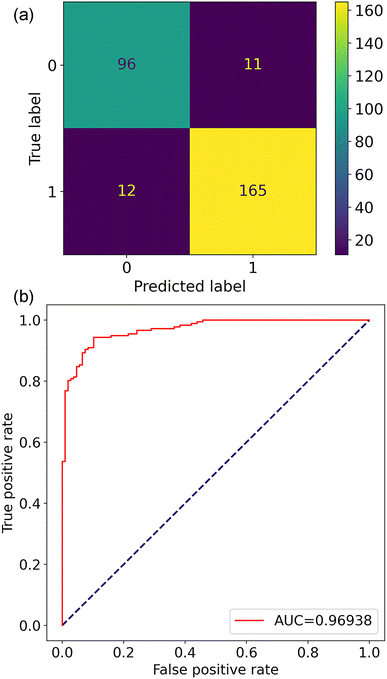
After model and feature selection, an XGBC-based classification model named XGBC-23 was trained on the 23 features for perovskite stability prediction. The resulting confusion matrix and ROC curve are shown in Fig. 6. In comparison with the XGBC model trained with the 291 features, the XGBC-23 model provided improved accuracy, precision, recall, and F1-score, which were 0.919, 0.937, 0.935, and 0.932, respectively. Regarding the AUC, it was 0.969 for the XGBC-23 model, which was comparable to the XGBC model trained with 291 features, indicating its excellent performance in distinguishing thermodynamically stable and unstable perovskite oxides.
Classification models trained on the 23 features using ABC, LRC, GBC, and RFC algorithms were also constructed. The hyperparameters of these models were tuned using grid search with 10-fold cross-validation (Table S2†). According to Table 3, the XGBC-23 model still displayed the best performance. All the evaluation metrics of the ABC-23, GBC-23, and RFC-23 models witnessed a little bit of decrease compared to their counterparts that trained on the 291 features. However, the performance of the LRC-23 model observed a dramatic decrease as compared to the LRC model trained on the 291 features. The accuracy, precision, recall, F1-score, and AUC declined from 0.901, 0.916, 0.921, 0.927, and 0.937 to 0.732, 0.767, 0.819, 0.792, and 0.831, respectively. The confusion matrices and ROC curves of the ABC-23, GBC-23, LRC-23, and RFC-23 models can be seen in Fig. S2,† S3. Since the GBC-23 and XGBC-23 models had similar performance, a statistical significance test (t-test) was executed for them. The p-value for it was 0.00391, implying the significant difference between the two algorithms. Therefore, the XGBC-23 model can be a promising candidate for screening stable perovskite oxides from perovskite-type compounds.
| Algorithms | Accuracy | Precision | Recall | F1-score | AUC |
|---|---|---|---|---|---|
| ABC-23 | 0.873 | 0.908 | 0.887 | 0.897 | 0.927 |
| GBC-23 | 0.908 | 0.931 | 0.921 | 0.926 | 0.969 |
| LRC-23 | 0.732 | 0.767 | 0.819 | 0.792 | 0.831 |
| RFC-23 | 0.898 | 0.916 | 0.921 | 0.918 | 0.961 |
| XGBC-23 | 0.919 | 0.937 | 0.935 | 0.932 | 0.969 |
| XGBC-ref. 22 | 0.917 | 0.924 | 0.803 | 0.859 | 0.959 |
The XGBC-23 model of this study even displayed better performance than the XGBC-ref model (Table 3 and Fig. S4†). More specifically, the two models obtained similar results in accuracy and AUC. Nevertheless, the precision (0.924), recall (0.803), and F1-score (0.859) of the XGBC-ref model were lower than that of the XGBC-23 model. Therefore, the XGBC-23 model can be a promising candidate for screening stable perovskite oxides from perovskite-type compounds.
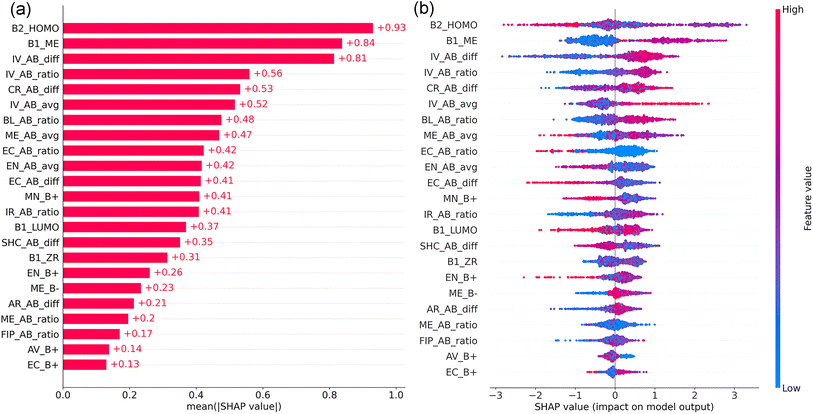
To explore the importance and interactions of the 23 features, SHAP was employed to interpret the XGBC-23 model (Fig. 7). Fig. 7(a) displays the SHAP feature importance of the 23 features. In contrast to their counterparts, B2_HOMO, B1_ME, and IV_AB_diff exhibited pronounced significance, as evidenced by their mean absolute SHAP values (MASVs) exceeding 0.8, indicating the predominant role of the electron loss capability and the elastic modulus of the B-site elements, and the ICSD volume difference between atoms A and B in determining the thermodynamic stability of perovskite oxides. After them, the next eight features, which consider properties related to the A- and B-site elements, including IV_AB_ratio, CR_AB_diff, and IV_AB_avg, exhibited notable importance, each demonstrating MASVs surpassing 0.4. Nevertheless, FIP_AB_ratio, AV_B+, and EC_B+ were discerned to exhibit minimal significance, each characterized by MASVs of less than 0.2.
Shown in Fig. 7(b) is the SHAP summary plot for the XGBC-23 model. Each dot in the figure represents a perovskite compound per feature. Its position on the x-axis is determined by its SHAP value. The y-axis indicates the features, in order of importance from top to bottom. Overlapping dots shift in the y-axis direction. The color of a dot from red to blue denotes its feature value from high to low. A positive SHAP value for a feature means that the feature has a positive impact on the model prediction, whereas a negative SHAP value for a feature indicates the feature deteriorates the model prediction.
According to Fig. 7(b), medium B2_HOMO promoted the thermodynamic stability of perovskite oxides. Since HOMO is the orbital with the highest energy that contains electrons, and its energy equals the minus vertical ionization potential that describes the minimum energy required to remove an electron from an atom, without changing its geometry,48–51 the stability of perovskite oxides is negatively impacted by either excessively reactive or highly inert B-site atoms.
Perovskite oxides are not strictly ionic, they possess a notable covalent nature in their bonds.36 ME quantifies bond stiffness, a property strongly influenced by bond length.52 Shorter and stronger bonds contribute to a stiffer lattice, resulting in higher ME values.52 Since the B-site cations are in 6-fold coordination with the oxygen ions in the perovskite structure forming BO6 octahedra, a higher B-site modulus (B1_ME) means the BO6 octahedra are less deformable and better able to maintain the geometry required for stability. Due to the typically A-site rare-earth, alkaline, or alkaline-earth metals have lower ME than the normally B-site transition metals, lower ME_AB_ratio pushes the stability of perovskite oxides. Additionally, a balance can be struck between the lower ME of the A-site element and the bigger ME of the B-site element, where a moderate ME_AB_avg promoted the stability of perovskite oxides.
For the perovskite structure, the atom A and A–O bond length are usually larger and longer than the atom B and B–O bond length;15,53 therefore, greater feature values of IV_AB_diff, IV_AB_ratio, IV_AB_avg, CR_AB_diff, BL_AB_ratio, IR_AB_ratio, and AR_AB_diff, and lower feature values of AV_B+ were beneficial to the stability of perovskite oxides.
The electronegativities of the elements occupying the A- and B-sites in perovskite oxides are typically lower than that of oxygen. Therefore, the covalent or ionic nature of the A–O and B–O bonds is dictated by the difference in electronegativity between the A/B elements and oxygen.54 It has been observed that the ionic character of the A–O bond contributes to the stabilization of the cubic perovskite structure.55 Thus, elements at the A-site with lower electronegativity and larger cation size are conducive to the stability of the cubic perovskite structure.55 Given that the B-site element is generally more electronegative than the A-site element, the B–O interaction is typically stronger than the A–O interaction.55 B-site elements with relatively lower electronegativity may not form a B–O bond that is strong enough to maintain a stable perovskite structure. Conversely, B-site elements with higher electronegativity could induce distortions due to octahedral tilting.55 Hence, medium EN_B+ and EN_AB_avg are advantageous for the stability of cubic perovskite oxides.
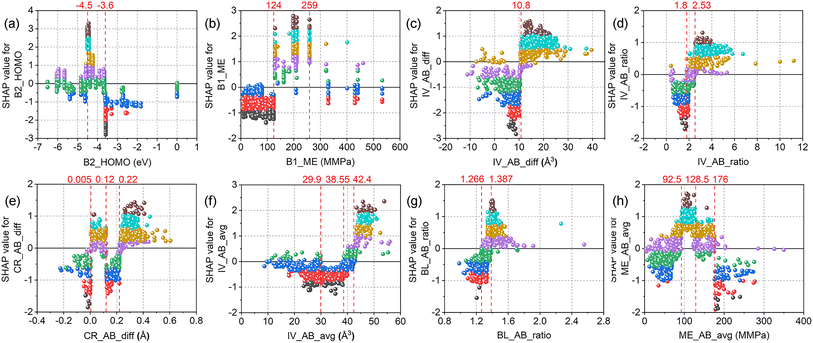
SHAP dependence plots of the top eight features for the XGBC-23 model are illustrated in Fig. 8. As can be seen in Fig. 8(a), perovskite oxides with B-site elements having B2_HOMO above −3.6 eV (e.g., Ru, Rh) tended to be unstable, while those with B2_HOMO at around −4.5 eV (e.g., Mn, Ni) were prone to be stable, as evidenced by the highest SHAP values obtained at B2_HOMO = −4.5 eV. In terms of B1_ME (Fig. 8(b)), most of the SHAP values were negative and positive when it was lower than 124 MMPa (e.g., Cu, Zr) and in the range of 124 to 259 MMPa (e.g., V, Mn), respectively. However, positive and negative SHAP values coexisted when B1_ME is higher than 330 MMPa (e.g., Rh, Ru). Regarding IV_AB_diff (Fig. 8(c)), two distinct regions with positive and negative SHAP values were observed. The ICSD volume differences between atoms A and B that were greater than 10.8 Å3 (e.g., Ba2GdBiO6, Sr2CaOsO6) were favorable for the stability of perovskite oxides. On the contrary, the perovskite stability deteriorates when IV_AB_diff was lower than 10.8 Å3 (e.g., PrSrLiTeO6, Nd2MgPtO6). However, some exceptions with IV_AB_diff of lower than 10.8 Å3 had positive SHAP values, taking MnGeO3 (IV_AB_diff = −5 Å3) as an example. For IV_AB_ratio (Fig. 8(d)), the SHAP values were positive and negative when it was higher than 2.53 (e.g., SrTiO3, Sr2GaNbO6) and lower than 1.80 (e.g., TmTiO3, La2CaZrO6), respectively. A transition zone was also witnessed with positive and negative SHAP values coexisting. Therefore, the perovskite stability can be stimulated by a higher IV_AB_ratio. Concerning CR_AB_diff (Fig. 8(e)), the perovskite stability was promoted when it was in the range of 0.005 to 0.12 Å (e.g., PbZrO3, Pb2CoMoO6), and higher than 0.22 Å (e.g., EuAlO3, Ba2LaPuO6). However, when it was in the range of 0.12 to 0.22 Å, and lower than 0.005 Å, the SHAP values were negative, and therefore the stability of perovskites was ruined. Regarding IV_AB_avg (Fig. 8(f)), all the SHAP values were positive when IV_AB_avg was higher than 42.4 Å3 (e.g., Ba2SrTeO6, Sr2YbSbO6), while all the SHAP values were negative when IV_AB_avg was in the range of 29.9 to 38.55 Å3 (e.g., LaSrCuSbO6, BaLaMgNbO6). Two overlapping zones with positive and negative SHAP values coexisting were also presented. For BL_AB_ratio (Fig. 8(g)), higher SHAP values were obtained when it was at around 1.4 (e.g., Ba2HoRuO6, Ba2CeSnO6), while the SHAP values were negative when it was lower than 1.266. A transition zone was also observed where the SHAP values underwent a transition from negative to positive. About ME_AB_avg (Fig. 8(h)), positive SHAP values were acquired when the feature values were greater than 92.5 MMPa and lower than 128.5 MMPa. Negative SHAP values were obtained when ME_AB_avg was higher than 176 MMPa. However, when the feature values were outside the range of 92.5 to 128.5 MMPa, negative and positive SHAP values were both observed.
3.2 Perovskite Eh value regression
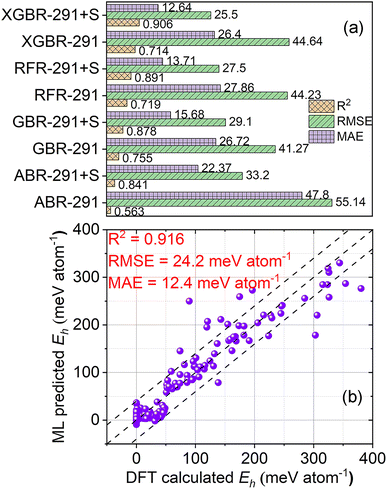
For regression algorithm selection, regression models that were trained on the 291 features and the 291 features and the stability label were constructed. As depicted in Fig. 9(a), the GBR-291 model demonstrated the highest R2 of 0.755 and the lowest RMSE of 41.27 meV atom−1. Despite having lower R2 and higher RMSE values compared to the GBR-291 model, the XGBR-291 model had a slightly lower MAE (MAE = 26.40 meV atom−1) than the GBR-291 model (MAE = 26.72 meV atom−1). The RFR-291 and XGBR-291 models yielded similar R2 and RMSE, while the performance of the ABR-291 model was inferior to other regression models. With the addition of the stability label as a feature for model training, the performance of the regression models was significantly enhanced. For example, compared to the GBR-291 model, the GBR-291 + S model had an increased R2 of 0.878, and decreased RMSE and MAE of 29.1 and 15.68 meV atom−1, respectively. The most notable improvement was seen in the XGBR-291 + S model, which exhibited the best performance after the introduction of the stability label for model training. Its R2, RMSE, and MAE were 0.906, 25.5 meV atom−1, and 12.64 meV atom−1, respectively.For feature selection, 143 features were finally singled out from the 291 features. Therefore, an XGBR-144 regression model for predicting the Eh values of perovskite oxides was developed on the 143 features and the stability label (Fig. 9(b) and Table 4). The R2, RMSE, and MAE of the model were 0.916, 24.2 meV atom−1, and 12.4 meV atom−1, respectively. The performance of the XGBR-144 model is comparable to or better than previously reported models for Eh regression.22,33,34,56 One of the reasons may be attributed to the adoption of the stability label as one of the features for regression model training.
| Algorithms | R2 | RMSE (meV atom−1) | MAE (meV atom−1) |
|---|---|---|---|
| RFR-144 | 0.893 | 27.3 | 13.9 |
| GBR-144 | 0.896 | 26.8 | 14.3 |
| ABR-144 | 0.876 | 29.3 | 17.5 |
| XGBR-144 | 0.916 | 24.2 | 12.4 |
| XGBR-ref. 22 | 0.781 | 46.63 | 21.96 |
To provide a more rigorous comparison, we also constructed regression models of RFR-144, GBR-144, and ABR-144 using the RFR, GBR, and ABR algorithms on the 143 features and the stability label, respectively, and a regression model of XGBR-ref using the XGBR algorithm on the features of ref. 22, as displayed in Fig. S5, S6† and Table 4. The XGBR-144 model exhibited the best performance among all the regression models. The RFR-144 and GBR-144 models displayed comparable performance in all three metrics, while the ABR-144 showed the worst performance in the four models of this study. In light of the analogous performance demonstrated by the GBR-144 and XGBR-144 models, a statistical significance test, specifically a t-test, was employed to appraise potential distinctions between them. The p-value for it was 2.67 × 10⁻¹⁰, which indicated the significant differences between the two algorithms. In terms of the XGBR-ref model, its R2, RMSE, and MAE were 0.781, 46.63 meV atom−1, and 21.96 meV atom−1, respectively.
Fig. 10a presents the SHAP feature importance of the top ten features for the XGBR-144 model. The stability label was the most important feature, with a MASV of 0.0653. Given the overall MASV for all features was 0.1291, the stability label accounted for 50.58%. Besides the stability label, IR_AB_diff, BL_AB_diff, and A2_ME were three of the most important features. Therefore, the ionic radius difference between the A- and B-site cations, the A–O and B–O bond length difference, as well as the elastic modulus of the A-site elements, were all significant indicators for Eh values of perovskite oxides. Furthermore, among the top ten features, the fundamental features of ME and IR were involved four and two times, respectively, revealing their significant roles in predicting the Eh values of perovskite oxides.
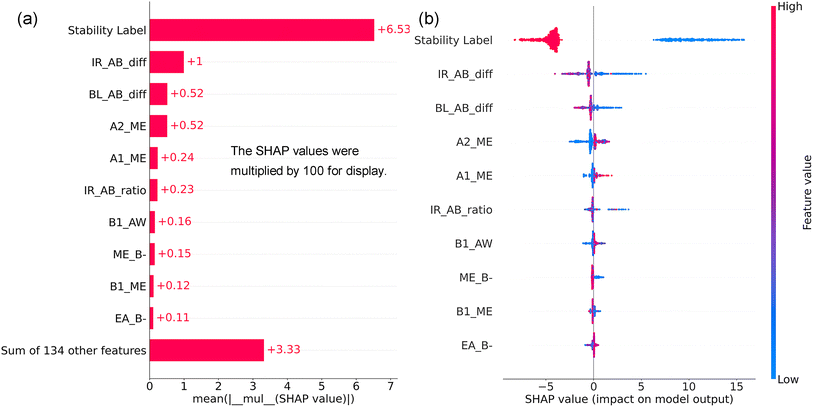 | ||
| Fig. 10 SHAP feature importance (a) and summary plot (b) of the top ten features of the XGBR-144 model. | ||
Fig. 10b illustrates the SHAP summary plot of the ten features for the XGBR-144 model. The SHAP values of the stability label that is 1 or 0 were all negative or positive, respectively, because stable perovskites had lower Eh values than unstable ones. Higher IR_AB_diff and BL_AB_diff pushed the decrease of Eh values. This phenomenon can be explained by the fact that the A-site cations typically have a larger ionic radius and a longer A–O bond length compared to the B-site cations and their corresponding B–O bond length. Moreover, the lower elastic modulus of the A-site elements (A2_ME and A1_ME) also promoted the reduction of the Eh values of perovskite oxides. This can be explained by the necessity for A-site elements to be flexible in accommodating variations in the sizes and positions of the surrounding BO6 octahedra. Reduced values of B1_AW and EA_B-, as well as medium IR_AB_ratio and increased ME_B-, had a beneficial effect in lowering the Eh values of perovskite oxides.
In Fig. 11, the SHAP dependence plots of the nine most important features of the XGBR-144 model are displayed. More specifically, when the ionic radius difference between elements A and B (IR_AB_diff, Fig. 11(a)) was greater than 0.32 Å (e.g., BaTeO3, La2MgZrO6) and lower than 0.54 Å (e.g., BaMnO3, Ba2CoIrO6), the SHAP values were negative and therefore stimulated the reduction of Eh values. Similarly, almost all the SHAP values were negative when IR_AB_ratio (Fig. 11(e)) was greater than 1.71 (e.g., YbTiO3, La2NaIrO6) and lower than 2.72 (e.g., SrCoO3, Sr2CoMnO6). From this, it can be inferred that the reduction of Eh values was aided by moderate IR_AB_diff and IR_AB_ratio. For BL_AB_diff (Fig. 11(b)), when the feature values were greater than 0.31 Å (e.g., Pb2FeTaO6, CeVO3), most of the SHAP values were negative; therefore, perovskites with longer A–O and shorter B–O bond lengths had lower Eh values. In terms of A2_ME (Fig. 11(c)) and A1_ME (Fig. 11(d)), when the feature values were less than 21 MMPa (e.g., Pb, Yb, Sr), the majority of the SHAP values were negative, which assist in the reduction of the Eh values. Looking at Fig. 11(f), the graph was split into two sections with positive and negative SHAP values by a boundary line at B1_AW = 59. Thus, adopting elements with atomic weights of less than 59 (e.g., Co, Ni, Fe) at the B-site bolstered the decrease of the Eh values. As shown in Fig. 11(g), a demarcation line at ME_B- = −178.3 MMPa divided the graph into two parts. When the feature values were greater than −178.3 MMPa (e.g., NaGdMgWO6, Ca2CoOsO6), practically all the SHAP values were negative. There is, however, no clear dividing line to separate Fig. 11(h) (B1_ME) into different regions with positive and negative SHAP values, which suggests that ME_B- can offer more information than B1_ME in predicting the Eh values of perovskites. For EA_B- (Fig. 11(i)), almost all the SHAP values were negative when it was lower than −18 kJ mol−1 (e.g., LaSrCoRuO6, Ba2TmBiO6). This facilitates the reduction of the Eh values of perovskites.
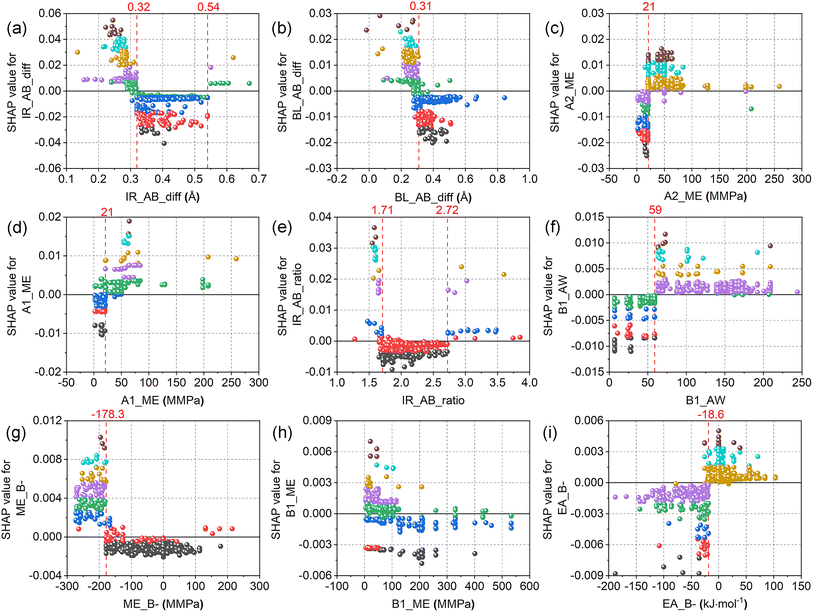 | ||
| Fig. 11 SHAP dependence plots of the top nine features of the XGBR-144 model: (a) IR_AB_diff, (b) BL_AB_diff, (c) A2_ME, (d) A1_ME, (e) IR_AB_ratio, (f) B1_AW, (g) ME_B-, (h) B1_ME, (i) EA_B-. | ||
3.3 Classification and regression model generalization
We applied the XGBC-23 and XGBR-144 models to the 1![[thin space (1/6-em)]](https://www.rsc.org/images/entities/char_2009.gif) 126
126![[thin space (1/6-em)]](https://www.rsc.org/images/entities/char_2009.gif) 668 virtual perovskite-type combinations, expecting to predict their stability and Eh values, respectively. It was found that 682
668 virtual perovskite-type combinations, expecting to predict their stability and Eh values, respectively. It was found that 682![[thin space (1/6-em)]](https://www.rsc.org/images/entities/char_2009.gif) 143 of the combinations were identified as stable perovskite oxides by the XGBC-23 model, and practically all the predicted stable perovskites were projected with Eh values less than 50 meV atom−1 by the XGBR-144 model, including 141
143 of the combinations were identified as stable perovskite oxides by the XGBC-23 model, and practically all the predicted stable perovskites were projected with Eh values less than 50 meV atom−1 by the XGBR-144 model, including 141![[thin space (1/6-em)]](https://www.rsc.org/images/entities/char_2009.gif) 545 of them having zero Eh values. Fig. 12 displays the Eh values of the projected stable perovskites related to their tolerance factor t in terms of numerical count (z-axis). The number of stable perovskites decreased with the increase of t and Eh values. Most of the stable perovskites were in the corner of the graph, where their t and Eh values of them were, respectively, in the range of 0.90 to 1.02 and 0 to 32 meV atom−1.
545 of them having zero Eh values. Fig. 12 displays the Eh values of the projected stable perovskites related to their tolerance factor t in terms of numerical count (z-axis). The number of stable perovskites decreased with the increase of t and Eh values. Most of the stable perovskites were in the corner of the graph, where their t and Eh values of them were, respectively, in the range of 0.90 to 1.02 and 0 to 32 meV atom−1.
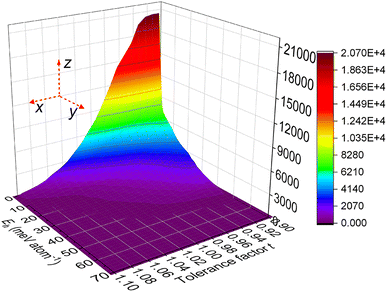 | ||
| Fig. 12 The relationship between the Eh values of the projected stable perovskite oxides and their tolerance factor t in terms of numerical count. | ||
Shown in Fig. 13 is the appearance frequency of the A- and B-site elements in the periodic table of the 682![[thin space (1/6-em)]](https://www.rsc.org/images/entities/char_2009.gif) 143 predicted stable perovskite oxides with Eh values of lower than 50 meV atom−1. The percentage of the element accommodated on the A- and B-site is revealed by the color of the triangle. It can be seen that K, Rb, Cs, Ba, Nd, Sm, Eu, and Tl had higher possibilities than their counterparts to accommodate at the A-site. Regarding the B-site elements, transition metal Cr exhibited the highest frequency. Other transition metals, e.g. V, Mn, Fe, Co, Ni, also had high possibilities to be the B-site elements of stable perovskite oxides. Despite being pivotal elements for the A-site, alkali metals K, Rb, and Cs cannot function as the B-site elements, presumably due to their large ionic radius.
143 predicted stable perovskite oxides with Eh values of lower than 50 meV atom−1. The percentage of the element accommodated on the A- and B-site is revealed by the color of the triangle. It can be seen that K, Rb, Cs, Ba, Nd, Sm, Eu, and Tl had higher possibilities than their counterparts to accommodate at the A-site. Regarding the B-site elements, transition metal Cr exhibited the highest frequency. Other transition metals, e.g. V, Mn, Fe, Co, Ni, also had high possibilities to be the B-site elements of stable perovskite oxides. Despite being pivotal elements for the A-site, alkali metals K, Rb, and Cs cannot function as the B-site elements, presumably due to their large ionic radius.
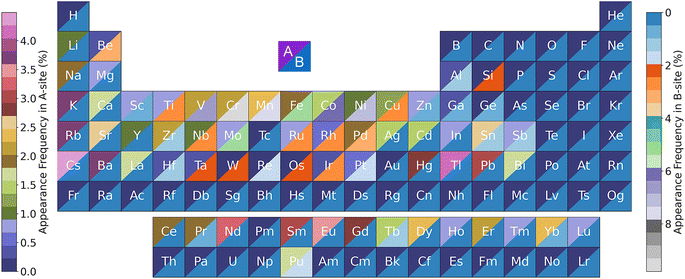 | ||
Fig. 13 The appearance frequency of the A- and B-site elements of the 682![[thin space (1/6-em)]](https://www.rsc.org/images/entities/char_2009.gif) 143 predicted stable perovskites oxides with Eh values of lower than 50 meV atom−1. 143 predicted stable perovskites oxides with Eh values of lower than 50 meV atom−1. | ||
To verify the efficacy of the XGBR-144 model, the Eh values of some predicted stable perovskite oxides that have been experimentally investigated and/or DFT calculated were compared with those in the Materials Project (MP) database, as displayed in Table S3.† For example, Fe-, Co-, and Mn-based double perovskite oxides have been enormously used as the electrode materials of solid oxide fuel cells and protonic ceramic fuel cells,57–59 and electrocatalysts for oxygen evolution.60 Bismuth-based double perovskite oxides were employed as photocatalysis.61,62 It can be found that the predicted stable perovskite oxides in this study had Eh values like those in the MP database. For instance, the Eh values of a double perovskite photocatalyst Ba2BiLaO6 (ref. 61) that was projected by the regression model and calculated by DFT were 28 and 30 meV atom−1, respectively. Double perovskite BaSrCoWO6 had been investigated as a parent structure for solid oxide fuel cell cathode materials,63 its Eh values predicted by the XGBR-144 model and calculated by DFT were 15 and 0 meV atom−1, respectively. Moreover, in our input dataset, there was no double perovskite oxide having the composition of Eu2B′B′′O6. However, the Eh values predicted by the XGBR-144 model exhibited strong alignment with those calculated by DFT. Therefore, the XGBR-144 model developed in this work demonstrated excellent performance in predicting the Eh values of perovskite oxides.
4. Conclusions
In summary, interpretable machine learning is applied to screen perovskite oxides from virtual perovskite-type combinations. The extreme gradient boosting algorithm outperformed its counterparts in predicting the thermodynamic stability and Eh values of perovskite oxides. The XGBC-23 classification model achieved an accuracy of 0.919, precision of 0.937, F1-score of 0.932, and recall of 0.935. SHAP explanation results confirmed that B2_HOMO, B1_ME, and IV_AB_diff were the top three features for perovskite stability prediction, with medium B2_HOMO and greater B1_ME and IV_AB_diff promoting the stability of perovskite oxides. For Eh regression models, employing the stability label as a feature for model training significantly boosted their performance. The XGBR-144 regression model gave an R2 of 0.916, a RMSE of 24.2 meV atom−1, and a MAE of 12.4 meV atom−1. SHAP interpretation results confirmed that the stability label was the most crucial feature for Eh regression, followed by IR_AB_diff, BL_AB_diff, A2_ME, A2_ME, etc. A higher IR_AB_diff and BL_AB_diff, as well as a lower A2_ME and A1_ME, benefited reducing the Eh values of perovskite oxides. 682![[thin space (1/6-em)]](https://www.rsc.org/images/entities/char_2009.gif) 143 virtual combinations were predicted as stable perovskites, and 141
143 virtual combinations were predicted as stable perovskites, and 141![[thin space (1/6-em)]](https://www.rsc.org/images/entities/char_2009.gif) 545 of them were predicted with zero Eh values. The top five A-site elements were Cs, Tl, Ba, K, and Rb, while the top five B-site elements were Cr, Mn, Ni, V, and Co. The strategy proposed in this study has the potential to accelerate the discovery of perovskite oxides and related materials.
545 of them were predicted with zero Eh values. The top five A-site elements were Cs, Tl, Ba, K, and Rb, while the top five B-site elements were Cr, Mn, Ni, V, and Co. The strategy proposed in this study has the potential to accelerate the discovery of perovskite oxides and related materials.
Author contributions
Jie Zhao: data curation, funding acquisition, methodology, visualization, formal analysis, writing – original draft, writing – review & editing; Xiaoyan Wang: conceptualization, investigation, methodology, supervision, visualization, formal analysis, writing – review & editing; Hobo Li: formal analysis, visualization, writing – review & editing; Xiaoyong Xu: supervision, visualization, writing – review & editing.Conflicts of interest
The authors declare no competing interests.Acknowledgements
This work was supported by the Natural Science Foundation of Jiangsu Province (Grant No. BK20200690), the Natural Science Foundation of Jiangsu Higher Education Institutions (Grant No. 20KJB530010), and the Innovation and Entrepreneurship Program of Jiangsu Province.References
- C. Sun, J. A. Alonso and J. Bian, Adv. Energy Mater., 2021, 11, 2000459 CrossRef CAS.
- A. Kumar, A. Kumar and V. Krishnan, ACS Catal., 2020, 10, 10253–10315 CrossRef CAS.
- Y. Zhou, X. Guan, H. Zhou, K. Ramadoss, S. Adam, H. Liu, S. Lee, J. Shi, M. Tsuchiya, D. D. Fong and S. Ramanathan, Nature, 2016, 534, 231–234 CrossRef CAS PubMed.
- J. Zhao, Y. Pu, L. Li, W. Zhou and Y. Guo, Energy Fuels, 2020, 34, 10100–10108 CrossRef CAS.
- P. Kaur and K. Singh, Ceram. Int., 2020, 46, 5521–5535 CrossRef CAS.
- E. Grabowska, Appl. Catal., B, 2016, 186, 97–126 CrossRef CAS.
- T. Vijayaraghavan, R. Althaf, P. Babu, K. M. Parida, S. Vadivel and A. M. Ashok, J. Environ. Chem. Eng., 2021, 9, 104675 CrossRef CAS.
- M. A. Peña and J. L. G. Fierro, Chem. Rev., 2001, 101, 1981–2018 CrossRef PubMed.
- A. Hossain, S. Roy and K. Sakthipandi, Ceram. Int., 2019, 45, 4152–4166 CrossRef CAS.
- C. J. Bartel, C. Sutton, B. R. Goldsmith, R. Ouyang, C. B. Musgrave, L. M. Ghiringhelli and M. Scheffler, Sci. Adv., 2019, 5, eaav0693 CrossRef CAS PubMed.
- K. Momma and F. Izumi, J. Appl. Crystallogr., 2011, 44, 1272–1276 CrossRef CAS.
- J. Zhao and X. Wang, ACS Omega, 2022, 7, 10483–10491 CrossRef CAS PubMed.
- L. M. Feng, L. Q. Jiang, M. Zhu, H. B. Liu, X. Zhou and C. H. Li, J. Phys. Chem. Solids, 2008, 69, 967–974 CrossRef CAS.
- H. Zhang, N. Li, K. Li and D. Xue, Acta Crystallogr., Sect. B: Struct. Sci., 2007, 63, 812–818 CrossRef CAS PubMed.
- Q. Sun and W.-J. Yin, J. Am. Chem. Soc., 2017, 139, 14905–14908 CrossRef CAS PubMed.
- C. B. Barber, D. P. Dobkin and H. Huhdanpaa, ACM Trans. Math. Software, 1996, 22, 469–483 CrossRef.
- A. A. Emery and C. Wolverton, Sci. Data, 2017, 4, 170153 CrossRef CAS PubMed.
- A. A. Emery, J. E. Saal, S. Kirklin, V. I. Hegde and C. Wolverton, Chem. Mater., 2016, 28, 5621–5634 CrossRef CAS.
- R. Jacobs, T. Mayeshiba, J. Booske and D. Morgan, Adv. Energy Mater., 2018, 8, 1702708 CrossRef.
- R. Jaafreh, A. Sharan, M. Sajjad, N. Singh and K. Hamad, Adv. Funct. Mater., 2023, 33, 2210374 CrossRef CAS.
- M. Liu, Z. Rong, R. Malik, P. Canepa, A. Jain, G. Ceder and K. A. Persson, Energy Environ. Sci., 2015, 8, 964–974 RSC.
- W. Li, R. Jacobs and D. Morgan, Comput. Mater. Sci., 2018, 150, 454–463 CrossRef CAS.
- T. Ma, R. Jacobs, J. Booske and D. Morgan, J. Mater. Chem. C, 2021, 9, 12778–12790 RSC.
- E. T. Chenebuah, M. Nganbe and A. B. Tchagang, Mater. Today Commun., 2021, 27, 102462 CrossRef CAS.
- Q. Tao, T. Lu, Y. Sheng, L. Li, W. Lu and M. Li, J. Energy Chem., 2021, 60, 351–359 CrossRef CAS.
- H. Liu, J. Cheng, H. Dong, J. Feng, B. Pang, Z. Tian, S. Ma, F. Xia, C. Zhang and L. Dong, Comput. Mater. Sci., 2020, 177, 109614 CrossRef CAS.
- G. Pilania, P. Balachandran, J. E. Gubernatis and T. Lookman, Acta Crystallogr., Sect. B: Struct. Sci., Cryst. Eng. Mater., 2015, 71, 507–513 CrossRef CAS PubMed.
- P. V. Balachandran, A. A. Emery, J. E. Gubernatis, T. Lookman, C. Wolverton and A. Zunger, Phys. Rev. Mater., 2018, 2, 043802 CrossRef CAS.
- L. Li, Q. Tao, P. Xu, X. Yang, W. Lu and M. Li, Comput. Mater. Sci., 2021, 199, 110712 CrossRef CAS.
- Y. Juan, Y. Dai, Y. Yang and J. Zhang, J. Mater. Sci. Technol., 2021, 79, 178–190 CrossRef.
- Z. Li, L. E. K. Achenie and H. Xin, ACS Catal., 2020, 10, 4377–4384 CrossRef CAS.
- H. Liu, J. Feng and L. Dong, Ceram. Int., 2022, 48, 18074–18082 CrossRef CAS.
- L. Chen, X. Wang, W. Xia and C. Liu, Comput. Mater. Sci., 2022, 211, 111435 CrossRef CAS.
- J. Schmidt, J. Shi, P. Borlido, L. Chen, S. Botti and M. A. L. Marques, Chem. Mater., 2017, 29, 5090–5103 CrossRef CAS.
- A. Jain, S. P. Ong, G. Hautier, W. Chen, W. D. Richards, S. Dacek, S. Cholia, D. Gunter, D. Skinner and G. Ceder, APL Mater., 2013, 1, 011002 CrossRef.
- S. Vasala and M. Karppinen, Prog. Solid State Chem., 2015, 43, 1–36 CrossRef CAS.
- A. Talapatra, B. P. Uberuaga, C. R. Stanek and G. Pilania, Chem. Mater., 2021, 33, 845–858 CrossRef CAS.
- S. M. Lundberg and S.-I. Lee, Adv. Neural Inf. Process. Syst., 2017, 30, 4765–4774 Search PubMed.
- L. G. Tejuca, J. L. G. Fierro and J. M. D. Tascón, in Advances in Catalysis, ed. D. D. Eley, H. Pines and P. B. Weisz, Academic Press, 1989, vol. 36, pp. 237–328 Search PubMed.
- V. M. Goldschmidt, Naturwissenschaften, 1926, 14, 477–485 CrossRef CAS.
- C. Li, X. Lu, W. Ding, L. Feng, Y. Gao and Z. Guo, Acta Crystallogr., Sect. B, 2008, 64, 702–707 CrossRef CAS PubMed.
- L. Ward, A. Agrawal, A. Choudhary and C. Wolverton, NPJ Comput. Mater., 2016, 2, 16028 CrossRef.
- A. Zunger, Phys. Rev. B: Condens. Matter Mater. Phys., 1980, 22, 5839 CrossRef CAS.
- F. Pedregosa, G. Varoquaux, A. Gramfort, V. Michel, B. Thirion, O. Grisel, M. Blondel, P. Prettenhofer, R. Weiss, V. Dubourg, J. Vanderplas, A. Passos, D. Cournapeau, M. Brucher, M. Perrot and É. Duchesnay, J. Mach. Learn. Res., 2011, 12, 2825–2830 Search PubMed.
- V. Gladkikh, D. Y. Kim, A. Hajibabaei, A. Jana, C. W. Myung and K. S. Kim, J. Phys. Chem. C, 2020, 124, 8905–8918 CrossRef CAS.
- X. Yang, L. Li, Q. Tao, W. Lu and M. Li, Comput. Mater. Sci., 2021, 196, 110528 CrossRef CAS.
- S. Afroze, A. Karim, Q. Cheok, S. Eriksson and A. K. Azad, Front. Energy, 2019, 13, 770–797 CrossRef.
- T. Tsuneda, J.-W. Song, S. Suzuki and K. Hirao, J. Chem. Phys., 2010, 133 Search PubMed.
- J.-L. Bredas, Mater. Horiz., 2014, 1, 17–19 RSC.
- Z. S. Safi, N. Wazzan and H. Aqel, Chem. Phys. Lett., 2022, 791, 139349 CrossRef CAS.
- M. Miar, A. Shiroudi, K. Pourshamsian, A. R. Oliaey and F. Hatamjafari, J. Chem. Res., 2021, 45, 147–158 CrossRef CAS.
- E. Isotta, W. Peng, A. Balodhi and A. Zevalkink, Angew. Chem., Int. Ed. Engl., 2023, 62, e202213649 CrossRef CAS PubMed.
- H. Zhang, N. Li, K. Li and D. Xue, Acta Crystallogr., Sect. B, 2007, 63, 812–818 CrossRef CAS PubMed.
- K. Singh, S. Acharya and D. V. Atkare, Ferroelectrics, 2005, 315, 91–110 CrossRef CAS.
- P. M. Woodward, Acta Crystallogr., Sect. B, 1997, 53, 44–66 CrossRef.
- W. Ye, C. Chen, Z. Wang, I.-H. Chu and S. P. Ong, Nat. Commun., 2018, 9, 3800 CrossRef PubMed.
- Y.-H. Huang, R. I. Dass, Z.-L. Xing and J. B. Goodenough, Science, 2006, 312, 254–257 CrossRef CAS PubMed.
- S. Choi, C. J. Kucharczyk, Y. Liang, X. Zhang, I. Takeuchi, H.-I. Ji and S. M. Haile, Nat. Energy, 2018, 3, 202–210 CrossRef CAS.
- X. Xu, J. Zhao, M. Li, L. Zhuang, J. Zhang, S. Aruliah, F. Liang, H. Wang and Z. Zhu, Compos. B Eng., 2019, 178, 107491 CrossRef CAS.
- D. Liu, P. Zhou, H. Bai, H. Ai, X. Du, M. Chen, D. Liu, W. F. Ip, K. H. Lo, C. T. Kwok, S. Chen, S. Wang, G. Xing, X. Wang and H. Pan, Small, 2021, 17, 2101605 CrossRef CAS PubMed.
- M. Irshad, Q. tul Ain, M. Zaman, M. Z. Aslam, N. Kousar, M. Asim, M. Rafique, K. Siraj, A. N. Tabish and M. Usman, RSC Adv., 2022, 12, 7009–7039 RSC.
- M. Z. Kazim, M. Yaseen, S. A. Aldaghfag, M. Ishfaq, M. Nazar, Misbah, M. Zahid and R. Neffati, J. Solid State Chem., 2022, 315, 123419 CrossRef CAS.
- J. F. Shin, W. Xu, M. Zanella, K. Dawson, S. N. Savvin, J. B. Claridge and M. J. Rosseinsky, Nat. Energy, 2017, 2, 16214 CrossRef CAS.
Footnote |
| † Electronic supplementary information (ESI) available. See DOI: https://doi.org/10.1039/d3ra08591k |
| This journal is © The Royal Society of Chemistry 2024 |

