 Open Access Article
In situ polymerization of a melamine-based microsphere into 3D nickel foam for supercapacitors†
Mervat Ibrahim ab,
Zhen Wena,
Xuhui Sun
 *a and
Hani Nasser Abdelhamid
 *cd
*cd
aInstitute of Functional Nano and Soft Materials (FUNSOM), Jiangsu Key Laboratory for Carbon-Based Functional Materials and Devices, Joint International Research Laboratory of Carbon-Based Functional Materials and Devices, Soochow University, Suzhou 215123, China. E-mail: xhsun@suda.edu.cn
bDepartment of Chemistry, Faculty of Science, New Valley University, El-Kharja, 72511, Egypt
cDepartment of Chemistry, Assiut University, Assiut, 71516, Egypt. E-mail: hany.abdelhamid@aun.edu.eg
dEgyptian Russian University, Badr City, 11829, Egypt
First published on 13th February 2024
Abstract
An in situ synthesis approach is used to directly grow a microsphere of melamine-glutaraldehyde (MAGA) polymer over three-dimensional (3D) nickel foam (NF). The materials are used to produce nitrogen-doped carbon (NC) with and without NF. These precursors undergo carbonization at various temperatures, namely 400 °C, 500 °C, and 700 °C. The electrochemical properties of the materials would be significantly improved by directly growing MAGA polymer on the surface of NF. The electrochemical performance of NC/NF-400 was excellent, with a capacitance of 297 F g−1 achieved at a current density of 1 A g−1. The in situ growing approach does not necessitate the use of additional chemical agents, such as binders or conductive compounds when preparing the electrode. In addition, the material exhibits only 10% reduction in capacitance after undergoing 5000 cycles, indicating excellent cycling performance. The outstanding electrochemical performance achieved by using the in situ method of MAGA microsphere polymer on NF may be attributed to the rapid transit of ions to the electrode surfaces, facilitating effortless redox reactions.
Introduction
Energy storage systems e.g., supercapacitors (SCs), batteries, and fuel cells have become indispensable technologies to solve the world's energy crisis nowadays.1–8 Among these systems, SCs are an energy storage technology.9,10 They are attractive for applications such as electric vehicles and portable electronic devices. They fulfill the high-power space between conventional capacitors (high power output) and batteries (high energy storage).11–13 To achieve the seven goals listed in the Sustainable Development Goals proposed by the United Nations for a better and cleaner future for all generations, SCs may play a strong role in the widespread adoption of energy storage and the sustainability approach.14,15A crucial aspect of SC technology is the evolution of related electrode materials.16 Carbon-based materials were intensively utilized as SC electrodes.17,18 They were easily processed into the electrode, had excellent electrochemical stability and could be made into powders, aerogels, composites, sheets, and tubes.19–21 Consequently, there has been much interest in creating carbon-based materials with high specific capacitance.7 Incorporating a heteroatom e.g., boron, nitrogen, phosphorous, and sulfur can improve the performance of carbon nanomaterials. Compared to electrodes made of pure carbon, nitrogen-doped carbon (i.e., NC) exhibits high conductivity and good wettability offering high capacitive performance.6,22 Most of the reported methods of N-doped carbon require several steps limiting which restricts their use as SC electrode materials.
Over the last 20 years, a variety of porous organic polymers (POPs) have been reported for several applications.23–25 There are various forms of POPs including conjugated microporous polymers (CMPs), porous aromatic frameworks (PAFs), hyper-crosslinked polymers (HCPs), and covalent organic frameworks (COFs).26–35 Due to covalent connections, lower density, and extensive structural tunability, they have benefits including a large specific surface area, flexible pore size, and tunable functionalities.36 POPs as promising materials for energy storage and conversion.36–38 They are often deposited on current collectors after being combined with auxiliary materials like carbon black or binders (e.g., poly(vinylidene difluoride), PVDF) that reduce considerably the specific capacitance of the electrodes.39,40
In this study, we synthesized microsphere particles of melamine glutaraldehyde (MAGA) into three-dimensional (3D) nickel foam (NF) via two different processes; in situ and ex situ methods. MAGA was used as a precursor to prepare nitrogen-doped carbon (NC) materials via carbonization at different temperatures (400 °C, 500 °C, and 700 °C). Fourier transform infrared (FT-IR), X-ray diffraction (XRD), and scanning electron microscope (SEM) confirm the synthesis of the materials. Cyclic voltammetry (CV) and galvanostatic charge–discharge curves (GCDC) indicate the high electrochemical performance of the materials for SCs. Electrochemical impedance spectroscopy (EIS) was used to measure the electrochemical conductivity. Based on our knowledge, this is the first report for the one-pot synthesis of melamine-based microspheres into NF electrode. The electrodes were used directly without the need for extra chemicals such as a binder or conductive materials that were usually used during electrode preparation.
Experimental section
Materials and reagents
Glutaraldehyde solution (2.5 wt%), melamine, and N-methyl-2-pyrrolidone (NMP) were purchased from Sigma-Aldrich (Germany).Preparation and carbonization of MAGA polymers
MAGA polymer was synthesized via the solvothermal method. Typically, 5 g of melamine was dispersed in glutaraldehyde solution (15 mL, 2.5 wt%) in the presence of Ni foam (NF) pieces (0.5 cm × 1 cm × 1.6 mm) via ultrasonication at 60 °C for 30 min. The reaction vials were left in an oven at 85 °C for three days.The powder of MAGA was synthesized following the same procedure without NF. The resultant MAGA was filtered and washed with double distilled water to remove unreacted chemicals. The materials served as precursors in the preparation of nitrogen-doped carbon (NC) via MAGA and MAGA/NF carbonization at 400 °C, 500 °C, and 700 °C using a Muffle furnace (Nabertherm, Germany).
Instruments and electrochemical measurements
D8 Advance (Bruker, Germany, Cu Kα radiation) was used to record XRD patterns. Nicolet spectrophotometer model 6700 was used for FT-IR analysis. SEM images were recorded using QUANTA FEG250 (Holland).In the prepared electrode materials, both in situ and ex situ samples were employed. Electrodes for in situ samples (MAGA@NF) before and after carbonization at 400 °C, 500 °C, and 700 °C were directly used, denoted as NC/NF (400 °C), NC/NiO/NF (500 °C), and NC/NiO/NF (700 °C), respectively. For ex situ materials, the electrodes were prepared using weight percentages of 70% (ex situ samples), 20% (carbon black), and 10 wt% (PVDF), using NMP. The mixture was then cast into NF (1 × 1 cm2) at 90 °C for 24 hours.
Using a Corrtest® (CS350, Wuhan, China) electrochemical workstation, all the electrochemical measurements were made including (CV, GCDC, and EIS). Utilizing a three-electrode system, the electrochemical performance tests were assessed using (6 M) KOH electrolyte solution, Pt mesh, and Hg/HgO as a counter electrode, and the reference electrode, respectively. All measurements were examined at room temperature from 0 to 0.55 V as a potential window using cyclic voltammetry (CV; scan rates from 5 to 200 mV s−1) and GCDC (current density of 1, 2, 3, 4, 5, 6, and 10 A g−1). EIS measurements were made in the range of frequencies from 100 MHz to 0.1 Hz. The GCD curve was used to estimate the specific capacitance from the following equation:
 | (1) |
 is the integral area of the corresponding GCDC curve's potential vs. discharge time.
The two-electrode system was used using MAGA_400 via a symmetric device. Typically, an equal mass of the slurry containing the active materials, carbon black, and PVDF was deposited into NF (1 × 2 cm2). The two electrodes were assembled using filter paper as a separator. The device was soaked in KOH (6M) overnight and during the measurements. Electromeasurements of CV and GCDC were recorded. GCDC at current density 1 A g−1 was used to calculate specific energy and specific power.
Results and discussion
Electrodes characterization
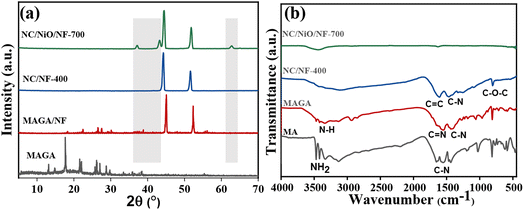
A schematic representation of in situ and ex situ materials synthesis is shown in Fig. 1. Melamine (MA) and glutaraldehyde (GA) form polymer material, denoted as MAGA.41–43 The polymer was synthesized with and without a substrate such as NF which is widely employed as a substrate for active materials in supercapacitors and batteries. NF had several benefits such as high porosity, outstanding electric conductivity, and great chemical stability in a range of liquid electrolytes.44,45 The ex situ method includes the materials synthesis without NF. The electrode and powder materials were also carbonized at different temperatures (400 °C, 500 °C, and 700 °C for 1 h to produce NC without (Fig. 1a) and with NF (Fig. 1b). The carbonized electrodes were denoted as NC/NF-400, NC/NiO/NF-500, and NC/NiO/NF-700 referring to the carbonized temperature of 400 °C, 500 °C, and 700 °C, respectively (Fig. 1b). XRD (Fig. 2a), FT-IR (Fig. 2b), and SEM images (Fig. 3) were used to characterize the materials.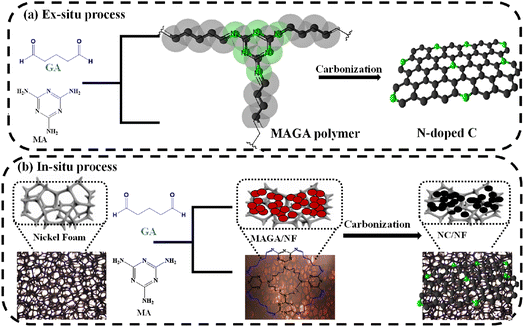 | ||
| Fig. 1 The formation of MAGA and their carbonization into NC using (a) ex situ and (b) in situ processes. | ||
The crystallinity and phase structure of the materials were analyzed by using XRD. The XRD patterns of MAGA_ex situ, MAGA/NF, (NC/NF-400 and NC/NiO/NF-700)_in situ in the 2θ range of 5–60° are shown in Fig. 2a. The pure NF (JCPDS 4-850) shows two typical diffraction peaks located at Bragg angle (2θ) of 44.4° and 51.7° corresponding to Miller indexes of (111) and (200) planes, respectively. After the growth of MAGA polymer on NF, diffraction peaks can be observed as appearing which indicates the MAGA polymer was successfully prepared by in situ growth on NF. Using carbonization at 400 °C, the MAGA/NF transforms to NC/NF formation. After carbonization at 700 °C, the nickel oxidized to NiO. The diffraction peaks at 37.2°, 43.2°, and 62.8° can be indexed to the Miller indexes of (111), (200), and (220) planes for NiO (JCPDS Card 47-1049).46,47 XRD indicates that NF undergoes oxidation at high temperatures. Thus, the electrode at high temperature was labeled as NC/NiO/NF-700.
The FT-IR spectra of MA, MAGA, NC/NF_in situ at two different temperatures are shown in Fig. 2b. The MA spectrum had bands at a wavenumber between 3100–3450 cm−1, which are linked with –NH2 stretching vibration (Fig. 2b). On the other side, MAGA displays a characteristic peak at 3300 cm−1 due to the N–H symmetric stretching vibration with the disappearing of the amino (–NH2) stretching mode. The presence of an imine bond (–C![[double bond, length as m-dash]](https://www.rsc.org/images/entities/char_e001.gif) N) and C–N bonds are shown by the FT-IR band at 1561 cm−1 and 1165 cm−1, respectively. These observations confirm the covalent bond formation between MA and GA. FT-IR spectra confirm the polycondensation between GA and MA offering MAGA polymer.42
N) and C–N bonds are shown by the FT-IR band at 1561 cm−1 and 1165 cm−1, respectively. These observations confirm the covalent bond formation between MA and GA. FT-IR spectra confirm the polycondensation between GA and MA offering MAGA polymer.42
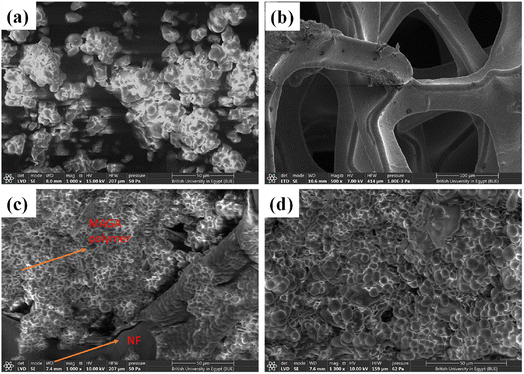
The morphologies and particle size of MAGA, NF, and MAGA/NF were also characterized using SEM (Fig. 3). SEM image of MAGA shows microspherical particles of the polymer with a particle size of 4.5–15 μm (Fig. 3a). From the SEM image, the foam structure of NF can be verified (Fig. 3b). The pure nickel substrate is an open-cell foam with a network of interconnected and branched Ni0 wires. The surface morphology of NF after in situ growth of MAGA under two magnifications was also recorded in Fig. 3c and d. SEM images confirm the successful in situ growth of spherical particles MAGA into Ni foam (Fig. 3c). The spherical particles formed in the NF display particle sizes of 0.5–5 micrometers (μm) (Fig. 3d). The presence of NF during MAGA growth decreases the particle size of the polymers (Fig. 3d). NF decreases also the aggregation of the formed MAGA polymer enabling homogenous distribution into the 3D skeleton of NF. It decreases also the tendency of the polymer to form clusters (Fig. 3c and d).
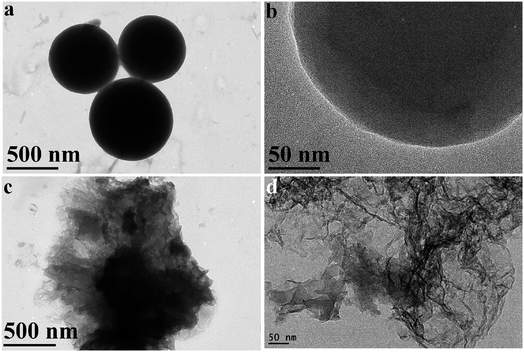
The morphology of MAGA (Fig. 4a and b) and MAGA carbonized at 400 °C (Fig. 4c and d) was further confirmed using TEM images. The organic polymer substance consists of an intricate arrangement of interconnected particles, exhibiting a diverse range of sizes and forms. The particles have a size range of 0.5–2 micrometers and can exhibit a spherical morphology (Fig. 4a). The carbonized MAGA at 400 °C displays the morphology of graphitic carbon material with wavy morphology (Fig. 4b). The material shows thin nanosheets of N-doped carbon (Fig. 4b).
Electrochemical behaviors of the samples
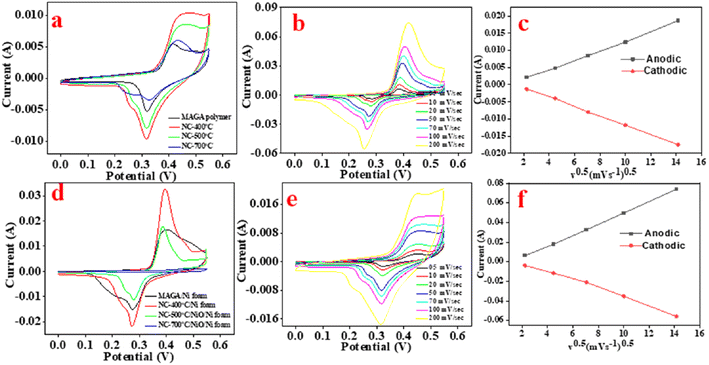
CV curves of MAGA before and after carbonization using in situ and ex situ procedures were compared (Fig. 5 and S1–S2†). The data were collected using a three-electrode system utilizing 6M KOH and varied scan rates between 5 and 200 mV−1 in the potential range of 0 to 0.55 V (Fig. 4 and S1–S2†).Fig. 5a, b and S1† show the CV curves of MAGA, NC-400, NC-500, and NC-700 ex situ electrodes at 50 mV s−1 as a scan rate. The current of the NC-400 electrode is more significant than that of the MAGA, the NC-500, and the NC-700. As can be shown in Fig. 5b, the oxidation and reduction currents of NC-400 rise linearly as the scan rate rises. This observation indicates that the electrode material has a strong rate capability since the peak current density increases as the scan rate rises. Additionally, as the scan rate increased, positive and negative shifts for oxidation and reduction peaks associated with the electrode resistance were seen. As a result, we can say that the NC-400 ex situ electrode capacitance was primarily caused by the faradic-redox processes. It is important to mention that all these tested materials were prepared following the conventional method for electrode preparation i.e., mixing the materials with PVDF and carbon black before casting into NF.
CV curves of MAGA/NF and NC/NF_in situ materials were investigated (Fig. 5d–f). MAGA/NF and NC/NF-400, NC/NiO/NF-500, and NC/NiO/NF-700 were employed as electrode materials without the need for mixing or any preparation steps. There is no addition of PVDF or carbon black. In the potential range (0–0.55 V), CV curves of all electrodes were obtained at scan rates ranging from 5 to 200 mV s−1 (Fig. 5d–f and S2†). The CV curve for the NC/NF-400 electrode exhibits a higher current than that of MAGA/NF, NC/NiO/NF-500, and NC/NiO/NF-700. The scan rates gradually enhance the anodic current and cathodic current of NC/NF-400 (Fig. 5f). Interestingly, even at high scan rates of 200 mV s−1, the electrode still performs the redox peak shapes. In situ prepared electrodes exhibit higher current than the electrodes that were prepared via ex situ procedure. The CV curves suggest that the redox process is more reversible. The redox reaction of the prepared polymer can be explained as shown in Fig. S3.†
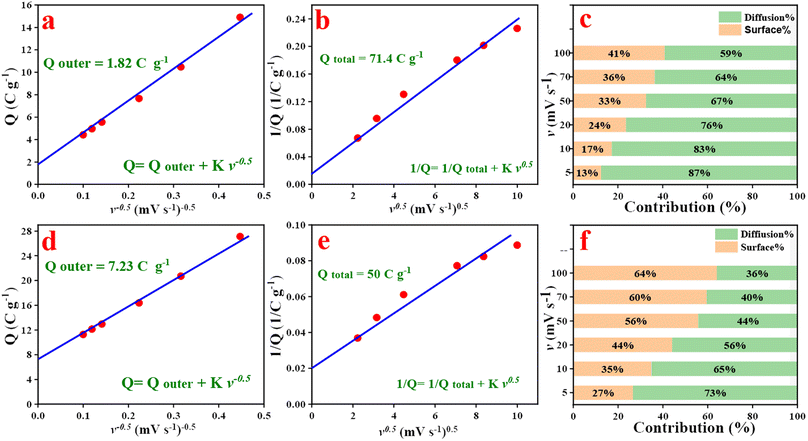
Fig. 5c–f illustrates the linear relationship between the current and the square root of the scan rate (I and v0.5). Data analysis reveals that the electrodes can be charged via a diffusion-controlled mechanism according to Cottrell's equation (I & v0.5).48,49 This observation indicates that the electrode exhibits battery-type properties due to the redox properties of the polymer as shown in Fig. S3.†50 Thus, further analysis of CV curves was performed (Fig. 6). CV is an important technique for investigating the electrochemical performance of a material to voltage sweep, operating voltage window, reversibility, and charge kinetics mechanism i.e., diffusion vs. surface control. Trasatti Plot was used to show (1) the ratio of surface-controlled capacitive “outer” to the total stored charge (Qtotal) and (2) diffusion-controlled faradaic “inner” to Qtotal.49,51 According to the Trasatti method states that as the voltage scan rate approaches infinity, surface operations are allowed; in this situation, the charge that is being stored is an external charge (Qouter) i.e. surface-controlled capacitance. The plot in Fig. 6a–d can be used to determine the value of Qouter which can be obtained by assessing the intercept of the plots using the following equations:45,52
| Q = Qouter + Kv−0.5 |
| 1/Q = 1/Qtotal + Kv0.5 |
Based on plots of Fig. 6a–c, the Qouter values for NC-400 and NC/NF-400 were determined to be 1.82 C g−1 and 7.23 C g−1, respectively. According to calculations between the square root of the scan rate (v0.5) on the x-axis and the reciprocal of the capacity (1/Q) on the y-axis, as well as the intercept of the 1/Q vs. v0.5 plot, it is possible to determine the total charge stored in ex situ and in situ electrodes (Qtotal) at a low enough scan rate. Qtotal values are 71.4 C g−1 and 50 C g−1 for NC-400 and NC/NF-400, respectively (Fig. 6d–e). Based on Cottrell's equation, the diffusion-controlled values were 87.5% and 73.7% for NC-400 and NC/NF-400, respectively (Fig. 6c–f). The NC/NF-400 exhibits high currents offering higher electron transport while allowing the ion enough time to diffuse through the electrode at a low scanning rate. In contrast, the PVDF binder used for the ex situ electrode decreases the electrode's conductivity. Data analysis indicates that the capacitance for all materials is controlled by diffusion. In situ synthesis (Fig. 6c) electrodes exhibit higher diffusion rates compared to electrodes prepared via ex situ procedures (Fig. 6f). The high capacitance of the electrode prepared via in situ procedure can be explained using optical microscope images (Fig. S4–S6†). Data analysis indicates that the electrode prepared via in situ procedure is homogenously distributed compared to the electrode materials prepared via ex situ procedures (Fig. S4–S6†).
The GCDC of MAGA and carbonized materials prepared via in situ and ex situ process electrodes were recorded at 1 A g−1 in a potential range of 0–0.55 V (Fig. 7a–c). The GCD curves demonstrate a consistent voltage plateau coupled to a sizable Faradaic type of processes at constant voltage, highlighting a typical battery feature seen in CV curves. We conclude from the results that the best performance for the supercapacitor is the carbonized electrode at 400 °C prepared by both processes. For the carbonized material at 700 °C designed by in situ process, it can be seen that the performance is minimal compared with other electrodes due to the yield of NC/NF-700 being too low. All electrode GCD measurements were done at various current densities (Fig. 7b–d). The CV and GCD graphs exhibit a consistent voltage plateau associated with high Faradic-redox couple reactions, pointing to a similar battery feature.
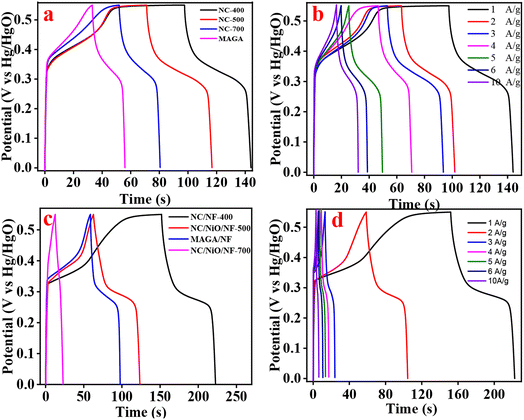 | ||
| Fig. 7 GCD curves for electrodes prepared via (a) ex situ and (c) in situ procedure at 1 A g−1 and GCD curves at different current densities from 1–10 A g−1 (b) NC-400 and (d) NC/NF-400. | ||
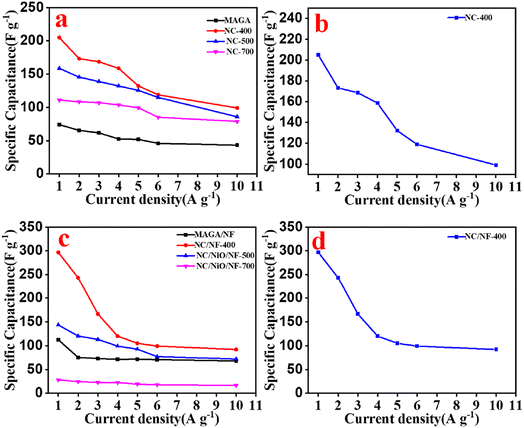
Using the GCD curve, eqn (1) was used to compute the specific capacitances (F g−1). Based on the calculated values of the ex situ electrodes, the specific capacitance for the NC-400 electrode (206 F g−1) at 1 A g−1 is higher than other ex situ electrodes (Fig. 8a). The order of the specific capacitance can be arranged as follows: NC-400 (206 F g−1) > NC-500 (158 F g−1) > NC-700 (111 F g−1) > MAGA (74 F g−1) (Fig. 8a). The specific capacitances of NC-400 are 207, 176, 168, 159, 132, 119, and 99 F g−1 for current density 1, 2, 3, 4, 5, 6, and 10 A g−1 (Fig. 8b). On the other hand, NC/NF-400 has a specific capacitance of 296.8 F g−1 which is greater than that of MAGA/NF (112.3 F g−1), NC/NiO/NF-500 (143.3 F g−1), and NC/NiO/NF-700 (28 F g−1, Fig. 8c). In contrast, the specific capacitance of NC/NF-400 at different current density is 296.8 F g−1(1 A g−1), 243.3 F g−1(2 A g−1), 166.6 F g−1 (3 A g−1), 111 F g−1(4 A g−1), 109 F g−1(5 A g−1), 99 F g−1(6 A g−1) and 92 F g−1(10 A g−1, Fig. 8d). The fast rate of electron transfer across redox processes may be the cause of the decrease of specific capacitance values for large current densities.
Fig. 9a and b depicts the Nyquist plots in the frequency range of 0.01 to 100 kHz. All materials, including MAGA and their carbonized NC produced by the two processes, exhibit vertical lines and tiny semicircles with outstanding conductivity for rapid charge and mass transfer in the low-frequency region. There is no internal resistance (Fig. 9a and b). Based on EIS data using Nyquist plots, all electrodes exhibit high conductivity explaining the high specific capacitance.
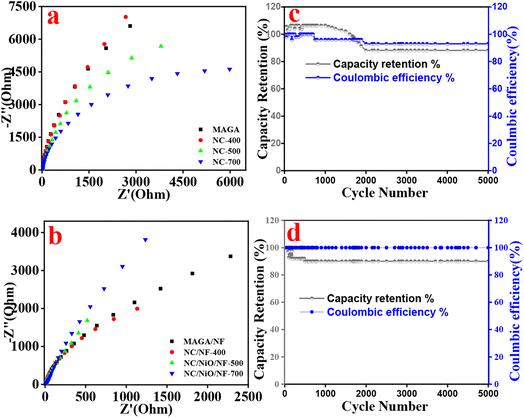 | ||
| Fig. 9 (a and b) Nyquist plots and (c and d) cycling stability for (a), (c) NC-400 and (b and d) NC/NF-400 at 10 A g−1. | ||
The cycling stability was examined at 10 A g−1 up to 5000 charge–discharge cycles (Fig. 9c and d). Both materials, NC-400 and NC/NF-400 exhibit high cycling retaining efficiency of 88% and 90% over 5000 cycles, respectively. SCs using our electrodes exhibit battery-type properties offering high reversible reactions since the coulombic efficiency remained close to 100%.
A comparative statement of presently fabricated supercapacitor electrode MAGA/NF with previously reported electrodes based on melamine is shown in Table 1. Our electrode materials exhibit high specific capacitance compared to the majority of the described organic polymers (Table 1). Xue et al. reported the condensation of squaric acid and melamine forming a polymer (denoted as ST-1) with a specific capacitance of 177.6 F g−1 at the current density of 0.3 A g−1 in a 6 M KOH.53 They also reported –NH– linked COF via the condensation of melamine and 2,4,6-trichloro-1,3,5-triazine.54 The capacitance of the polymer was 155.38 F g−1 at the current density of 0.25 A g−1 in 6 M KOH solution.54 Chandra et al. reported the preparation and supercapacitor application of a redox-active COFs TpBD-(OH)2 which showed capacitance of 86 F g−1 at the current density of 0.5 A g−1 in 1 M phosphate buffer solution.55 Deblase et al. described a β-ketoenamine-linked 2D COF capable of reversible faradaic processes with a specific capacitance of 24 F g−1 at the current density of 0.3 A g−1 in 1 M sulphuric acid solution.56 Zha et al. prepared the COFDAAQ-BTA-3DG composite by incorporating 2,6-diamino-anthraquinone moieties into COF through Schiff-base reaction with benzene-1,3,5-tricarbaldehyde with capacitance 32.6 F g−1 in 1 M sulphuric acid solution.57 Tan et al. described a knitting technique for the creation of a COF through an outside crosslinker (1,4-dimethoxybenzene, DMB).58 The synthesis procedure offered hypercrosslinked conjugated microporous polymers (HCCMPs) for knitting with a specific capacitance of 37 F g−1. We can conclude that MAGA/NF demonstrated the highest specific capacitance except for ST-1 and NWNU-COF-1. However the comparison of the carbonized MAGA/NF at different temperatures with the reference previously values based on carbon materials and even nitrogen-doped carbons.59–62 NC/NF at 400 °C offered the highest performance compared with other electrodes (Table 1). In situ preparation of microsphere MAGA/NF polymer and NC/NF are superior in terms of specific capacitance. Furthermore, the synthesis strategy is cost-effective, facile, and can be produced on a large scale for future investigation.
| Electrode material | Preparation method | Electrolyte | Working potential (V) | Specific capacitance (F g−1) | Ref. |
|---|---|---|---|---|---|
| a ST-1: using melamine (MA) and squaric acid (SA), NWNU-COF-1: using melamine and 2,4,6-trichloro-1,3,5-triazine, TpBD-(OH)2: using 1.3.5-triformylphloroglucinol and 3,3′-dihydroxyzenzidine, DAB-TFP-COF: using p-diaminobenzene and 1,3,5-triformylphloroglucinol, TAAQ-TFP-COF: using 2,6-diaminoanthraquinone and 1,3,5-triformylphloroglucinol, COFDAAQ-BTA: using 2,6-diamino-anthraquinone and benzene-1,3,5-tricarbaldehyde, HCCMP-1: hypercrosslinked conjugated microporous polymers, CAP-1: conjugated aromatic polymers, GH-CMPs: graphene hydrogel-conjugated microporous polymers, GHCPs: graphene hyper-crosslinked porous polymers (HCPs), PCNTs: porous carbon nanotubes (PCNTs), and PAFs: porous aromatic framework. | |||||
| ST-1 | Condensation of squaric acid and melamine | 6 M KOH | 0–0.5 | 177.3 | 53 |
| NWNU-COF-1 | Condensation reaction | 6 M KOH | 0–0.4 | 155.38 | 54 |
| TpBD-(OH)2 | Schiff- base condensation | 1 M phosphate buffer | −0.2–0.5 | 86 | 55 |
| DAB-TFP-COF | β-Ketoenamine-linked 2D COF | 1 M H2SO4 | −0.3–0.3 | 24 | 56 |
| TAAQ-TFP-COF | β-Ketoenamine-linked 2D COF | 1 M H2SO4 | −0.3–0.3 | 23 | 56 |
| COFDAAQ-BTA-3DG | On-surface synthesis | 1 M H2SO4 | −1.1– 0.4 | 32.6 | 57 |
| HCCMP-1 | Knitting rigid aromatic building blocks | 1 M KOH | −1– 0.3 | 37 | 58 |
| CAP-1 | Solid-state polymerization | 2 M KCl | 0–1 | 88 | 59 |
| GHCPs | Friedel–Crafts reaction | 6 M KOH | −1–0 | 144 | 60 |
| PCNTs | Polymerization and then carbonization | 6 M KOH | 0–1 | 172 | 61 |
| PAF-6 | Solvothermal method and then carbonization | 6 M KOH | 0–0.45 | 170.66 | 62 |
| PAF-6-C | −1–0 | 188.88 | |||
| MAGA/NF | In situ processes | 6 M KOH | 0–0.55 | 112.3 | This work |
| NC/NF-400 | 297 | ||||
| NC/NiO/NF-500 | 143 | ||||
| NC/NiO/NF-700 | 28 | ||||
The symmetric device of MAGA_400 materials was evaluated using CV (Fig. 10a) and GCDC (Fig. 10b). CV curves display good electrochemical performance of the device (Fig. 10a). The GCDC curve of the two electrodes demonstrates a distinct capacitive behavior, with well-defined plateaus observed throughout both the charging and discharging stages. The presence of pseudocapacitance, characterized by the reversible adsorption/desorption of ions on the electrode surface, is the main determinant of charge storage in the electrodes. The charging process corresponds to the electrochemical adsorption of positively charged ions, e.g., K+, onto the electrode's surface, and anions (such as OH−). During the discharge process, the electrode surface experiences reversal phenomena in which the cations and anions separate and release the stored energy. The device displays significant charge and discharge capacitance. This observation indicates that our material can be used for device assembly. Further investigation will be carried out to improve the device's performance in the future.
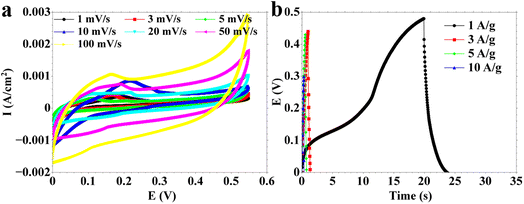 | ||
| Fig. 10 Electrochemical measurements of two electrode systems using a symmetric device via (a) CV curves and (b) GCDC. | ||
Conclusions
We reported two synthesis methods to produce an organic polymer i.e., MAGA with the morphology of microsphere. The materials produced by the two methods acted as precursors for the synthesis of nitrogen-doped carbon (NC) at different carbonization temperatures. The NC/NF-400 electrodes, formed through in situ growth, exhibited enhanced electrochemical performance compared to other electrodes, owing to the preparation methodologies. The in situ methods are straightforward and display the potential to be used for large-scale production. The results suggest that NC/NF-400 exhibits significant promise as an electrode material for supercapacitors. The NC/NF-400 material exhibited a specific capacity of 297 F g−1 at an applied current density of 1 A g−1, and demonstrated superior performance in terms of rate capability and cycling stability. The results of our work illustrate a simple synthesis procedure for the creation and manufacturing of N-doped carbon material in supercapacitors.Conflicts of interest
There are no conflicts to declare.Acknowledgements
Dr Abdelhamid acknowledges financial support from the Science and Technology Development Fund (project numbers 35969 and 42886). Partially, this research was funded by the National Science and Technology Major Project from the Ministry of Science and Technology of China (Grant No. 2018AAA0103104), the National Nature Science Foundation of China (Grant No. 12275190), the Collaborative Innovation Center of Suzhou Nano Science & Technology, the Priority Academic Program Development of Jiangsu Higher Education Institutions (PAPD), the 111 Project, Joint International Research Laboratory of Carbon-Based Functional Materials and Devices.References
- M. Winter, B. Barnett and K. Xu, Before Li Ion Batteries, Chem. Rev., 2018, 118, 11433–11456 CrossRef CAS PubMed.
- A. Borenstein, et al., Carbon-based composite materials for supercapacitor electrodes: a review, J. Mater. Chem. A, 2017, 5, 12653–12672 RSC.
- Z. Yu, L. Tetard, L. Zhai and J. Thomas, Supercapacitor electrode materials: nanostructures from 0 to 3 dimensions, Energy Environ. Sci., 2015, 8, 702–730 RSC.
- J. Libich, J. Máca, J. Vondrák, O. Čech and M. Sedlaříková, Supercapacitors: properties and applications, J. Energy Storage, 2018, 17, 224–227 CrossRef.
- A. Muzaffar, M. B. Ahamed, K. Deshmukh and J. Thirumalai, A review on recent advances in hybrid supercapacitors: design, fabrication and applications, Renewable Sustainable Energy Rev., 2019, 101, 123–145 CrossRef CAS.
- S. A. Al Kiey and H. N. Abdelhamid, Metal-organic frameworks (MOFs)-derived Co3O4@N-doped carbon as an electrode materials for supercapacitor, J. Energy Storage, 2022, 55, 105449 CrossRef.
- H. N. Abdelhamid, S. A. Al Kiey and W. Sharmoukh, A high-performance hybrid supercapacitor electrode based on ZnO/nitrogen-doped carbon nanohybrid, Appl. Organomet. Chem., 2021, 36(1), e6486 CrossRef.
- H. N. Abdelhamid Three-dimensional (3D) Printed Supercapacitor, in Handbook of Energy Materials 1–21, Springer Nature Singapore, 2023, DOI:10.1007/978-981-16-4480-1_77-1.
- M. Zhao, et al., Recent progress in layered double hydroxide based materials for electrochemical capacitors: design, synthesis and performance, Nanoscale, 2017, 9, 15206–15225 RSC.
- M. Winter and R. J. Brodd, What Are Batteries, Fuel Cells, and Supercapacitors?, Chem. Rev., 2004, 104, 4245–4270 CrossRef CAS PubMed.
- Y. Shao, et al., Design and Mechanisms of Asymmetric Supercapacitors, Chem. Rev., 2018, 118, 9233–9280 CrossRef CAS PubMed.
- M. Ibrahim, et al., Covalent organic frameworks (COFs)-derived nitrogen-doped carbon/reduced graphene oxide nanocomposite as electrodes materials for supercapacitors, J. Energy Storage, 2022, 55, 105375 CrossRef.
- M. Ibrahim, et al., Covalent Organic Frameworks-Derived Nitrogen-Doped Carbon/Reduced Graphene Oxide as Electrodes for Supercapacitor, SSRN Electron. J., 2022 DOI:10.2139/ssrn.4063571.
- L. Zhang and X. S. Zhao, Carbon-based materials as supercapacitor electrodes, Chem. Soc. Rev., 2009, 38, 2520–2531 RSC.
- L. Xu, et al., Covalent organic frameworks on reduced graphene oxide with enhanced electrochemical performance, Microporous Mesoporous Mater., 2019, 287, 65–70 CrossRef CAS.
- G. Kim, J. Yang, N. Nakashima and T. Shiraki, Highly Microporous Nitrogen-doped Carbon Synthesized from Azine-linked Covalent Organic Framework and its Supercapacitor Function, Chem.–Eur. J., 2017, 23, 17504–17510 CrossRef CAS PubMed.
- Y. Wang, et al., Amorphous cobalt hydrogen phosphate nanosheets with remarkable electrochemical performances as advanced electrode for supercapacitors, J. Power Sources, 2020, 449, 227487 CrossRef CAS.
- J. Xiao, R. Momen and C. Liu, Application of carbon quantum dots in supercapacitors: a mini review, Electrochem. Commun., 2021, 132, 107143 CrossRef CAS.
- S. L. Candelaria, et al., Nanostructured carbon for energy storage and conversion, Nano Energy, 2012, 1, 195–220 CrossRef CAS.
- J. Lee, J. Kim and T. Hyeon, Recent Progress in the Synthesis of Porous Carbon Materials, Adv. Mater., 2006, 18, 2073–2094 CrossRef CAS.
- C. Liang, Z. Li and S. Dai, Mesoporous Carbon Materials: Synthesis and Modification, Angew. Chem., Int. Ed., 2008, 47, 3696–3717 CrossRef CAS PubMed.
- X. Zhang, et al., High-performance lithium sulfur batteries based on nitrogen-doped graphitic carbon derived from covalent organic frameworks, Mater. Today Energy, 2018, 7, 141–148 CrossRef.
- T. A. Nguyen, R. K. Gupta and H. N. Abdelhamid, Covalent Organic Frameworks, CRC Press, 2022, DOI:10.1201/9781003206507.
- H. Nasser Abdelhamid, D. Georgouvelas, U. Edlund and A. P. Mathew, Cellulose-ZIF Hybrid Paper for Heavy Metal Removal and Electrochemical Sensing, Chem. Eng. J., 2022, 446(1), 136614 CrossRef.
- A. Abdellah, A. El-Adasy, A. Atalla, K. Aly and H. Abdelhamid, Palladium Nanocrystals-embedded Covalent Organic Framework (Pd@COF) as Efficient Catalyst for Heck Cross-Coupling Reaction, ChemRxiv, Cambridge Cambridge Open Engage, 2022, preprint, DOI: DOI:10.26434/chemrxiv-2022-jhv7t.
- R. Dawson, A. I. Cooper and D. J. Adams, Nanoporous organic polymer networks, Prog. Polym. Sci., 2012, 37, 530–563 CrossRef CAS.
- M. P. Tsyurupa and V. A. Davankov, Porous structure of hypercrosslinked polystyrene: state-of-the-art mini-review, React. Funct. Polym., 2006, 66, 768–779 CrossRef CAS.
- P. M. Budd, et al., Polymers of intrinsic microporosity (PIMs): robust, solution-processable, organic nanoporous materials, Chem. Commun., 2004, 4, 230–231 RSC.
- J. Y. Lee, C. D. Wood, D. Bradshaw, M. J. Rosseinsky and A. I. Cooper, Hydrogen adsorption in microporous hypercrosslinked polymers, Chem. Commun., 2006, 2670–2672, 10.1039/b604625h.
- Y. Xu, S. Jin, H. Xu, A. Nagai and D. Jiang, Conjugated microporous polymers: design, synthesis and application, Chem. Soc. Rev., 2013, 42, 8012 RSC.
- N. B. McKeown, et al., Towards polymer-based hydrogen storage materials: engineering ultramicroporous cavities within polymers of intrinsic microporosity, Angew. Chem., Int. Ed., 2006, 45, 1804–1807 CrossRef CAS PubMed.
- T. Ben, et al., Targeted synthesis of a porous aromatic framework with high stability and exceptionally high surface area, Angew. Chem., Int. Ed., 2009, 48, 9457–9460 CrossRef CAS PubMed.
- T. Ben and S. Qiu, Porous aromatic frameworks: synthesis, structure and functions, CrystEngComm, 2013, 15, 17–26 RSC.
- A. R. Abdellah, H. N. Abdelhamid, A.-B. A. A. M. El-Adasy, A. A. Atalla and K. I. Aly, One-pot synthesis of hierarchical porous covalent organic frameworks and two-dimensional nanomaterials for selective removal of anionic dyes, J. Environ. Chem. Eng., 2020, 8, 104054 CrossRef CAS.
- H. N. Abdelhamid, S. Sultan and A. P. Mathew, Three-Dimensional Printing of Cellulose/Covalent Organic Frameworks (CelloCOFs) for CO2 Adsorption and Water Treatment, ACS Appl. Mater. Interfaces, 2023, 15, 59795–59805 CrossRef CAS PubMed.
- X. Liu, et al., Porous organic polymers for high-performance supercapacitors, Chem. Soc. Rev., 2022, 3181–3225, 10.1039/d2cs00065b.
- S. Bandyopadhyay, et al., Redox-active, pyrene-based pristine porous organic polymers for efficient energy storage with exceptional cyclic stability, Chem. Commun., 2018, 54, 6796–6799 RSC.
- J. Chen, et al., Constructing porous organic polymer with hydroxyquinoline as electrochemical-active unit for high-performance supercapacitor, Polymer, 2019, 162, 43–49 CrossRef CAS.
- H. N. Abdelhamid, Covalent Organic Frameworks-Based Nanomaterials as Electrode Materials for Supercapacitors, Covalent Org. Frameworks, 2022 Search PubMed.
- M. Kundu and L. Liu, Direct growth of mesoporous MnO2 nanosheet arrays on nickel foam current collectors for high-performance pseudocapacitors, J. Power Sources, 2013, 243, 676–681 CrossRef CAS.
- K. Li, et al., Enhancing enzyme activity and enantioselectivity of Burkholderia cepacia lipase via immobilization on melamine-glutaraldehyde dendrimer modified magnetic nanoparticles, Chem. Eng. J., 2018, 351, 258–268 CrossRef CAS.
- Y. Zhang, et al., Removal of U(VI) by nano-scale zero valent iron supported on porous organic polymers, J. Radioanal. Nucl. Chem., 2020, 326, 845–855 CrossRef CAS.
- X. Xi, A. Pizzi and S. Amirou, Melamine-glyoxal-glutaraldehyde wood panel adhesives without formaldehyde, Polymers, 2018, 10(1), 22 CrossRef PubMed.
- M. Ibrahim, et al., High-Performance Lithium-Ion Battery and Supercapacitors Using Covalent Organic Frameworks (COFs)/Graphitic Carbon Nitride (g-C3N4)-Derived Hierarchical N-Doped Carbon, ACS Appl. Energy Mater., 2022, 5, 12828–12836 CrossRef CAS.
- T. T. Nguyen, et al., Direct growth of nickel cobalt layered double hydroxide on nickel foam via redox reaction between nitrate ion and ethanol for hybrid supercapacitors, Electrochim. Acta, 2021, 367, 137226 CrossRef CAS.
- H. Siyu, et al., Nickel disulfide films synthesized by sulfidation of nickel oxide film, Solid State Sci., 2011, 13, 1375–1378 CrossRef.
- Y. Zhang, J. Xu, Y. Zhang and X. Hu, 3D NiS dendritic arrays on nickel foam as binder-free electrodes for supercapacitors, J. Mater. Sci.: Mater. Electron., 2016, 27, 8599–8605 CrossRef CAS.
- A. I. Abdel-Salam, et al., Facile one-step hydrothermal method for NiCo2S4/rGO nanocomposite synthesis for efficient hybrid supercapacitor electrodes, Mater. Chem. Phys., 2022, 277, 125554 CrossRef CAS.
- A. K. Singh, D. Sarkar, K. Karmakar, K. Mandal and G. G. Khan, High-Performance Supercapacitor Electrode Based on Cobalt Oxide-Manganese Dioxide-Nickel Oxide Ternary 1D Hybrid Nanotubes, ACS Appl. Mater. Interfaces, 2016, 8, 20786–20792 CrossRef CAS PubMed.
- J. Wang, J. Polleux, J. Lim and B. Dunn, Pseudocapacitive contributions to electrochemical energy storage in TiO2 (anatase) nanoparticles, J. Phys. Chem. C, 2007, 111, 14925–14931 CrossRef CAS.
- M. R. Berthold, B. Wiswedel and D. E. Patterson, Neighborgram clustering interactive exploration of cluster neighborhoods, Proc.-IEEE Int. Conf. Data Mining, 2002, 581–584, DOI:10.1109/icdm.2002.1184004.
- K. V. Sankar and R. K. Selvan, The ternary MnFe2O4/graphene/polyaniline hybrid composite as negative electrode for supercapacitors, J. Power Sources, 2015, 275, 399–407 CrossRef CAS.
- R. Xue, et al., A new squaraine-triazine based covalent organic polymer as an electrode material with long life and high performance for supercapacitors, New J. Chem., 2021, 45, 679–684 RSC.
- R. Xue, et al., Preparation and energy storage application of a long-life and high rate performance pseudocapacitive COF material linked with –NH– bonds, New J. Chem., 2018, 42, 13726–13731 RSC.
- S. Chandra, et al., Molecular Level Control of the Capacitance of Two-Dimensional Covalent Organic Frameworks: Role of Hydrogen Bonding in Energy Storage Materials, Chem. Mater., 2017, 29, 2074–2080 CrossRef CAS.
- C. R. Deblase, K. E. Silberstein, T. T. Truong, H. D. Abruña and W. R. Dichtel, β-Ketoenamine-Linked Covalent Organic Frameworks Capable of Pseudocapacitive Energy Storage, J. Am. Chem. Soc., 2013, 135, 16821–16824 CrossRef CAS PubMed.
- Z. Zha, et al., 3D Graphene Functionalized by Covalent Organic Framework Thin Film as Capacitive Electrode in Alkaline Media, ACS Appl. Mater. Interfaces, 2015, 7, 17837–17843 CrossRef CAS PubMed.
- L. Tan, B. Li, X. Yang, W. Wang and B. Tan, Knitting hypercrosslinked conjugated microporous polymers with external crosslinker, Polymer, 2015, 70, 336–342 CrossRef CAS.
- W. Liu, et al., Two-Dimensional Polymer Synthesized via Solid-State Polymerization for High-Performance Supercapacitors, ACS Nano, 2018, 12, 852–860 CrossRef CAS PubMed.
- W. Zhao, et al., Hypercrosslinked porous polymer nanosheets: 2D RAFT agent directed emulsion polymerization for multifunctional applications, Polym. Chem., 2015, 6, 7171–7178 RSC.
- X. Wang, et al., Control Synthesis of Tubular Hyper-Cross-Linked Polymers for Highly Porous Carbon Nanotubes, ACS Appl. Mater. Interfaces, 2017, 9, 20779–20786 CrossRef CAS PubMed.
- M. Wang, R. Xue, H. Guo and W. Yang, A long-life pseudocapacitive triazine-based porous organic framework and resulting N-doped microporous carbons for supercapacitance application, Funct. Mater. Lett., 2019, 12, 1–5 Search PubMed.
Footnote |
| † Electronic supplementary information (ESI) available. See DOI: https://doi.org/10.1039/d3ra08489b |
| This journal is © The Royal Society of Chemistry 2024 |

