 Open Access Article
Design of gum Arabic/gelatin composite microcapsules and their cosmetic applications in encapsulating tea tree essential oil
Wei Yangab,
Yuxi Gonga,
Yansong Wanga,
Chao Wua,
Xiangyu Zhang*ab,
Jinlian Li*ab and
Dongmei Wu *ab
*ab
aCollege of Pharmacy, Jiamusi University, Jiamusi, Heilongjiang 154007, P. R. China. E-mail: zhangxy@jmsu.edu.cn; lijinlian@jmsu.edu.cn; dmwu@jmsu.edu.cn
bHeilongjiang Provincial Key Laboratory of New Drug Development and Pharmacotoxicological Evaluation, Jiamusi University, Jiamusi 154007, P. R. China
First published on 6th February 2024
Abstract
Microencapsulation has been widely used to protect essential oils, facilitating their application in cosmetics. In this study, gelatin, gum arabic and n-butyl cyanoacrylate were used as wall materials, and composite microcapsules of tea tree essential oil (TTO) were prepared using a combination of composite coagulation and in situ polymerization methods. When the ratio of gelatin to gum arabic is 1![[thin space (1/6-em)]](https://www.rsc.org/images/entities/char_2009.gif) :
:![[thin space (1/6-em)]](https://www.rsc.org/images/entities/char_2009.gif) 1, the ratio of TTO to n-butyl cyanoacrylate is 4
1, the ratio of TTO to n-butyl cyanoacrylate is 4![[thin space (1/6-em)]](https://www.rsc.org/images/entities/char_2009.gif) :
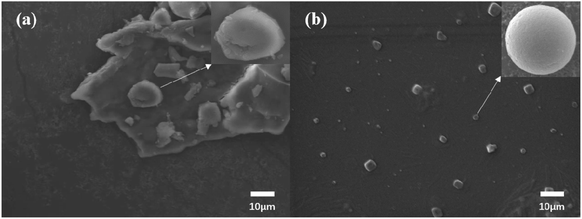
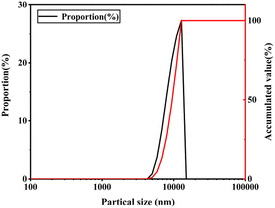
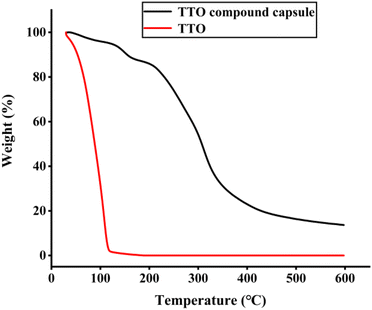
:![[thin space (1/6-em)]](https://www.rsc.org/images/entities/char_2009.gif) 1, the curing time is 10 h, and the encapsulation efficiency (EE) under these conditions is 73.61%. Morphological observation showed that the composite capsule was a micron-sized spherical particle with an average particle size of 10.51 μm, and Fourier transform infrared spectroscopy (FT-IR) confirmed a complex coagulation reaction between gelatin and gum arabic, and the disappearance of the n-butyl cyanoacrylate peak indicated that the film was formed in a condensation layer. The thermogravimetric analysis (TGA) results showed that the composite capsule greatly improved the thermal stability of TTO. Rheological testing showed that the viscosity and viscoelasticity of the surface composite capsules have been improved. In addition, the composite capsule showed good stability in the osmotic environment and has good sustained-release performance and antioxidant capacity in the average human skin environment.
1, the curing time is 10 h, and the encapsulation efficiency (EE) under these conditions is 73.61%. Morphological observation showed that the composite capsule was a micron-sized spherical particle with an average particle size of 10.51 μm, and Fourier transform infrared spectroscopy (FT-IR) confirmed a complex coagulation reaction between gelatin and gum arabic, and the disappearance of the n-butyl cyanoacrylate peak indicated that the film was formed in a condensation layer. The thermogravimetric analysis (TGA) results showed that the composite capsule greatly improved the thermal stability of TTO. Rheological testing showed that the viscosity and viscoelasticity of the surface composite capsules have been improved. In addition, the composite capsule showed good stability in the osmotic environment and has good sustained-release performance and antioxidant capacity in the average human skin environment.
1 Introduction
Developing composite materials with controlled structures and specific properties is currently a challenge in many technological and industrial fields.1–3 TTO is widely used for its whitening and antioxidant properties. However, its application is limited owing to its sensitivity to light, heat, pH, and other conditions.4,5 Therefore, we need a carrier to protect TTO and overcome the limitations of TTO application. Microcapsules are tiny particles formed with polymer wall materials coating core materials, which are solids, liquids and gases. Microencapsulation can effectively reduce the damage caused by harsh peripheral environment to the core materials of volatile small molecules and protect, stabilize, and prolong the service life and release rate of core materials.6,7 As a result, TTO encapsulated in microcapsules are widely used in food and cosmetics.8–10Owing to their low cost, compatibility, excellent thermal stability and controllable preparation process, polymers are often used as shell materials for microencapsulating essential oils. Polymer shell materials can determine the properties of microcapsules, including their morphology, size distribution and structure.11 Gelatin and gum arabic are commonly used materials in the complex coacervation method. Coacervate capsules prepared by this method exhibit excellent biocompatibility, surface activity and high encapsulation efficiency.12–15 Studies have confirmed that as carriers for protection and delivery, individual complex coacervation capsules lack stability in harsh solution conditions. Dardelle et al.16 confirmed that composite capsules improve the stability of capsules against diffusion loss compared to simple gel capsules.
It is confirmed that compared with traditional microcapsules with a single shell structure, composite microcapsules prepared by combining various preparation methods can combine the advantages of different shell structures, thus effectively improving the pressure resistance and thermal stability of microcapsules17 and compensating for the shortcomings of a single shell and enhancing the performance of microcapsules through additional shell layers.18–20 The composite coacervation method and the in situ polymerization method are commonly used preparation methods for microcapsules. Complex coacervation is a coacervation process between two or more polymers.21 In situ polymerization is a technology of mixing reactive monomers with core materials and controlling polymer deposition at the interface by adjusting pH and temperature to form dense films.22,23 We referred to the modification polymerization method of cyanide acrylic ester.24 Opt for introducing cyanopropyl acrylic acid n-butyl ester and combining complex coacervation and in situ polymerization to prepare composite capsules of TTO. Cyanopropyl acrylic acid n-butyl ester, as a medical adhesive, has the advantages of low toxicity, good film-forming properties,25 and ease of operation, enhancing the sustained release capability and stability of microcapsules in permeable environments.
This study used gelatin, gum arabic, and butyl cyanoacrylate as shell materials and combined coacervation and in situ polymerization methods to encapsulate TTO, resulting in composite TTO microcapsules. The microcapsules' particle size distribution, morphology, and EE were characterized. Finally, the stability, release behavior, and antioxidant capacity of the modified microcapsules were investigated.
2 Materials and methods
2.1 Materials
TTO (laboratory extraction). Gelatin (bloom: 100, isoelectric point: 4.72), gum arabic, sodium hydroxide (NaOH), and glacial acetic acid were purchased from Sinopharm Group Chemical Reagent Co. N-Butyl-cyanoacrylate was purchased from the Chongqing Jingu Rubber Industry. DPPH and ABTS were purchased from Shanghai Yuan Ye Biotechnology Co. In addition to TTO, all reagents used in this experiment were of analytical grade and used as received unless stated otherwise. Triple distilled water was used throughout the investigation.2.2 Preparation of TTO/gum Arabic/gelatin composite microcapsules
We used the improved aggregation method developed by B. Fasipe et al.20 to prepare composite microcapsules. 10 mL of 2% gelatin solution was mixed with gum arabic solution at 40 °C, and stirred well with the acetic acid solution and the pH was adjusted to 4.0. Then, 0.11 g of butyl cyanoacrylate was combined with 0.5 g of tea tree oil and dripped into the gelatin and gum arabic solution. The solution was stirred for 2 hours, cooled with cold water, followed by addition of glutamine transferase, and solidified for 10 h. After preparation, the sample was washed several times with purified water to eliminate the impurities and placed in a freeze-dryer to obtain a freeze-dried microcapsule powder sample for further analysis.2.3 Drug loading capacity and EE
According to the test method of Liu et al.,17 the packaging efficiency is calculated, and some modifications are done. The freeze-dried powder sample (0.5 g) was combined with 30 mL ethanol at 40 °C for 5 min without destroying microcapsules, and the beaker was gently shaken to extract surface TTO. The freeze-dried powder sample (0.5 g) was mixed with 30 mL of ethanol and sonicated for 20 min to completely break down the microcapsules, followed by centrifugation at 1000 rpm for 20 min. After extraction, we collected the supernatant of both. The ultraviolet absorption value determines the amount of surface oil and total oil at 265 nm, and the standard curve is drawn by the TTO–ethanol common solution prepared in advance, and its equation is y = 0.73071C + 0.00831 (R2 = 0.99914). Then, EE is obtained by eqn (1).26 The equation is as follows:
 | (1) |
2.4 Characteristic analysis of compound capsules
A small amount of microcapsule powder was gently sprayed on the conductive adhesive, the excess powder on the surface was blown off with an ear-washing ball, and then gold was sprayed on the sample and it was observed under a scanning electron microscope (JBM-7800F).A Baxter laser particle size analyzer (Baxter 90 nanometer particle size analyzer) was used to determine the size distribution of microcapsules.
The potassium bromide particle method was used to conduct the infrared spectrum experiment of microcapsules. The microcapsule powder and potassium bromide sample crystals are mixed, evenly ground, and compressed to prepare samples. A Fourier transform infrared spectrometer (VERTEX 70) measured the transmission infrared spectrum. The scanning range is 4000–500 cm−1.
A thermogravimetric analyzer (STA 449C) was utilized to test the thermal stability of microcapsules. The sample was heated from 30 °C to 600 °C at a rate of 10 °C min−1 under a nitrogen atmosphere.
2.5 Rheological property determination
Using a dynamic rheometer (HR10 US) at 25 °C, the viscosity was measured at shear rates ranging from 0.01 to 100 s−1. At the same temperature, the viscoelasticity of the microcapsules was measured within the linear viscoelastic range at frequencies from 100 to 0.1 rad.2.6 Volatile compound analysis
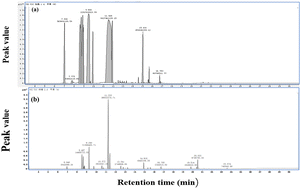
Gas chromatography-mass spectrometry refers to the method of Liu et al.17 Using a gas chromatography-mass spectrometry (GC9790II) instrument for the analysis of TTO and TTO complex capsules, the following conditions were applied: HP-5 column, injector temperature of 250 °C, and detector temperature of 250 °C. The initial column temperature was maintained at 80 °C for 1 min, then increased at a rate of 10 °C min−1 to 120 °C and held for 3 min, followed by an increase at a rate of 15 °C min−1 to 230 °C and held for 2 min. The sample volume was 0.5 mL, with a split ratio of 50![[thin space (1/6-em)]](https://www.rsc.org/images/entities/char_2009.gif) :
:![[thin space (1/6-em)]](https://www.rsc.org/images/entities/char_2009.gif) 1, and a carrier gas flow rate of 1 mL min−1.
1, and a carrier gas flow rate of 1 mL min−1.
2.7 Stability study
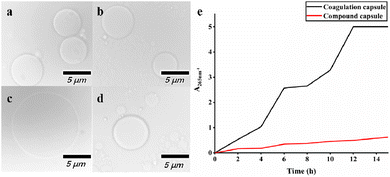
The new TTO condensed capsules and TTO composite capsules were put in a specific concentration of sodium dodecyl sulfate solution to simulate the stability of the capsules in a relatively harsh environment with permeability. The micro-morphology of microcapsules was observed initially and after soaking for 15 h, and the concentration of TTO in the solution was measured via UV-vis spectrophotometry every 3 h to reflect the stability of condensed capsules and composite capsules in an osmotic environment.2.8 In vitro release studies of composite microcapsules
Sustained release performance is a significant index to evaluate the quality of microcapsules. We studied and compared the release behaviour of condensed and composite capsules at room temperature. The microcapsules were positioned in an open environment at 37 °C, pH 5.5, and the same amount of samples were collected at regular intervals (3, 6, 9, 12 and 15 days). The content of TTO in the microcapsules was detected by UV-vis spectrophotometry. The release amount of TTO was calculated, and the curve of the release amount of essential oil with time was obtained.2.9 Determination of antioxidant properties
Sample Preparation: a certain amount (based on the mass of TTO) of TTO, TTO microencapsulated powder, and TTO composite capsule powder was weighed out. Each was dissolved in an equal volume of anhydrous ethanol to ensure that the concentration of TTO is identical in all three solutions.Sample solution (2 mL) was extracted from each of the above samples at a specific time interval, gently shaken and centrifuged to form a clear sample solution. The 2,2-diphenyl-1-picrylhydrazyl (DPPH) and 2,2-azinobis(3-ethylbenzothiazoline-6-sulfonic acid ammonium salt) (ABTS) scavenging rates were measured under the conditions of human skin (37 °C, pH 5.5).
 | (2) |
First, 2 mL of ABTS ethanol solution was centrifuged and 2 mL of anhydrous ethanol was added. Then, another 2 mL of ABTS ethanol solution was centrifuged and 2 mL each of TTO ethanol solution, coagulant capsule powder solution, and composite capsule powder solution was added. The solution was mixed well, vigorously shaken, and left to react in the dark for 30 minutes. The enzyme immunoassay was used to determine the absorbance of each mixed solution at 734 nm. The calculation of ABTS clearance rate is based on formula (3):30
 | (3) |
3 Results and discussion
3.1 The schematic illustration of the fabrication of composite microcapsules
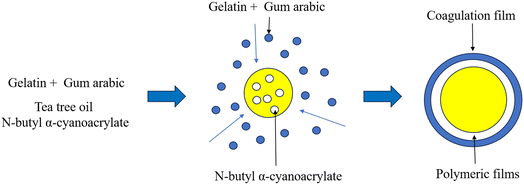
The preparation and formation of micro-capsules are illustrated in Fig. 1. Gelatin and gum arabic are dissolved in water, respectively, to constitute a solution. When gelatin and gum arabic are completely dissolved, the two solutions are mixed. Acidic dissolution is in addition to adjusting the pH to make the adhesive tape positively charged. The adhesive tape reacts with the negatively charged gum arabic in a complex coagulation reaction in the solution, and liquid–liquid separation occurs through electrostatic interaction. In this process, van der Waals force and hydrophobic interaction in protein will further promote the formation of complex condensation.31 Cyanoacrylate will spontaneously undergo a rapid polymerization reaction under the action of nucleophiles. When the TO combined with n-butyl cyanoacrylate is added to the gelatin–gum arabic mixed solution, cyanoacrylate will rapidly polymerize due to contact with water, forming a polycyanoacrylate film. By stirring, the film is wrapped by the condensed layer.32 Finally, a bilayer microcapsule with a coagulation layer on the outside and n-butyl cyanoacrylate on the inside is formed.3.2 Optimization of preparation conditions
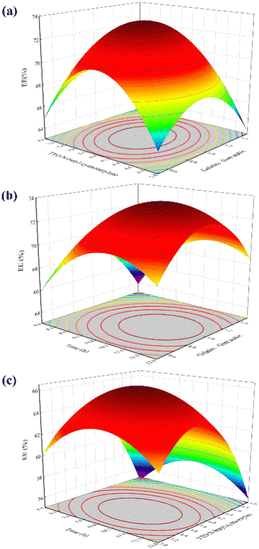
![[thin space (1/6-em)]](https://www.rsc.org/images/entities/char_2009.gif) :
:![[thin space (1/6-em)]](https://www.rsc.org/images/entities/char_2009.gif) 1, the EE is the highest, reaching 72.26%. The polymerization rate of α-butyl cyanoacrylate is very fast after it is compounded with water.33,34 In the case of low doses, n-butyl cyanoacrylate can be consumed during the formation of composite capsules. With the increase in dosage, the n-butyl cyanoacrylate may not be wholly consumed, which leads to excessive n-butyl cyanoacrylate polymerization to form irregular polymers, which destroys the formed composite capsules and affects the formation of new capsules so that the EE will decrease.
1, the EE is the highest, reaching 72.26%. The polymerization rate of α-butyl cyanoacrylate is very fast after it is compounded with water.33,34 In the case of low doses, n-butyl cyanoacrylate can be consumed during the formation of composite capsules. With the increase in dosage, the n-butyl cyanoacrylate may not be wholly consumed, which leads to excessive n-butyl cyanoacrylate polymerization to form irregular polymers, which destroys the formed composite capsules and affects the formation of new capsules so that the EE will decrease.
![[thin space (1/6-em)]](https://www.rsc.org/images/entities/char_2009.gif) :
:![[thin space (1/6-em)]](https://www.rsc.org/images/entities/char_2009.gif) 1, the EE is the highest, reaching 71.93% and the increase of gelatin content in the system leads to the rise of composite coagulant, forming a more stable coagulation layer. When the amount of gelatin exceeds that of gum arabic, the EE of microcapsules decreases gradually. The reason may be that positively charged gelatin remains in the aqueous solution, which destroys the formation of capsules. Therefore, when the mass ratio of gelatin to gum arabic is 1
1, the EE is the highest, reaching 71.93% and the increase of gelatin content in the system leads to the rise of composite coagulant, forming a more stable coagulation layer. When the amount of gelatin exceeds that of gum arabic, the EE of microcapsules decreases gradually. The reason may be that positively charged gelatin remains in the aqueous solution, which destroys the formation of capsules. Therefore, when the mass ratio of gelatin to gum arabic is 1![[thin space (1/6-em)]](https://www.rsc.org/images/entities/char_2009.gif) :
:![[thin space (1/6-em)]](https://www.rsc.org/images/entities/char_2009.gif) 1,35 the packaging efficiency is the highest, which is the best mass ratio of gelatin to gum arabic.
1,35 the packaging efficiency is the highest, which is the best mass ratio of gelatin to gum arabic.![[thin space (1/6-em)]](https://www.rsc.org/images/entities/char_2009.gif) :
:![[thin space (1/6-em)]](https://www.rsc.org/images/entities/char_2009.gif) 1, the mass ratio of TTO to cyanopropyl acrylate butyl ester is 4
1, the mass ratio of TTO to cyanopropyl acrylate butyl ester is 4![[thin space (1/6-em)]](https://www.rsc.org/images/entities/char_2009.gif) :
:![[thin space (1/6-em)]](https://www.rsc.org/images/entities/char_2009.gif) 1, and the curing time is 10 hours, the EE reaches its maximum value.
1, and the curing time is 10 hours, the EE reaches its maximum value.
3.3 Characteristic analysis of compound capsules
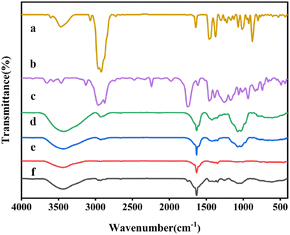 | ||
| Fig. 6 FT-IR spectra of TTO (a), n-butyl cyanoacrylate (b), gum arabic (c), gelatin mixed with gum arabic (d), gelatin (e) and composite capsule (f). | ||
Gum arabic is a polysaccharide containing a free carboxyl group (O–H), and its absorption spectrum ranges from 2500 to 3300 cm−1, with a negatively charged molecule attached. The peak between 2921 and 2937 cm−1 of the condensate is due to the strong and extensive O–H stretching, which can be the free carboxyl group in gum arabic.40 In addition, the characteristics of the amide peak can be seen at 1452 cm−1 in the microcapsule spectrum, which also shows a moderate C–H bending appearance. Aromatic compounds also exist in the sample formula, and the peak at 1746–1747 cm−1 indicates C–H bending. Through the experiment of Fourier transform infrared spectroscopy, it was confirmed that the materials of the coacervate were not simply physically mixed, and the disappearance of the TTO seal also confirmed that TTO was coated in the capsule.
3.4 Rheological property determination
Fig. 8 (a) shows the shear rate and viscosity of capsules containing n-butyl cyanoacrylate as a function of common complexation coagulation. As can be seen from the figure, the viscosity of the microcapsules does not change much after the addition of n-butyl cyanoacrylate, and the newly formed film has little effect on the viscosity of the original cohesive layer. With the increase of shear rate, the apparent viscosity decreases, and shear thinning appears, showing the characteristics of a pseudoplastic fluid caused by external force. The conformation of polymer chains in the cohesive layer is required to change.45,46 At the same time, the polymer chains have relaxation characteristics, and the forced conformation can be wholly or partially recovered. When the shear rate is low, the molecular conformation changes slowly, and there is adequate time to recover. When the shear rate increases, the molecular conformation changes greatly, and the molecular chains cannot recover in time, which makes the polymer chains move along the direction of fluid flow. During this period, hydrogen bonds disappear, and the force decreases, showing a viscosity trend decreasing with the increase of shear rate.47,48 However, the viscosity of microcapsules added with n-butyl cyanoacrylate will decrease more obviously because their condensed layer is thinner than that of ordinary microcapsules. | ||
| Fig. 8 Apparent viscosity of composite microcapsules (a), and storage modulus and loss modulus of common complex coacervated microcapsules (b) and composite microcapsules (c). | ||
As presented in Fig. 8(b) and (c), the dynamic moduli of normal condensed microcapsules and those added with n-butyl cyanoacrylate are measured, respectively. The elastic modulus of normal condensed microcapsules is equal to the loss modulus, showing high viscosity. With the increase of angular frequency, the elastic modulus is progressively greater than the loss modulus, showing that the elasticity is greater than the viscosity.49–52 The composite capsules added with n-butyl cyanoacrylate show stronger elasticity than the normal condensed capsules. Moreover, the storage modulus of the composite capsules is higher than the loss modulus at any frequency, indicating that the elastic component is the main contributor to viscoelasticity.
3.5 Volatile compound analysis
As shown in Fig. 9, TTO and TTO composite capsules have the same characteristic peaks, indicating that the main components of TTO have not changed before and after encapsulation. Therefore, the encapsulation of TTO does not affect its performance, which lays a good foundation for applying TTO composite capsules.3.6 Stability study
In this study, a key function of the composite capsule is to serve as a transport carrier for the core material. For example, in a permeable environment, we used a solution of sodium dodecyl sulfate as an anionic surfactant to compare the stability of TTO coagulated capsules and TTO composite capsules.16 As shown in Fig. 10, after 15 h, the composite capsules expanded significantly, and the core–shell structure decomposed, and thus released TTO. In contrast, the degree of expansion of the coagulated capsules was lower. Fig. 10(e) indicates that the TTO concentration in the solution of coagulated capsules was higher than that in the composite capsules. The results indicate that under permeable conditions, the stability of the composite capsules is better.3.7 In vitro release studies of composite microcapsules
Fig. 11 presents the release curves for TTO cohesive capsules and TTO composite capsules at human body temperature (37 °C) over a period of 15 days, along with the content of TTO released from the system. It can be observed that with the passage of time, both types of capsules gradually release increasing amounts of TTO. Notably, the cohesive capsules exhibit a burst release behavior at the beginning, followed by a gradual slowdown in the release rate, whereas the composite capsules maintain a more stable release throughout the process with a slight deceleration in rate. The results indicate that both cohesive and composite capsules have a controlled release effect on TTO, with the composite capsules showing superior control release capabilities compared to the cohesive capsules.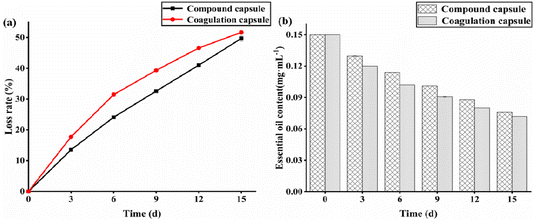 | ||
| Fig. 11 Release of TTO from coacervate capsules and composite capsules under human skin conditions (37 °C, pH 5.5). | ||
Fig. 12 simulates the release behavior of TTO in coagulated capsules and composite capsules under the conditions of 37 °C and pH 5.5 using four kinetic models (zero-order, first-order, Higuchi, and Peppas). Table 1 presents the release kinetic parameters of coagulated capsules and composite capsules. The model that best describes the release rate of oil from the cohesive capsules is first-order, and for the composite capsules, it is Peppas. The correlation is statistically significant.
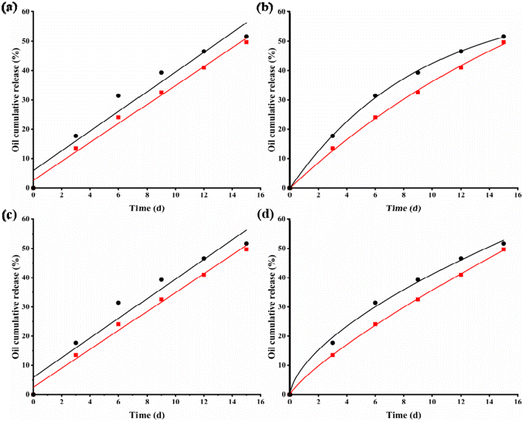 | ||
| Fig. 12 Four kinetic models, zero-order (a), first-order (b), Higuchi (c), and Peppas (d), were used to fit the release behavior of TTO gel capsules and TTO composite capsules. | ||
| Mathematical models | Coagulation capsules | Compound capsules |
|---|---|---|
| Zero order | Mt = 3.36x + 5.93 (R2 = 0.93) | Mt = 3.23x + 2.58 (R2 = 0.98) |
| First order | Mt = 63.69(1 – e−0.11) (R2 = 0.99) | Mt = 98.89(1 − e−0.046) (R2 = 0.98) |
| Higuchi | Mt = 6.72x0.5 + 5.93 (R2 = 0.93) | Mt = 6.46x0.5 + 2.58 (R2 = 0.98) |
| Peppas | Mt = 9.97x0.62 (R2 = 0.98) | Mt = 5.64x0.8 (R2 = 0.99) |
3.8 Determination of antioxidant properties
DPPH is commonly used to detect the antioxidant capacity of active substances and can be used to estimate the clearance rate of aromatic free radicals. The ABTS detection method is also widely used, and the two methods can be combined to evaluate antioxidant activity and antioxidant capacity. Fig. 13 illustrates the variation in the scavenging ability of TTO, TTO encapsulated capsules, and TTO composite capsules on DPPH (a) and ABTS (b) free radicals over a period of 15 days. On day 0, TTO exhibited the highest activity in scavenging DPPH and ABTS radicals, followed by TTO encapsulated beads, with TTO composite capsules showing the least activity. Throughout the storage period, the antioxidant capacity of TTO composite capsules declined the slowest, while that of TTO declined the fastest. By the 15th day of storage, the TTO composite capsules had a higher rate of scavenging for both types of free radicals compared to the TTO encapsulated beads.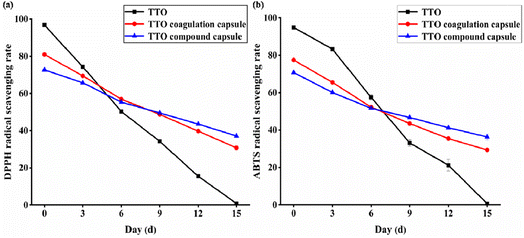 | ||
| Fig. 13 Analysis of antioxidant properties: (a) DPPH radical scavenging rate; (b) ABTS radical scavenging rate. | ||
The primary reason is that the level of antioxidant capacity depends on the amount of active substances in the Tea Tree Oil (TTO) within the system, meaning that the more TTO released, the stronger the antioxidant capacity. In the control group with pure TTO added to the culture medium, the initial high concentration of TTO resulted in strong antioxidant capacity. However, due to the inherent instability of essential oils, which are prone to evaporation and oxidation, the TTO content in the system decreased, leading to a rapid weakening of antioxidant capacity. In the case of TTO encapsulated beads and TTO composite capsules, the burst release of the encapsulated beads at the start resulted in a higher rate of free radical elimination than the composite capsules in the early stages of the antioxidant test. However, as the release rate of the encapsulated beads diminished over time and fell below that of the composite capsules, combined with the loss of TTO due to oxidation and evaporation, the antioxidant capacity of the encapsulated beads was lower in the later stages compared to the composite capsules. Therefore, compared to TTO encapsulated beads, the composite capsules achieved a more stable and long-lasting antioxidant effect.
4 Conclusions
In this study, the composite microcapsules were prepared by combining the composite coagulation method and the in situ polymerization method, and the EE of the optimized capsules was 74%. The optimized microcapsules were observed to be spherical in morphology, with a smooth surface and no cracks or cavities. Microencapsulation effectively improves the thermal stability of TTO. The results show that combining the two methods improves the mechanical properties of the two-layer membrane compared with the condensed capsule, which can maintain good stability in a certain harsh environment, has good slow-release performance, and maintains long-term stable antioxidant capacity. Therefore, TTO complex capsules have the potential to expand the application prospects of TTO in the field of cosmetics.Conflicts of interest
The authors declare no competing financial interest.Acknowledgements
We gratefully acknowledge the support of the Heilongjiang Province Key Research and Development Plan Project (JD22A016), Heilongjiang Province “Double first-class” discipline collaborative innovation achievement construction project (LJGXCG2022-126), Basic Scientific Research Project for Heilongjiang Provincial Colleges and Universities (2022-KYYWF-0609), Heilongjiang Provincial Key Laboratory of New Drug Development and Pharmacotoxicological Evaluation Open Fund Project (kfkt2023-09), Heilongjiang Huahao Testing Technology Service Co., LTD.References
- H. Li, Y. Ma, Z. Li, Y. Cui and H. Wang, Compos. Sci. Technol., 2018, 164, 120–128 CrossRef CAS.
- S. Eyupoglu, D. Kut, A. O. Girisgin, C. Eyupoglu, M. Ozuicli, H. Dayioglu, M. Civan and L. Aydin, Text. Res. J., 2018, 89, 1417–1435 CrossRef.
- B. Peña, C. Panisello, G. Aresté, R. Garcia-Valls and T. Gumí, Chem. Eng. J., 2012, 179, 394–403 CrossRef.
- Q. Xu, R. Qiu, Z. Bai, J. Ma, Q. Fan, Y. Li, S. Taha, Z. Ramzan and J. Li, J. Appl. Polym. Sci., 2021, 138, 51217 CrossRef CAS.
- M. A. Hernandez-Fernandez, S. Garcia-Pinilla, O. I. Ocampo-Salinas, G. F. Gutierrez-Lopez, H. Hernandez-Sanchez, M. Cornejo-Mazon, M. J. Perea-Flores and G. Davila-Ortiz, Foods, 2020, 9, 1375 CrossRef CAS PubMed.
- S. J. Calva-Estrada, M. R. Mendoza, O. García, V. M. Jiménez-Fernández and M. Jiménez, Powder Technol., 2018, 323, 416–423 CrossRef CAS.
- H. S. Elshafie and I. Camele, BioMed Res. Int., 2017, 2017, 9268468 Search PubMed.
- N. Lourith and M. Kanlayavattanakul, Sustainable Chem. Pharm., 2023, 32, 101005 CrossRef CAS.
- P. Borotova, L. Galovicova, N. L. Vukovic, M. Vukic, E. Tvrda and M. Kacaniova, Plants, 2022, 11, 558 CrossRef CAS.
- X. Liu, H. Deng, Q. Xu, K. Luo, J. Zhou, W. Gao, Z. Wang, H. Zhang and X. Zhou, Aquac. Rep., 2022, 27, 101380 CrossRef.
- L. M. Devi, A. B. Das and L. S. Badwaik, Int. J. Biol. Macromol., 2023, 235, 123896 CrossRef CAS PubMed.
- Y. Li, J. Liu, X. He, D. Kong, C. Zhou, H. Wu, Z. Yang, Z. Yang and Y. Hu, Macromol. Mater. Eng., 2020, 305, 1900851 CrossRef CAS.
- W. L. Liu, Z. B. Xiao, G. Y. Zhu, R. J. Zhou, E. Q. Wang and Y. W. Niu, Appl. Mech. Mater., 2013, 477–478, 1229–1233 Search PubMed.
- J. D. Ogilvie-Battersby, R. Nagarajan, R. Mosurkal and N. Orbey, Colloids Surf., A, 2022, 640, 128494 CrossRef CAS.
- H. H. Dai, X. D. Li, A. C. Wei, X. D. Wang and D. Y. Wang, J. Oleo Sci., 2020, 69, 685–692 CrossRef CAS PubMed.
- G. Dardelle, M. Jacquemond and P. Erni, Adv. Mater., 2017, 29, 1606099 CrossRef PubMed.
- Y. Liu, W. Cao, J. Wang, L. Zhang, Y. Yang, M. Liu, H. Wang and S. Wang, J. Food Sci., 2022, 87, 5017–5028 CrossRef CAS PubMed.
- Y. Zhao, H. Li, Y. Wang, Z. Zhang and Q. Wang, Int. J. Biol. Macromol., 2023, 249, 124776 CrossRef CAS.
- P. Kaushik, K. Rawat, V. K. Aswal, J. Kohlbrecher and H. B. Bohidar, Carbohydr. Polym., 2019, 224, 115150 CrossRef PubMed.
- M. S. Mesiha, M. B. Sidhom and B. Fasipe, Int. J. Pharm., 2005, 288, 289–293 CrossRef CAS PubMed.
- J. Liu, C. Liu, Y. Liu, M. Chen, Y. Hu and Z. Yang, Colloids Surf., B, 2013, 109, 103–108 CrossRef CAS PubMed.
- S. Sarkar and B. Kim, Polym. Compos., 2016, 39, 636–644 CrossRef.
- H. Zhang, Y. Bai and F. Cheng, Constr. Build. Mater., 2018, 187, 138–148 CrossRef CAS.
- R. S. Samakradhamrongthai, P. Thakeow Angeli, P. Kopermsub and N. Utama-Ang, Carbohydr. Polym., 2019, 226, 115262 CrossRef CAS PubMed.
- R. J. Holl and R. P. Chambers, J. Microencapsulation, 2002, 19, 699–724 CrossRef CAS PubMed.
- Y. Jiang, K. Zang, J. Sun, J. Chandrapala, C. Brennan, M. Majzoobi and X. A. Zeng, Food Res. Int., 2023, 172, 113135 CrossRef CAS PubMed.
- A. Senthilkumar, A. Thangamani, K. Karthishwaran and A. J. Cheruth, S. Afr. J. Bot., 2020, 129, 100–105 CrossRef CAS.
- A. A. N. Gunny, S. J. Leem, M. M. Z. Makhtar, N. I. Zainuddin, M. H. Mohd Roslim, R. H. Raja Hashim, K. Pusphanathan, M. R. Siddiqui, M. Alam and M. Rafatullah, Polymers, 2023, 15, 2722 CrossRef CAS.
- P. A. Loyeau, M. J. Spotti, N. L. Vanden Braber, Y. E. Rossi, M. A. Montenegro, G. Vinderola and C. R. Carrara, Food Hydrocolloids, 2018, 85, 129–135 CrossRef CAS.
- H. H. Wang, M. Y. Li, Z. Y. Dong, T. H. Zhang and Q. Y. Yu, Foods, 2021, 10, 2268 CrossRef CAS PubMed.
- Y. P. Timilsena, T. O. Akanbi, N. Khalid, B. Adhikari and C. J. Barrow, Int. J. Biol. Macromol., 2019, 121, 1276–1286 CrossRef CAS PubMed.
- T. Ma, H. Zhao, J. Wang and B. Sun, Food Hydrocolloids, 2019, 87, 637–643 CrossRef CAS.
- C. Gross-Heitfeld, J. Linders, R. Appel, F. Selbach and C. Mayer, J. Phys. Chem. B, 2014, 118, 4932–4939 CrossRef CAS PubMed.
- N. Ballard, S. Hamzehlou, F. Ruiperez and J. M. Asua, Macromol. Rapid Commun., 2016, 37, 1364–1368 CrossRef CAS.
- P. H. M. Marfil, B. B. Paulo, I. D. Alvim and V. R. Nicoletti, J. Food Process Eng., 2018, 41, e12673 CrossRef.
- J. U. Ha, Y. J. Hwang, S. K. Jeoung, P. C. Lee, S. Y. Kim, J. K. Park, J. T. Kim and J. H. Yeom, J. Appl. Polym. Sci., 2019, 136, 47499 CrossRef.
- Q. Guo, S. Li, G. Du, H. Chen, X. Yan, S. Chang, T. Yue and Y. Yuan, LWT, 2022, 165, 113683 CrossRef CAS.
- M. Chen, J. Liu, Y. Liu, C. Guo, Z. Yang and H. Wu, RSC Adv., 2015, 5, 14522–14530 RSC.
- B. Ocak, Environ. Sci. Pollut. Res. Int., 2020, 27, 42727–42737 CrossRef CAS PubMed.
- C. Cai, R. Ma, M. Duan and D. Lu, RSC Adv., 2019, 9, 19740–19747 RSC.
- Z.-J. Zhang, N. Li, H.-Z. Li, X.-J. Li, J.-M. Cao, G.-P. Zhang and D.-L. He, Ind. Crops Prod., 2018, 112, 660–667 CrossRef CAS.
- F. M. Bezerra, M. Lis, Ó. G. Carmona, C. G. Carmona, M. P. Moisés, G. M. Zanin and F. F. Moraes, Powder Technol., 2019, 343, 775–782 CrossRef CAS.
- X. Yang, N. Gao, L. Hu, J. Li and Y. Sun, J. Food Eng., 2015, 161, 87–93 CrossRef CAS.
- Z. Yang, Z. Peng, J. Li, S. Li, L. Kong, P. Li and Q. Wang, Food Chem., 2014, 145, 272–277 CrossRef CAS.
- J. Sprakel, S. B. Lindstrom, T. E. Kodger and D. A. Weitz, Phys. Rev. Lett., 2011, 106, 248303 CrossRef PubMed.
- T. Divoux, V. Grenard and S. Manneville, Phys. Rev. Lett., 2013, 110, 018304 CrossRef PubMed.
- A. P. Dhand, R. Poling-Skutvik and C. O. Osuji, Soft Matter, 2021, 17, 4517–4524 RSC.
- R. Radhakrishnan, T. Divoux, S. Manneville and S. M. Fielding, Soft Matter, 2017, 13, 1834–1852 RSC.
- W. Xiong, C. Ren, W. Jin, J. Tian, Y. Wang, B. R. Shah, J. Li and B. Li, Food Hydrocolloids, 2016, 61, 895–902 CrossRef CAS.
- Q. Ru, Y. Wang, J. Lee, Y. Ding and Q. Huang, Carbohydr. Polym., 2012, 88, 838–846 CrossRef CAS.
- M. Raei, A. Rafe and F. Shahidi, J. Food Eng., 2018, 228, 25–31 CrossRef CAS.
- D. Dong and B. Cui, J. Food Process Eng., 2019, 42, e13169 CrossRef.
| This journal is © The Royal Society of Chemistry 2024 |

