 Open Access Article
Synthesis of graphite-based lead composites and modification of their physicochemical and electrochemical properties
Tomasz Rozmanowski * and
Piotr Krawczyk
Poznań University of Technology, Institute of Chemistry and Technical Electrochemistry, Ul. Berdychowo 4, 60-965 Poznań, Poland. E-mail: tomasz.rozmanowski@put.poznan.pl; Tel: +48 61 665 2571 Tel: +48 61 665 3659
First published on 28th March 2024
Abstract
The present work describes preparation of a graphite lead composite, its modification and the examination of basic physicochemical and electrochemical properties. Graphite lead composites are the products of reaction of lead chloride with flaky graphite performed in a molten salt system. The process was carried out at 450 °C for 96 hours. In the second stage, the obtained composites were subjected to thermal or chemical treatment in order to modify their physicochemical properties. The structure of the as prepared material has been examined by X-ray diffraction analysis. Transmission electron microscopy analysis (TEM) along with energy dispersive spectroscopy (EDS) have been used to determine the size as well as the distribution of Pb particles. To study the electrochemical properties of graphite-based lead composites, cyclic voltammetry and galvanostatic methods have been used. It has been proved that the thermally modified compound at 600 °C contains on its surface spherical particles of lead chloride and/or oxide with diameters varying from hundreds of nanometers to several micrometers. The acquired electrochemical results revealed that graphite/Pb composites exhibit good electrochemical activity towards the reversible reaction of Pb → Pb2+ oxidation. Charge associated with the reversible transformation of Pb to Pb2+ amounts to 15.72 C g−1 and 14.62 C g−1 for the original compound and the compound heated at 600 °C, respectively. It has been also proved that the highest level of structure modification of the composite is reached by its chemical treatment with hydrogen peroxide. However, the mentioned modification leads to the removal of the entire lead from the structure of the graphite matrix.
1. Introduction
Despite its highly toxic nature, which causes serious environmental problems, lead is widely used in many electrochemical systems. The most common electrochemical device based on lead is the lead-acid battery, in which positive and negative electrode are based on PbO2 and Pb, respectively.1,2 Lead-acid batteries are cost-effective secondary cells with well-developed production technology and good availability of all raw materials.3–5 Due to the safety of use, high tolerance to overcharging and resistance to wear and tear they have been widely used in SLI systems (starting, lighting and ignition), hybrid electric vehicles (HEV), and energy storage system.6,7 Moreover, spent lead-acid batteries can be recycled and reused to create new batteries (recycling rates in the United States of America and the European Union have reached 98–99%).6 Recently, many studies have proven that adding a small amount of carbon material to the negative Pb electrode improves the performance of lead-acid batteries.8–10 Among the carbon additives, the following materials can be distinguished: carbon nanotubes,11,12 carbon black,13,14 activated carbons,15,16 activated carbon fibers17 and graphite.18 The use of the above-mentioned materials contributes to increment in porosity and electron conductivity as well as to inhibition of sulfation of the negative plate.19,20 The presence of carbon also lowers the hydrogen evolution over-potential at the negative electrode.21 Moreover, the differences in the physicochemical properties of the carbon material and the active mass of the negative electrode result in a weak bonding strength between the two components, which, to some extent, eliminates the positive impact of the carbon additive used.22 To overcome those obstacles, carbon materials can be replaced by their composites with lead or lead oxide.23–25 Carbon-lead composites, in particular C–PbO2, can also be used as anodes in electro-oxidation processes of organic pollutants. Their high activity, comparable to boron-doped diamond (BDD) electrodes arises from the combination of the developed specific surface of the carbon matrix with high electroactivity of PbO2 in the reaction of ·OH radicals formation. Additionally, the generated ·OH radicals are loosely physisorbed on the electrode surface, thus allowing their reaction with organic molecules near the electrode. Although BDD electrodes provide higher degrees of mineralization, C–PbO2 electrodes are cheaper and simpler to prepare, simultaneously exhibiting greater stability.26 In the scientific literature, one can find examples of practical application of such composite material as PbO2–nitrogen-doped carbon nanosheets,27 PbO2–graphene nanoribbons,28 carbon felt–PbO2 (ref. 29) or black carbon–PbO2.30 They are used for electro-oxidation of sulfamethoxazole, mixture of phenolic compounds, diuron herbicide and pesticide wastewater or antibiotic wastewater, respectively.Finally, recent researches indicate the possibility of use of C–Pb and C–PbO as anode materials in Li-metal batteries31 and lithium-ion batteries to improve some of their operational parameters.32–34
In this paper, the graphite–lead chloride composite was prepared by reaction of graphite flakes with PbCl2 in molten salt system. Flaky graphite was chosen as the carbon matrix in the presented investigations because our goal was to obtain an intercalation compound of graphite with lead chloride and iron chloride. On the other hand it is widely known, that the intercalation process is possible only in the case of graphite or carbon materials showing a graphitic structure (presence of graphene layers). The obtained compound was further modified by heat and chemical treatment. The electrochemical properties of all the reached materials were examined using cyclic voltammetry and galvanostatic methods, and the gained results were correlated with data acquired from physicochemical analyses. To our best knowledge, the present work for the first time describes electrochemical properties of graphite intercalation compound with lead chloride. In literature there is no papers providing an essential information in term of GIC with lead chloride subjected to electrochemical characterization. Our goal was to achieve composite electrode exhibiting catalytic activity related with Pb catalyst, allowing its application as a potential material in lead-acid battery or in the degradation processes of selected organic pollutants. Moreover, further investigations have been done to determine the influence of heat and chemical treatment on the morphological and structural properties of the obtained compound, and thus on its electrochemical properties. Therefore, the investigations performed can be regarded as a novel solutions in the field of graphite intercalation compounds.
2. Experimental
2.1. Synthesis of graphite–lead composites
The molten salt method was used to produce graphite intercalation compound with lead chloride and iron chloride. According to the literature, iron chloride can also be intercalated in graphite using the electrochemical mode or solvent method, but there is no information about an alternative intercalation method for PbCl2 intercalation. Purified flaky graphite (99.98 wt% C, flakes 100 μm in diameter, Sigma-Aldrich) and anhydrous lead chloride (for synthesis, Sigma-Aldrich) with addition of anhydrous iron(III) chloride (min 98%, Riedel-de Haën) were placed in the glass tube reactor. The molar ratio of metal salts to graphite was chosen to be 1![[thin space (1/6-em)]](https://www.rsc.org/images/entities/char_2009.gif) :
:![[thin space (1/6-em)]](https://www.rsc.org/images/entities/char_2009.gif) 6, whereas molar ratio of PbCl2 to FeCl3 was set to 9
6, whereas molar ratio of PbCl2 to FeCl3 was set to 9![[thin space (1/6-em)]](https://www.rsc.org/images/entities/char_2009.gif) :
:![[thin space (1/6-em)]](https://www.rsc.org/images/entities/char_2009.gif) 1, respectively. In the next step, argon was passed through the reactor to remove air, and then the reactor was tightly sealed. The synthesis was carried out at the temperature of 450 °C for 96 h. The intercalation process parameters have been chosen on the basis of our previous studies.35–37 After completing the process, the obtained material was filtered and washed with a dilute HCl solution to remove unreacted salts. Then, the reached material was rinsed with water and stay to dry at ambient temperature. Finally, the synthesized compound was subjected to thermal and chemical treatment in order to modify its morphological and structural properties, in consequence, to change the electrochemical activity of the prepared composites. Thermal modification of the previously obtained graphite based composite was carried out in air atmosphere for 4 min at the temperature of 600 and 800 °C, while the chemical treatment involved a 48 h reaction of obtained compound in a 30% hydrogen peroxide solution.
1, respectively. In the next step, argon was passed through the reactor to remove air, and then the reactor was tightly sealed. The synthesis was carried out at the temperature of 450 °C for 96 h. The intercalation process parameters have been chosen on the basis of our previous studies.35–37 After completing the process, the obtained material was filtered and washed with a dilute HCl solution to remove unreacted salts. Then, the reached material was rinsed with water and stay to dry at ambient temperature. Finally, the synthesized compound was subjected to thermal and chemical treatment in order to modify its morphological and structural properties, in consequence, to change the electrochemical activity of the prepared composites. Thermal modification of the previously obtained graphite based composite was carried out in air atmosphere for 4 min at the temperature of 600 and 800 °C, while the chemical treatment involved a 48 h reaction of obtained compound in a 30% hydrogen peroxide solution.
2.2. Material characterizations
The crystalline structure of as prepared composite materials was analyzed using the X-ray diffraction (XRD) method (Philips PW-1710 diffractometer). A scanning electron microscope (SEM) (Hitachi S-3400N) equipped with an energy dispersive spectroscopy (EDS) detector was used to determine the morphology and the surface chemical composition of the tested materials. The mass loss caused by thermal treatment has been examined using thermogravimetric (TG) analysis (SETARAM Setsys 12).2.3. Electrochemical measurements
All of electrochemical investigations were carried out at ambient temperature using a potentiostat–galvanostat PGSTAT30 AutoLab (EcoChemie B.V.). To examine the electrochemical activity of the obtained composites, the cyclic voltammetry (CV) and galvanostatic methods were applied. The preparation process and construction of the powder type working electrode were as follows. First, a graphite rod (3 mm in diameter) acting as a current collector was placed in a porous polymer pocket (5 mm in diameter). Then, the examined material was poured in and lightly pressed with a polymer fabric to avoid washing out the electrode material. All measurements were carried out in a three-electrode cell filled with 1 M H2SO4 solution. A mercury/mercurous sulfate electrode (Hg/Hg2SO4/1 M H2SO4) was used as a reference electrode and graphite rod was playing a role of counter electrode. Cyclic voltammetry (CV) measurements were conducted in different potentials ranges with a scan rates of 1 and 10 mV s−1. After starting the measurement from the rest potential of the electrode, the potential was scanned towards negative potentials. Current densities of 30 mA g−1 (cathodic) and 10 mA g−1 (anodic) were used to perform galvanostatic measurements.3. Results and discussion
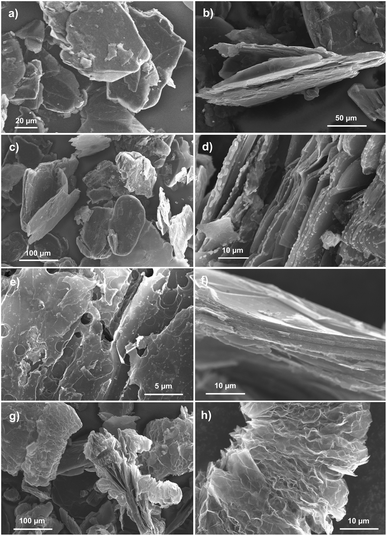
SEM images depicting the morphology of the obtained graphite–PbCl2 composite as well as products of its thermal and chemical treatment are shown in Fig. 1. As can be seen from Fig. 1a and b, the examined composite material consists of graphite flakes with a rough and cracked surfaces, without the possibility of distinguishing lead chloride particles. Therefore, at first sight, it can be concluded that synthesised material does not contain a lead. However, the situation completely changes in case of material subjected to heat treatment at 600 °C (Fig. 1c and d).Graphite flakes of thermally modified compound are covered by spherical particles of lead chloride and/or oxide with diameters varying from hundreds of nanometers to several micrometers. The described particles are mostly located at the edges of the graphite flakes (Fig. 1d). After increasing the temperature of heat treatment to 800 °C, in turn, only graphite flakes are visible on SEM images (Fig. 1e and f). The surface of the flakes is much more damaged with lack of even a trace amount of Pb particles. Finally, Fig. 1g and h show morphology of the composite material affected by chemical modification that was carried out in 30% hydrogen peroxide solution. Firstly, as in the case of heat treatment at 800 °C, neither PbCl2 nor PbO particles can be distinguished in the presented images. Secondly, it can be noticed that some of the graphite flakes undergo significant morphological changes by their multiple splitting and wrinkling of graphene layers. This led to a tremendous increase in the volume of the flakes along the crystallographic axis c. The described process is called exfoliation and takes place when some atoms, ions or molecules being previously incorporated-intercalated between the graphene layers undergo thermal, chemical or electrochemical decomposition resulting in formation of gaseous products. These gases are accumulated within the graphite structure until the point when the limit pressure is exceeded causing their rapid ejection accompanied by the creation of morphological changes.38,39 The occurrence of exfoliation process constitutes evidence that during the preparation process of graphite–lead chloride composite, the intercalation of PbCl2 and possibly FeCl3 takes place. At this point, it is important to explain the role of iron(III) chloride in entire process of composite formation. It is well known that this salt easily undergoes intercalation into the graphitic materials by various chemical (molten salt) or electrochemical methods. Moreover, it is proven that FeCl3 can be used as a catalyst enabling the intercalation of other molecules, also undergoing co-intercalation itself.40 Taking into account the above mentioned observations, the following assumption can be made: during the preparation process of graphite base compound, conducted in the molten salt environment, metal chlorides undergo intercalation into the structure of graphite flakes. This explain why no particles of PbCl2 are visible on the graphite surface. Heat treatment carried out at the temperature of 600 °C causes the melting of intercalated salt particles (lead chloride), which has a much lower melting point than iron chloride, thus allowing their diffusion to the edge areas of the graphite flakes and further to their surface. Raising the temperature to 800 °C leads to evaporation of lead chloride, so no trace of its particles can be found on SEM images (Fig. 1e and f). The mentioned evaporation brings about an additional damage to the graphite flakes of the heated compound. It should be noted that heat treatments carried out at temperatures of 600 and 800 °C are accompanied by significant sample loss, reaching 2 and 50%, respectively. Although chemical treatment leads to exfoliation of compound flakes, it probably also contributes to the leaching of the lead-based intercalate according to eqn (1)), so no particles can be seen in the SEM images (Fig. 1g and h).
| GIC–PbCl2 + H2O2 → GIC–O + PbCl2 + H2O | (1) |
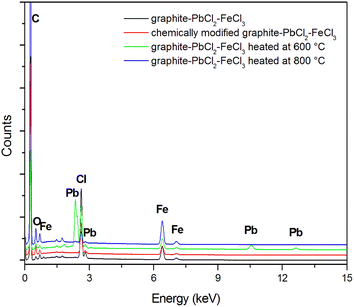
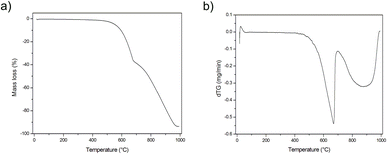
The above mentioned suppositions are in accordance with the EDS (Fig. 2, Table 1) and TG (Fig. 3) results. EDS analysis indicates that the obtained graphite–PbCl2–FeCl3 composite does not contain lead chloride on the surface of graphite flakes, but trace amounts of iron chloride were detected. This fact suggests that all PbCl2 applied in the preparation process was either intercalated into the graphite interlayer spaces or washed out during the purification process. In the case of material heat treated at 600 °C, the presence of lead compounds (chlorides and/or oxides) on the graphite surface was confirmed. An increment in temperature to 800 °C results in the complete removal/evaporation of lead compounds from the surface of the tested material. The above statement is confirmed by the thermogravimetry (TG) and difference thermogravimetry (dTG) diagrams (Fig. 3), which show that the decomposition of the examined material begins at the temperature of around 500 °C. In the first stage, the observed loss of sample weight may be related to the transformation of metal chlorides into their oxide form, which illustrates a significant increase in O to Cl ratio (EDS results) (Table 1). At the temperature of 700 °C, the second stage of thermal decomposition occurs, which is most likely attributable to the evaporation of lead chloride/oxide. This phase leads to a more significant weight loss of the heat treated composite. It should be emphasized that the degradation process of graphite flakes may be also responsible for the decrease in mass of the examined material (Fig. 1f).
| C | O | Cl | Pb | Fe | |
|---|---|---|---|---|---|
| Graphite–PbCl2–FeCl3 | 92.53 | 3.27 | 2.87 | 0.00 | 1.33 |
| Graphite–PbCl2–FeCl3 heated at 600 °C | 85.43 | 7.18 | 3.97 | 1.76 | 1.66 |
| Graphite–PbCl2–FeCl3 heated at 800 °C | 87.17 | 10.85 | 0.33 | 0.00 | 1.65 |
| Chemically modified graphite–PbCl2–FeCl3 | 86.23 | 11.11 | 1.58 | 0.00 | 1.08 |
In case of composite subjected to chemical modification in 30% hydrogen peroxide, the gained EDS data do not indicate the presence of Pb on its surface. Such a behaviour suggests that during the 48 hour chemical process, the entire lead was washed out from the graphite matrix.
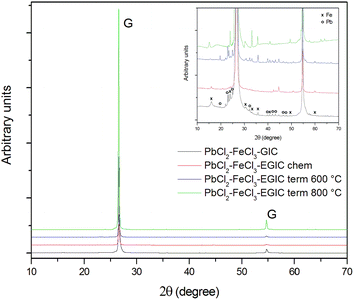
XRD patterns for all investigated composite materials are shown in Fig. 4.
As can be seen in the main figure, the XRD patterns mainly involve signals related to the structure of crystalline graphite. The highest intensities of the graphitic peak was recorded for the thermally exfoliated graphite intercalation compound (EGIC) at 800 °C, while the lowest peaks are noted for EGIC gained from chemical and thermal at 600 °C treatment. The highest degree of structural order of graphite crystal lattice is observed for the compound modified at 800 °C. The mentioned effect arises from the fact that almost entire removal of PbCl2 intercalate from graphite matrix occurs without accompaniment of structural changes. In contrast, the low crystallinity of sample subjected to heat treatment at 600 °C is due to the presence of a part of intercalate molecules between the graphene sheets. From SEM analysis it is known that chemical modification carried out in a 30% hydrogen peroxide solution leads to PbCl2 removal and oxidation of iron chloride. The mentioned process are accompanied by a significant structural changes within the examined material, and in consequence, the decrease in crystallinity of graphitic structure. The inset in Fig. 4 highlights the signals associated with lead and iron intercalates. Peaks related to Pb can be distinguished in the patterns recorded for the originally obtained compound as well as for the product formed during its thermal modification at 600 °C.41,42 It means that chemical modification in H2O2 as well as heat treatment at 800 °C result in almost complete removal of lead from the investigated compounds. Contrary to the EDS surface analysis, XRD measurements revealed the presence of Pb within the originally obtained compound. This can be attributed to the fact that the depth of XRD analysis by radiation beam is bigger as compared to the EDS analysis. Stronger or weaker signals corresponding to the presence of iron chloride/oxide are visible on all spectra presented.43,44 It should be emphasized that the described XRD results are consistent with SEM and EDS analysis.
Electrochemical properties of all prepared composites were tested by cyclic voltammetry and galvanostatic methods. Fig. 5 shows voltammetric curves recorded in 1 M H2SO4 water solution in the potential range from −1.9 to 0.2 V with a scan rate of 10 mV s−1. During the cathodic polarization, a current peak related with the reduction of Pb2+ to Pb0 in original compound emerges in the potential range from −0.95 to −1.45 V (black line). Further lowering of the potential causes an increase in the cathode current density as a result of the hydrogen evolution reaction. After reversal the polarization direction, the oxidation of metallic lead to Pb2+ occurs which is illustrated by the anode peak with maximum at the potential of −0.75 V.45,46 After reaching the potential of −0.08 V, an anodic peak depicting oxidation of Fe2+ to Fe3+ is observed. After changing the direction of back to cathodic, the reverse reaction (reduction of Fe3+ to Fe2+) spreads within the potential range from 0.1 to −0.1 V47,48 An appearance of signals arising from for both components (lead and iron) indicates that both metals are present within the matrix of the examined compound.
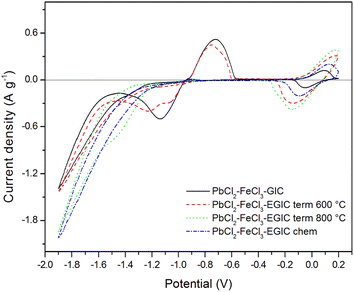 | ||
| Fig. 5 Cyclic voltammetry curves recorded for the examined composites in 1 M H2SO4 water solution in the potential range from −1.9 V to 0.2 V. Scan rate 10 mV s−1. | ||
Similar character exhibits voltammetric curve noted for GIC–PbCl2–FeCl3 beforehand underwent heat treatment at 600 °C (Fig. 5, red line). In this case, cathodic peak associated with Pb2+ reduction involves two current maxima, which suggests some changes in the reaction mechanism caused by heat treatment. Additionally, current densities related with the redox reaction of Pb are slightly lower in comparison with the signals noted for unmodified compound. In contrast, the peaks associated with the oxidation/reduction of iron are almost three times higher, which means that heat treatment has much stronger impact on iron rather than lead component. After increasing the temperature of the modification process from 600 °C to 800 °C, the Pb oxidation/reduction peaks completely disappear, while the intensity of the redox signals for iron further increases (Fig. 5, green line). The above described behaviour is consistent with the results of SEM, EDS and XRD analyses proving that thermal modification carried out at 800 °C leads to the evaporation of lead from the graphite matrix and at the same time the activity of the iron catalyst increases. It should be also emphasized that the electroactivity of the heat treated compound in the hydrogen evolution reaction increases significantly after heat treatment at 800 °C accompanied by the removal of Pb. Similar effect has been achieved for compound subjected to chemical treatment in 30% hydrogen peroxide solution (Fig. 5, blue line). The main difference is associated with over twice lower current densities for Fe reactions in comparison to the material heat treated at 800 °C. For better separation of cathodic peaks depicting reactions of Pb2+ reduction and hydrogen evolution, CV measurements were recorded at a lower scanning rate (1 mV s−1) in a potential range from −1.3 to 0.2 V. The recorded voltammetric curves for all examined materials are shown in Fig. 6. From the comparison of curves recorded for original compound and that heat treated at 600 °C, it can be noticed that for both electrode materials the reduction of Pb2+ occurs according to two step reaction, which is illustrated by two partially overlapped peaks. However, the participation of individual signals differs for each material. The total charges calculated for the mentioned reduction peaks and the corresponding anodic signals equal 30.68 C g−1 and 17.80 C g−1 for the original compound and 24.82 C g−1and 14.20 C g−1 for heat-treated compound. The above calculations show that the reversibility of the Pb ↔ Pb2+ reaction is at the same level for both examined materials and amounts to 58% and 57%, respectively, for original and heat treated compound. As in the case of a higher scanning rate of 10 mV s−1 (Fig. 5), voltammetric curves recorded for compounds subjected to thermal and chemical modification at 800 °C do not involve current signals related to the lead catalyst (Fig. 6, green and blue lines).
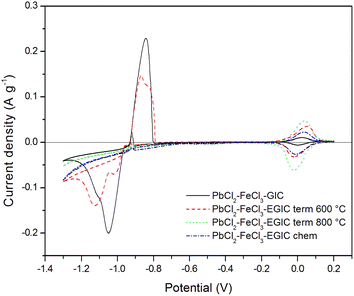 | ||
| Fig. 6 Cyclic voltammetry curves recorded for the examined composites in 1 M H2SO4 water solution in the potential range from −1.3 V to 0.2 V. Scan rate 1 mV s−1. | ||
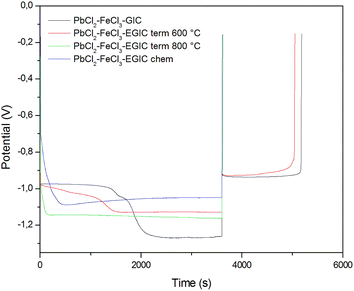
In the last stage of the conducted researches, galvanostatic measurements were carried out. During these investigations, the examined electrodes were firstly subjected to cathodic reduction by passing a constant current with a density of 30 mA g−1 for 3600 s, and then oxidized with an anode current with a density of 10 mA g−1. The cut-off potential was set to −0.15 V. As can be seen from Fig. 7, the forced cathode current causes different changes in the measured potential values depending on the type of electrode investigated. In case of materials without a lead catalyst (those modified at 800 °C and hydrogen peroxide), an approximately constant level of cathodic potential was obtained. The lower values of the potential noted for a chemically modified material are related with its more developed surface, which was proved by SEM analysis. For both materials described above, changing the current from cathodic to anodic causes a rapid increase in potential up to the cut-off value, which is due to the lack of Pb content in the examined electrode material. Completely different behaviour is observed for electrodes made of original compound and the composite thermally treated at 600 °C (Fig. 7, black and red lines). During the cathodic process, two plateaus can be distinguished on the recorded curves. The first plateau depicts the reduction of Pb2+ to Pb0, whereas within the second one, the evolution of hydrogen occurs. After reversing the polarization from cathodic to the anodic one, a constant potential value of −0.9 V is achieved, which is associated with Pb oxidation. It should be emphasized that, similar to CV measurements, the charge associated with the reversible transformation of Pb to Pb2+ is very close for both materials and amounts to 15.72 C g−1 and 14.62 C g−1 for the original and heat-treated compound, respectively. The lower values of the potential for GIC heated at 600 °C recorded upon cathodic treatment may result from the lower conductivity of the examined material caused by the oxidation of iron and lead chlorides to their oxides.
4. Conclusions
The molten salt method was successfully used to produce graphite–PbCl2–FeCl3 composite. SEM analysis showed that the obtained compound consists of graphite flakes mainly covered with iron chloride particles. Moreover, by analyzing the influence of heat and chemical treatment on the morphology of the obtained compound, it was found that lead chloride particles are located between the graphene layers of the composite graphite matrix, thanks to which the obtained material can be considered as a graphite intercalation compound. Based on SEM images, it can be also concluded that chemical treatment carried out in 30% hydrogen peroxide leads to significant changes within the morphology of examined material, which is manifested by multiple splitting and wrinkling of graphene layers. This behaviour contributes to a huge increase in volume of the flakes along the crystallographic axis c. Ultimately, SEM images have revealed that in consequence of heat treatment carried out at the temperature of 600 °C, Pb particles with diameters varying from hundreds of nanometers to several micrometers move from the interlayer spaces of graphite flakes to their edge areas. A similar effect is achieved after chemical modification which was performed in 30% hydrogen peroxide solution. Electrochemical investigations curried out by cyclic voltammetry method revealed that the previously obtained compound and the product of its thermal modification at 600 °C exhibit electrochemical activity related with the lead and iron catalysts. Current peaks associated with the Pb component have a similar charge for both materials. On the other hand, materials subjected to heat treatment at 800 °C and chemical reaction with H2O2 do not exhibit electrochemical activity, which is typical observed for lead. Finally, the mentioned findings concerned electrochemical activity of the as prepared materials have been confirmed by galvanostatic measurements. Charge associated with the reversible transformation of Pb to Pb2+ amounts to 15.72 C g−1 and 14.62 C g−1 for the original and heated at 600 °C compound, respectively.Summarizing, it can be concluded it is possible to obtain a composite material exhibiting an electrochemical activity associated with a lead catalyst, which enables its practical application in selected electrochemical processes. However, further researches should be conducted to develop a method of modification that allows for increasing the specific surface area of the examined compound by multiple splitting and wrinkling of graphene layers without simultaneous removal of lead from the modified material.
Author contributions
T. Rozmanowski: conceptualization, investigation, methodology, visualization, supervision, writing – original draft, writing – review & editing, funding acquisition, project administration. P. Krawczyk: supervision, writing – review & editing, funding-acquisition, project administration.Conflicts of interest
There are no conflicts to declare.Acknowledgements
This work was supported by National Science Centre of Poland research grant no. 2022/06/X/ST5/00906 (T. Rozmanowski) and supported by the Ministry of Education and Science (P. Krawczyk).References
- P. Ruetschi, J. Power Sources, 1977, 2, 3 CrossRef CAS.
- K. R. Bullock, J. Power Sources, 1994, 51, 1 CrossRef CAS.
- P. T. Moseley, D. A. J. Rand and B. Monahov, J. Power Sources, 2012, 219, 75 CrossRef CAS.
- W. Zhang, H. Lin, H. Lu, D. Liu, J. Yin and Z. Lin, J. Mater. Chem. A, 2015, 3, 4399 RSC.
- F. Cheng, J. Liang, Z. Tao and J. Chen, Adv. Mater., 2011, 23, 1695 CrossRef CAS PubMed.
- Y. Zhao, O. Pohl, A. I. Bhatt, G. E. Collis, P. J. Mahon, T. Rüther and A. F. Hollenkamp, Sustainable Chem., 2021, 2, 167 CrossRef CAS.
- P. P. Lopes and V. R. Stamenkovic, Science, 2020, 369, 923 CrossRef CAS PubMed.
- P. T. Moseley, R. F. Nelson and A. F. Hollenkamp, J. Power Sources, 2006, 157, 3 CrossRef CAS.
- O. Jhabli, M. Boutamart, E. M. E. Mouchtari, J. Bouziad, A. Ghadbane, S. Rafqah, Y. Redouany, A. Bouhmad, K. Nouneh, M. Galai, R. Hsissou and S. Briche, J. Energy Storage, 2022, 56, 106019 CrossRef.
- K. Yanamandra, D. Pinisetty and N. Gupta, Renewable Sustainable Energy Rev., 2023, 173, 113078 CrossRef CAS.
- S. W. Swogger, P. Everill, D. P. Dubey and N. Sugumaran, J. Power Sources, 2014, 261, 55 CrossRef CAS.
- N. Sugumaran, P. Everill, S. W. Swogger and D. P. Dubey, J. Power Sources, 2015, 279, 281 CrossRef CAS.
- S. Logeshkumar and R. Manoharan, Electrochim. Acta, 2014, 144, 147 CrossRef CAS.
- X. Zou, Z. Kang, D. Shu, Y. Liao, Y. Gong, Ch. He, J. Hao and Y. Zhong, Electrochim. Acta, 2015, 151, 89 CrossRef CAS.
- L. Zhao, W. Zhou, Y. Shao and D. Wang, RSC Adv., 2014, 4, 44152 RSC.
- P. Tong, R. Zhao, R. Zhang, F. Yi, G. Shi, A. Li and H. Chen, J. Power Sources, 2015, 286, 91 CrossRef CAS.
- M. S. Morán, N. B. David, R. N. de Faria Junior, J. S. Marcuzzo and A. Cuńa, MRS Adv., 2024 DOI:10.1557/s43580-023-00735-7.
- M. Fernandez, J. Valenciano, F. Trinidad and N. Munoz, J. Power Sources, 2010, 195, 4458 CrossRef CAS.
- M. Saravanan, M. Ganesan and S. Ambalavanan, J. Electrochem. Soc., 2012, 159, 452 CrossRef.
- V. Mahajan, R. S. Bharj and J. Bharj, Bull. Mater. Sci., 2019, 42, 21 CrossRef.
- D. Pavlov, P. Nikolov and T. Rogachev, J. Power Sources, 2011, 196, 5155 CrossRef CAS.
- J. Gu, J. Zhong, K. Zhu, X. Wang and S. Wang, J. Energy Storage, 2021, 33, 102082 CrossRef.
- H. Yang, Y. Qiu and X. Guo, Electrochim. Acta, 2017, 235, 409 CrossRef CAS.
- J. Yin, N. Lin, Z. Lin, W. Yue, C. Chen, J. Shi, J. Bao, H. Lin, F. Hua and W. Zhang, Energy, 2019, 193, 116675 CrossRef.
- Z. Lin, N. Lin, H. Lin and W. Zhang, Electrochim. Acta, 2020, 338, 135868 CrossRef CAS.
- F. J. Recio, P. Herrasti, I. Sirés, A. N. Kulak, D. V. Bavykin, C. Ponce-de-León and F. C. Walsh, Electrochim. Acta, 2011, 56, 5158 CrossRef CAS.
- J. Feng, Q. Tao, H. Lan, Y. Xia and Q. Dai, Chemosphere, 2022, 286, 131610 CrossRef CAS PubMed.
- B. G. Savić, D. M. Stanković, S. M. Živković, M. R. Ognjanović, G. S. Tasić, I. J. Mihajlović and T. P. Brdarić, Appl. Surf. Sci., 2020, 529, 147120 CrossRef.
- P. Du, C. Yuan, X. Cui, K. Zhang, Y. Yu, X. Ren, X. Zhan and S. Gao, J. Mater. Chem. A, 2022, 10(15), 8424 RSC.
- A. Rahmani, M. Leili, A. Seid-mohammadi, A. Shabanloo, A. Ansari, D. Nematollahi and S. Alizadeh, J. Cleaner Prod., 2021, 322, 129094 CrossRef CAS.
- X. Wang, Y. Xie, G. Yang, J. Hao, J. Ma and P. Ning, Front. Environ. Sci. Eng., 2020, 14, 22 CrossRef CAS.
- Z. Ma, X. Chen, H. Wu, Y. Xiao and Ch. Feng, Ionics, 2020, 26, 5343 CrossRef CAS.
- Q. Li, Ch. Xu, L. Yang, K. Pei, Y. Zhao, X. Liu and R. Che, ACS Appl. Energy Mater., 2020, 3, 7416 CrossRef CAS.
- J. A. Weeks, M. J. Zuiker, H. S. Srinivasan, H. H. Sun, J. N. Burrow, P. Beccar, A. Heller and C. B. Mullins, J. Electrochem. Soc., 2020, 167, 060509 CrossRef CAS.
- T. Rozmanowski and P. Krawczyk, Electrochim. Acta, 2016, 205, 266 CrossRef CAS.
- T. Rozmanowski and P. Krawczyk, Appl. Catal., B, 2018, 224, 53 CrossRef CAS.
- T. Rozmanowski and P. Krawczyk, Electrochim. Acta, 2019, 267, 102 Search PubMed.
- M. S. Dresselhaus and G. Dresselhaus, Adv. Phys., 2002, 51, 1 CrossRef CAS.
- J. M. Skowronski, P. Krawczyk, T. Rozmanowski and J. Urbaniak, Energy Convers. Manage., 2008, 49, 2440 CrossRef CAS.
- T. Rozmanowski and P. Krawczyk, Electrochim. Acta, 2016, 205, 266 CrossRef CAS.
- C. Muthuselvi, T. Anbuselvi and S. Pandiarajan, Review of Research, 2016, 5, 1 Search PubMed.
- S. Ngqoloda, Ch. J. Arendse, T. F. Muller, S. S. Magubane and C. J. Oliphant, Coatings, 2020, 10, 1208 CrossRef CAS.
- S. M. Nasef, N. A. Badawy, F. H. Kamal, S. F. Sherbiny and E. M. El-Nesr, Arab J. Nucl. Sci. Appl., 2019, 52, 209 Search PubMed.
- E. Uzun, Int. J. Mater. Eng. Technol., 2019, 2, 1 Search PubMed.
- W. Zhang, H. Lin, H. Lu, D. Liu, J. Yin and Z. Lin, J. Mater. Chem. A, 2015, 3, 4399 RSC.
- F. Yang, H. Zhou, J. Hu, S. Ji, C. Lai, H. Wang, J. Sun and L. Lei, J. Energy Storage, 2022, 49, 104112 CrossRef.
- K. L. Hawthorne, J. S. Wainright and R. F. Savinell, J. Electrochem. Soc., 2014, 161, A1662 CrossRef CAS.
- D. M. Kabtamu, G. Y. Lin, Y. Ch. Chang, H. Y. Chen, H. Ch. Huang, N. Y. Hsu, Y. S. Chou, H. J. Wei and Ch. H. Wang, RSC Adv., 2018, 8, 8537 RSC.
| This journal is © The Royal Society of Chemistry 2024 |

