 Open Access Article
Molecular dynamics simulation on the displacement behaviour of crude oil by CO2/CH4 mixtures on a silica surface†
Ping Feng *abc,
Yangwen Zhuabd,
Keling Zhaoc,
Ying Gaoc,
Haiying Liaoabd,
Quanqi Daiabd,
Yongqiang Tangabd,
Kezhen Goue and
Xueshuai Zhuc
aState Key Laboratory of Shale Oil and Gas Enrichment Mechanisms and Effective Development, Beijing, 102206, China. E-mail: feng.ping@outlook.com
bSINOPEC Key Laboratory of Carbon Capture, Utilization and Storage, Beijing, 102206, China
cSchool of Chemical and Environmental Engineering, China University of Mining and Technology (Beijing), Beijing, 100083, China
dPetroleum Exploration and Development Research Institute, SINOPEC, Beijing 102206, China
eYibin Tianyuan Science-Technology and Design Company Limited, Yibin, Sichuan 644000, China
First published on 21st February 2024
Abstract
Produced gas re-injection is an effective and eco-friendly approach for enhancing oil recovery from shale oil reservoirs. However, the interactions between different gas phase components, and the oil phase and rocks are still unclear during the re-injection process. This study aims to investigate the potential of produced gas re-injection, particularly focusing on the effects of methane (CH4) content in the produced gas on shale oil displacement. Molecular dynamics simulations were employed to analyze the interactions between gas, oil, and matrix phases with different CH4 proportions (0%, 25%, 50%, and 100%), alkanes and under various burial depth. Results show that a 25% CH4 content in the produced gas achieves almost the same displacement effect as pure carbon dioxide (CO2) injection. However, when the CH4 content increases to 50% and 100%, the interaction between gas and quartz becomes insufficient to effectively isolate oil from quartz, causing only expansion and slight dispersion. Interestingly, the presence of CH4 has a synergistic effect on CO2, facilitating the diffusion of CO2 into the oil film. During the gas stripping process, CO2 is the main factor separating oil from quartz, while CH4 mainly contributes to oil expansion. In addition, for crude oil containing a large amount of light alkanes, extracting light components through mixed gas may be more effective than pure CO2. This study offers valuable insights for applications of produced gas re-injection to promote shale oil recovery.
1. Introduction
Unconventional oil and gas have been given more attention, especially the “shale oil and gas revolution” in North America, which has triggered a global shale oil and gas exploration and production boom.1–3 The worldwide technically recoverable reserves of shale oil amount to 4.69 × 10¹⁰ tons. Russia, the U.S., and China are abundant in shale oil with recoverable resources of 1.05 × 10¹⁰ tons, 6.72 × 10⁹ tons, and 4.48 × 10⁹ tons, respectively.4 Nonetheless, oil-bearing shale reservoirs are characterized by low porosity and permeability, thereby limiting the application of conventional oil recovery techniques.4,5 As a result, various methods of enhanced oil recovery (EOR) have been proposed, including hydraulic fracturing, thermal recovery, chemical enhanced oil recovery, microbial enhanced oil recovery, and gas flooding.6–9 Gases such as CO2, natural gas, and nitrogen, with their high efficiency in enhanced recovery and unique advantage of low cost, have become the current trend in the development of EOR in shale reservoirs. CO2 exists as supercritical fluid (scCO2) under practical reservoir conditions, has superior diffusivity and solubility, and can easily penetrate shale reservoirs and dissolve crude oil.10,11 CO2 sequestration in oil-bearing shale reservoirs could enhance shale oil recovery and meanwhile realize CO2 geological sequestration.12–14The adsorption and diffusion characteristics of CO2/CH4 mixtures on shale matrix have been investigated through experiments and simulations in gas flooding. The preferential adsorption of shale matrix for CO2/CH4 mixture varied significantly with temperature, pressure, and the properties of shale matrix.16 The ability of shale matrix to preferentially adsorb CO2 weakened as the pressure increases, while the high temperature reduced the preferential selectivity of CO2 adsorption under low pressure.17 The adsorption of CO2/CH4 gas mixture was mainly contributed by CO2.15 Simulations showed that CO2 was more easily adsorbed on kerogen matrix compared to CH4, and the selectivity for CO2 decreased as the temperature rose.18,19 Moreover, the wettability of organic nanoscale pores increased with the increase of CO2 mole fraction in CO2/CH4 mixture.20 The interfacial tension between CO2/CH4 mixture increased as the CH4 content rose.21 These researches mainly focus on the interaction between CO2/CH4 and shale matrix, while there are limited reports on influence of the shale oil on both gas and shale matrix.
Extensive researches have been conducted on improving oil recovery through gas flooding, mainly concentrating on the influence of the compositions of fluids and shale matrix on recovery rate.22 The addition of DME could reduce the oil viscosity and effectively increase the recovery rate of shale oil.23 The simulation of DME-assisted CO2 flooding for shale oil showed that DME could enhance the solubility of CO2, improve its competitive adsorption capacity, and effectively reduce interfacial tension.24 The adsorption and diffusion process of reservoir fluids on matrix was also influenced by inorganic minerals and organic matter25 and micropores.26 The desorption of fluids from organic matter and large-pore inorganic minerals after CO2 injection was much more significant than that from small-pore inorganic minerals. The aforementioned experimental and simulation studies mostly focus on the effects of reservoir properties and displacement parameters on CO2 enhanced shale oil recovery (CO2-ESOR). However, there is a lack of research on the effects of CO2 mixed with hydrocarbons on improving oil recovery.
As for CO2-ESOR, the produced fluid always contains oil and produced gas. The composition of the produced gas mainly includes CO2, as well as hydrocarbons (mainly including CH4) and other mixed gases dissolved in the crude oil.27 In terms of utilizing the produced gas, reinjecting the produced gas as a driving agent back into the oil and gas reservoirs gains popularity,28 due to reducing resource waste and mitigating environmental pollution.29,30 During the gas flooding process, the most dominant factor is the interaction mechanism between gas, oil and the reservoir matrix. However, the combined effect of scCO2 and CH4 during gas flooding process has not been well studied yet. In addition, factors such as burial depth and alkane carbon chain length play a crucial role in enhancing the recovery rate during gas flooding process.25,31–33 Therefore, investigating the displacement of CO2/CH4 mixtures, burial depth, and crude oil properties on gas flooding process could provide valuable insights for optimizing injection parameters and select gas injection schemes for improved recovery.
This study aims to reveal the displacement mechanism of CO2/CH4 binary mixture toward shale oil through molecular dynamics simulations. A series of molecular dynamics simulations were conducted under the CH4 proportions of 0%, 25%, 50%, and 100% and also at various burial depths with different alkane carbon chain lengths. The interactions between gas phase, oil phase, and matrix were analysed. The interaction energies and diffusion coefficients were calculated between the components in each system. In response to variations in crude oil compositions, an analysis was conducted on the displacement of flooding gases with different components. The findings of this work may contribute to the development of more efficient gas-phase selection strategies for oil displacement and oil film separation processes. It may also benefit the development of more efficient and environmentally friendly methods for oil and gas production.
2. Computational details
2.1. Construction of simulation model
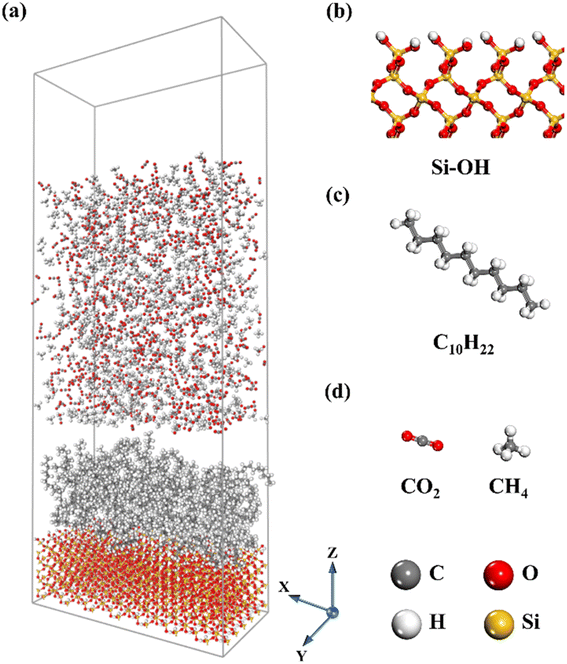
A molecular dynamics system composed of silicon dioxide (SiO2), C10H22, CO2, and CH4 molecules with the z-axis being perpendicular to the silica surface was adopted (Fig. 1). The α-quartz crystal cell model was imported from the Material Studio software (MS) database and α-quartz was cut along the (0 0 1) crystal plane. A hydroxylated silica surface was constructed to simulate the underground caprock considering the water environment in reservoir and the surface charges.34,35 The hydroxylated SiO2 were with dimensions of 59.5 × 29.5 × 17.0 Å3. Decane was used to represent shale oil, and the size of the oil film was about 59.5 × 29.5 × 20.0 Å3. The produced gas, that is CO2, CH4 or their mixtures, is used for shale oil extraction during gas flooding at 323 K and 15 MPa at first. A hidden layer of CO2 molecules with a density of 1.5 g cm−3 was placed above the gas phase to seal the lattice system and prevent gas molecules escaping from the system.36 To eliminate the influence of the periodic boundary in the Z direction of the system, a vacuum layer with a thickness of 18 Å was added to the top layer of the system.2.2. Simulation methods
All molecular dynamics simulations were conducted using MS software. At the beginning of simulation, geometric optimization was carried out using smart method for quartz surface, oil box, and gas phase box, respectively. Accordingly, the oil molecules were randomly placed on the silica surface, and a 1 ns NVT (constant atom number, constant volume, constant temperature) dynamic simulation was conducted to obtain the adsorption configuration of the oil molecules on the quartz surface. Afterwards, the gas phase was placed above the oil layer and a 4000 ps simulation was conducted under the NVT ensemble. The simulation time step was set to 1 fs, and frames were output every 1 ps for analysis. The cutoff distance is set to 12.5 Å. The system temperature was controlled by the Nose–Hoover thermostat. The COMPASS force field is widely used based on ab initio and experimental data optimization.37 It can accurately predict the intramolecular properties of isolated molecules and the intermolecular properties of condensed phase molecules. The COMPASS force field has been widely applied to study the interactions between CO2/CH4/hydrocarbons/quartz/organic matter systems.16,38 The electrostatic interactions were calculated using the Ewald summation method, while the van der Waals interactions were represented by the Lennard-Jones 9–6 potential function which are expressed by eqn (1) and (2), respectively.
 | (1) |
 | (2) |
| Substance | Atom | Charge/e |
|---|---|---|
| Methane | H | −0.212 |
| C | −0.053 | |
| Carbon dioxide | O | +0.8 |
| C | −0.4 | |
| Alkanes | C(CH3) | −0.159 |
| C(CH2) | −0.106 | |
| H | +0.053 | |
| Quartz | Si | +0.89 |
| O | −0.445 | |
| H | +0.25 |
3. Results and discussion
3.1. Effect of CH4 content in produced gas on displacement of crude oil
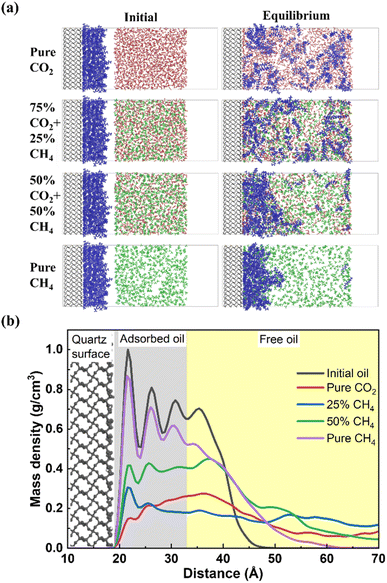
Both the initial and equilibrium states of crude oil stripping by CO2, CH4 and CO2/CH4 mixture are shown in Fig. 2a. In the initial state, the decane molecules are adsorbed on the quartz surface, forming a dense oil film. In equilibrium state, with the absence of CH4 in the produced gas, as well as at 25% CH4 concentration, the majority of oil molecules on the quartz surface dissolve into the gas phase. Both CO2 and CH4 molecules reach the quartz surface and thereby replace the previously adsorbed oil molecules. When the CH4 concentration reaches 50%, some oil molecules dissolve individually in the gas phase, while the majority remains in close proximity to the quartz surface. The oil layer expands and disperses compared with its initial state. In the case of pure CH4, the oil layer remains predominantly tightly adsorbed on the quartz surface, with only a small fraction of the outermost layer of free oil separating from the dense adsorbed oil layer and diffusing into the gas phase.Fig. 2b illustrates the density distribution of oil along the quartz radial direction under equilibrium conditions for various CH4 concentrations during displacement. Without gas in the system, the density distribution of oil film molecules on the quartz surface forms four distinct peaks, located at 21 Å, 26 Å, 30 Å, and 35 Å, respectively. We suppose that the first three peaks correspond to clearly discernible adsorption layer, while the last peak represents free shale oil, as evidenced by its density close to that of decane in its natural state, that is approximately 0.72 g cm−3.39,40 Upon gas injection, in the case of pure CO2, the peak of the oil layer density curve shifts to the free state region, indicating that the majority of adsorbed oil has converted to the free oil.41 In the presence of CH4 in the gas phase, the highest density peak of the oil layer remains in the adsorbed state region. This is extremely evident in pure CH4 flooding, as the peak value of the adsorption layer experiences only a slight change compared to the initial oil. Under this condition, the introduction of CH4 only leads to a certain degree of expansion of the oil layer, without causing the detachment of the oil molecules from the quartz surface. When CH4 is present in the gas phase, its displacement potential toward oil is inferior to pure CO2.
3.2. Microscopic interaction process of gas and oil layer on quartz surface
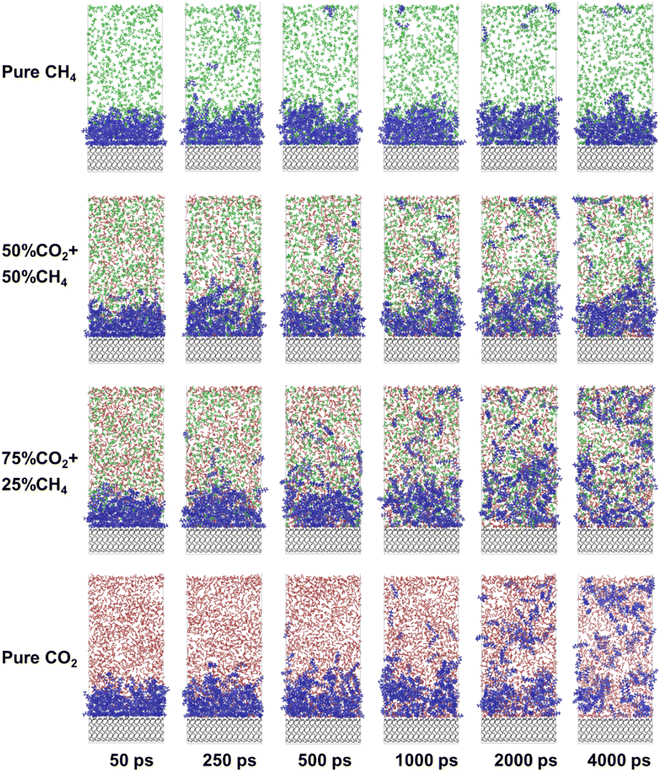
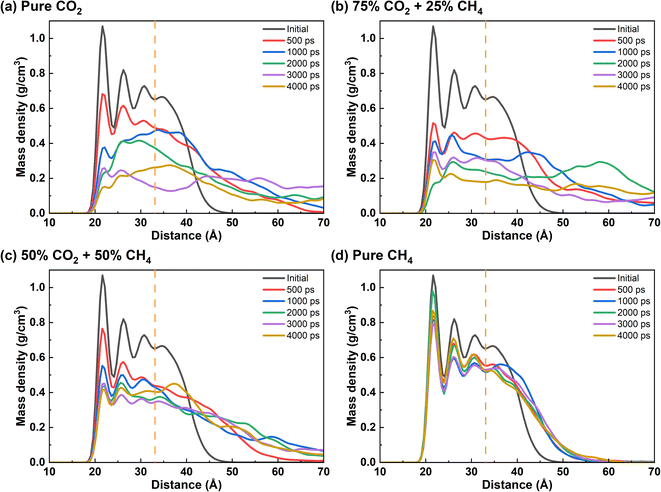
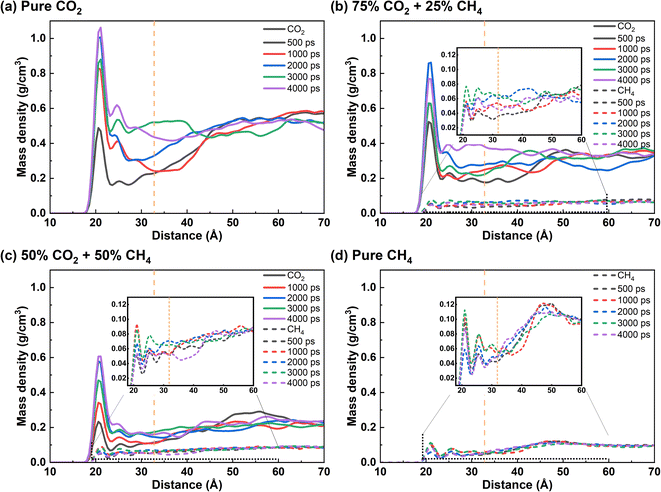
Based on the aforementioned results, the microscopic interaction process of produced gas and crude oil was analyzed (Fig. 3). As for pure CO2 injection, the outermost layer of free oil is initially ruptured by CO2 and dissolved with gas, following which CO2 gradually penetrates through the inner oil layer and diffuses toward the quartz surface. By 2000 ps, even the innermost decane molecules are mostly detached from quartz, but still form clusters near the surface. Almost all oil molecules are dispersed and dissolved by CO2 by 4000 ps, with only a few oil molecules remained near quartz. As CH4 is introduced with molar fraction of 25% in gas phase, more oil molecules are dissolved by the gas phase as single molecules in the first 1000 ps compared to pure CO2 injection. By 4000 ps, almost all of the oil film is dispersed into the gas phase, but some oil molecules still adsorb on the quartz surface. When the CH4 content is 50% or 100%, the proportion of CO2 in the gas phase significantly decreases. The majority of the gas molecules penetrate into the interior of the oil, causing the oil to expand instead of exfoliation from the quartz surface. The oil exhibits minimal detachment from the quartz surface. Therefore, CH4 is capable of inducing swelling of the oil layer. However, compared to CO2, CH4 shows a weaker replacing effect on the oil molecules.In order to quantitatively clarify the microscopic process of the interaction between the produced gas and oil on quartz surface, the density distribution profile of the oil molecules on the surface with time was plotted (Fig. 4). In the case of pure CO2, the density of oil on the quartz surface gradually decreases as CO2 interacts with oil. The increase in oil molecule density in the radial range indicates that the expansion of oil occurs. The adsorbed oil undergoes a transformation into the free oil and dissolves in CO2. The density of oil molecules evenly distributes in the radial range. When the CH4 proportion in the gas phase increased to 25%, within the initial 1000 ps of the reaction, the density of adsorbed oil on the quartz surface decreases more significantly compared to the pure CO2 condition. At 2000 ps, the density peak of oil in the innermost layer disappeared, and a more obvious density peak appears at a radial distance of 25 Å and 58 Å. It suggests that the presence of CH4 under current condition accelerates the expedition of oil and the rapid separation of oil from the quartz surface. It is noteworthy that a small amount of adsorbed oil reappears on the quartz surface when the time of the interaction reaches 4000 ps. This indicates that after the oil detach from the quartz surface, the gas molecules do not continue to form a stable “barrier layer” on the quartz surface to effectively separate the quartz and oil molecules. A small number of decane molecules reattach to the quartz surface due to their strong interaction. When the CH4 content exceeds 50% (Fig. 4c and d), the density distribution of oil still remains in the adsorption region. This observation highlights that, unlike CO2, CH4 is unable to completely displace the oil from the quartz surface, instead inducing a certain degree of expansion within the oil.
To quantify the swelling of decane, the radial distribution functions (RDFs) between carbon atoms of decane molecules (C (dec)) were calculated in different simulation systems (Fig. 5a). The decrease in coordination number indicates that decane molecules tend to separate from each other, leading to an increase in the average separation distance between decane molecules. It is worth noting that in comparison to the pure CO2 system, in the case of 25% CH4, the RDF peak height between carbon atoms of decane molecules decreases, indicating the formation of a more relaxed structure of oil. As shown in Fig. 5b, in a pure CO2 system, decane molecules entangle together and form more clusters than in a 25% CH4 system. This may be due to the diffusion coefficient of CH4 being greater than CO2 (Section 3.3.2), which leads to the diffusion of CH4 into molecular clusters and increases the separation distance between decane. Additionally, in the case of 50% CH4 and pure CH4, the RDF peak values between carbon atoms of decane molecules are significantly higher than the other two systems, suggesting a smaller average molecular distance between decane molecules and that decane molecules are not fully dispersed. Compared to the RDF of decane molecules' carbon atoms in the initial state, the RDF peak value in the pure CH4 system only slightly decreases. It indicates that the CH4 system has only a slight degree of expansion on decane.
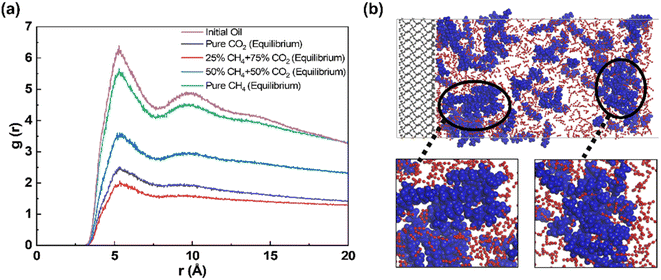 | ||
| Fig. 5 (a) RDF profile of C (dec)–C (dec) at equilibrium state in different systems. (b) Decane clusters in pure CO2 system. | ||
The density distribution of gas molecules on the quartz surface is shown in Fig. 6. In a pure CO2 gas system, the density of CO2 on the quartz surface gradually increases with prolonged contact time, and the molecular density of the oil on the quartz surface decreases simultaneously (Fig. 6a). At 4000 ps, CO2 forms two closely packed adsorption layers on the quartz surface, completely replacing the adsorbed oil. It shows that during this process, CO2 causes expansion of the oil and gradually traverses the oil to contact with the quartz surface, thereby isolating the decane molecules from the quartz surface and achieving the detachment of the oil. Therefore, CO2 plays a dual role in this process, causing oil to expand and separating it from the surface of quartz.42
In a coexisting system of CH4 and CO2, CH4 exhibits similar behaviour to CO2, as it is capable of swelling the oil film and contacting with the quartz surface. However, the distribution density of CH4 on the quartz surface is significantly lower than that of CO2, indicating that the gas molecules adsorbed on the quartz surface are predominantly CO2. Additionally, the mass density of CH4 on the quartz surface did not always increase over time (Fig. 6b and c), suggesting that CH4 is at a disadvantage in competing with CO2 for adsorption on the quartz surface.43,44 In a pure CH4 system, the density of CH4 outside the oil film is significantly higher than that within the oil film. CH4 could penetrate oil and reach the surface of quartz (Fig. 6d). However, due to its inability to form a stable “barrier” on the quartz surface, CH4 cannot effectively displace the oil. On the other hand, CO2 is able to swell the oil film and form a stable density layer on the quartz surface. As a result, CO2 enables the detachment of the oil film.
3.3. Interaction mechanism of gas and oil film on quartz surface
| ECO2–decane = Etotal − (ECO2 + Edecane) | (3) |
Fig. 7 shows the interaction energy between different components in the system when the mole percentage of CH4 is 0%, 25%, 50%, and 100% in the produced gas. ECO2–dencane dominates among all the interactions in the oil displacement process with pure CO2 condition, thereby making CO2 rapidly rupture the oil and diffuse into its interior. Diffusion channels form within the oil film and CO2 moves toward the quartz surface.36,45 After 650 ps, ECO2–surface surpasses Edecane–surface, and the interaction strength between CO2 and quartz surface is greater than that between decane and quartz surface, enabling CO2 to replace oil molecules and form stable adsorption on the quartz surface, resulting in the desorption of the oil.32,36 When CH4 occupies 25% of the gas phase, the Egas–surface remains stronger than the Edecane–surface. Gas molecules have a competitive advantage over oil molecules in adsorbing onto the quartz surface. Therefore, the produced gas can still completely strip the oil from the quartz surface. It is important to note that the presence of CH4 reduces the desorption time of the oil from 650 ps in the pure CO2 system to 500 ps, indicating that the addition of CH4 accelerates the oil displacement process. However, the effectiveness of oil displacement does not necessarily increase with a higher proportion of CH4 in the gas phase. When the CH4 proportion is 50%, Egas–surface becomes comparable to Edecane–surface. Consequently, gas molecules and decane molecules remain in a competitive adsorption state, preventing complete detachment of the oil film. When the gas consists only of CH4, Edecane–surface consistently exceeds Egas–surface, rendering CH4 unable to strip the oil from the quartz surface.
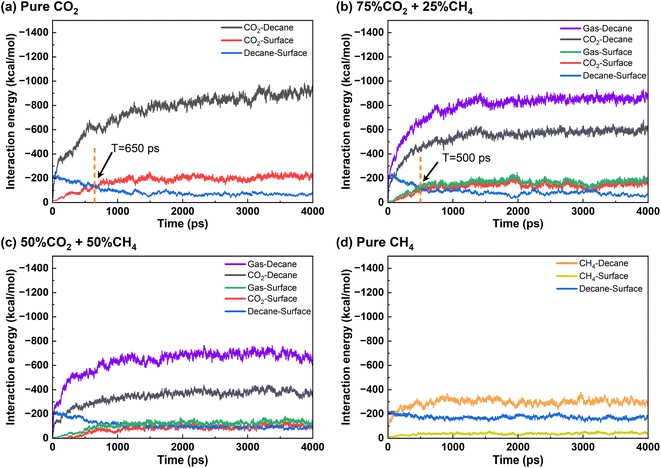 | ||
| Fig. 7 Interaction energy of each component under different gas mixtures: (a) pure CO2, (b) 75% CO2 + 25% CH4, (c) 50% CO2 + 50% CH4, and (d) pure CH4. | ||
Therefore, the oil displacement using CO2/CH4 can be summarized into four stages. Firstly, gas molecules (both CO2 and CH4) diffuse into the oil, causing swelling of the oil.46 Secondly, CO2 mainly adsorbs on the quartz surface, replacing some decane molecules. Then the stable adsorption of CO2 leads to the detachment of the oil from the quartz surface.47 Finally, the oil film disperses and dissolves in the gas phase. It is important to note that each stage is influenced by the composition and properties of the gas molecules, ultimately resulting in different oil displacement effects.
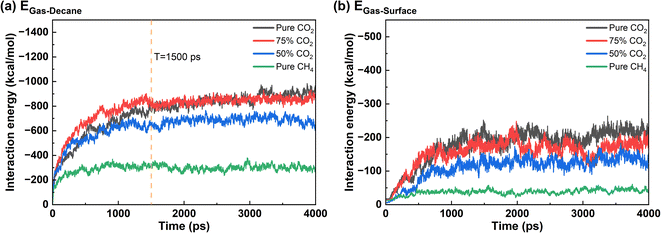
To further elucidate the effect of CH4 introduction on the properties of gas phase, the interaction energy between gaseous components and oil, as well as between gaseous components and the surface were compared in different systems (Fig. 8). In the pure CO2 and the 25% CH4 + 75% CO2 system, Egas–decane is nearly the same, and higher than that in the 50% CO2 + 50% CH4 and 100% CH4 cases. The gas molecules in the former two cases exhibit a stronger swelling effect on the oil layer. Before 1500 ps, the interaction energy between gas molecules and decane is higher in the 25% CH4 + 75% CO2 system, indicating that gas molecules penetrate the oil film more rapidly during this stage, which is consistent with the findings illustrated in Fig. 4 and 5.
 | (4) |
| Condition | Time (ps) | D∥ (decane) (10−8 m2 s−1) | D⊥ (decane) (10−8 m2 s−1) | D∥ (CO2) (10−8 m2 s−1) | D⊥ (CO2) (10−8 m2 s−1) | D∥ (CH4) (10−8 m2 s−1) | D⊥ (CH4) (10−8 m2 s−1) |
|---|---|---|---|---|---|---|---|
| Pure CO2 | 0–1000 | 0.39 | 0.05 | 1.80 | 0.04 | — | — |
| 1000–2000 | 0.41 | 0.07 | 1.66 | 0.14 | — | — | |
| 2000–3000 | 0.44 | 0.15 | 1.65 | 0.13 | — | — | |
| 3000–4000 | 0.86 | 0.23 | 1.78 | 0.13 | — | — | |
| 25% CH4 + 75% CO2 | 0–1000 | 0.41 | 0.15 | 1.78 | 0.02 | 3.28 | 0.02 |
| 1000–2000 | 1.23 | 0.07 | 2.13 | 0.12 | 3.41 | 0.06 | |
| 2000–3000 | 0.86 | 0.18 | 1.68 | 0.13 | 2.63 | 0.11 | |
| 3000–4000 | 0.89 | 0.16 | 1.87 | 0.09 | 3.21 | 0.03 | |
| 50% CH4 + 50% CO2 | 0–1000 | 0.55 | 0.07 | 2.34 | 0.02 | 3.85 | 0.02 |
| 1000–2000 | 0.76 | 0.08 | 1.99 | 0.03 | 3.65 | 0.1 | |
| 2000–3000 | 0.52 | 0.07 | 1.79 | 0.09 | 3.71 | 0.02 | |
| 3000–4000 | 0.70 | 0.06 | 2.08 | 0.09 | 4.03 | 0.04 | |
| Pure CH4 | 0–1000 | 0.33 | 0.03 | — | — | 9.31 | 0.01 |
| 1000–2000 | 0.46 | 0.04 | — | — | 8.40 | 0.01 | |
| 2000–3000 | 0.35 | 0.03 | — | — | 8.04 | 0.04 | |
| 3000–4000 | 0.31 | 0.02 | — | — | 7.82 | 0.01 |
The slope is equivalent to D below.
 | (5) |
The diffusion coefficient can be further divided into D∥, x and y directions paralleling to the quartz surface, and D⊥, z-direction perpendicular to the quartz surface.
 | (6) |
 | (7) |
Before gas injection, at equilibrium, D⊥ of crude oil is 0.07 × 10⁻⁸ m2 s−1, and D∥ is 0.24 × 10⁻⁸ m2 s−1. The D⊥ of decane molecules is significantly higher than D∥, due to the stronger adsorption force from the quartz surface in the direction perpendicular to the surface, resulting in weaker diffusion.49 After gas injection, both D⊥ and D∥ of decane increase significantly under pure CO2 and 25% CH4 conditions, indicating that the addition of the gas improves the fluidity of the oil. In the case of 50% CH4 and pure CH4, D∥ of decane increases, suggesting that the expansion of decane is conducive to its flow in the XY direction, while D⊥ remains almost unchanged, with decane still being subjected to the strong adsorption force from the quartz surface.
Due to the stronger interaction between CO2 molecules and quartz compared to CH4 molecules, the diffusion coefficient of CH4 is greater than that of CO2 which is in agreement with Wang et al.33 As the proportion of CH4 in the produced gas increases, the diffusion coefficients of CO2 and CH4 show a gradual increasing trend. Moreover, in the 25% CH4 + 75% CO2 system, the D⊥ and D∥ of decane between 1000–3000 ps is larger than that in the pure CO2, which is due to the decreased mixed gas density resulting in a larger distance between molecules, enabling faster diffusion of gas molecules and more rapid and pronounced expansion of decane.50,51 This also explains the phenomenon of faster interaction between the oil and gas phases in a mixed gas system during the initial stages of simulation. Although the D∥ of CH4 is larger than that of CO2, CH4 can only diffuse into the oil film to cause expansion, thereby increasing the mobility of the oil phase. It also validates the observation in Fig. 2, in the case of 25% CH4, a greater proportion of oil molecules are present in a monomeric state. Due to the weaker interaction between CH4 and the quartz surface compared to decane, the oil film is able to spread but cannot be fully detached. Despite that the diffusion capacity of CO2 on parallel quartz surfaces is slightly weaker than that of CH4, CO2 can still enhance the fluidity of the oil phase. However, due to the stronger interaction between CO2 and the quartz surface, CO2 exhibits a stronger diffusion capability in the z-direction (perpendicular to the quartz surface). Once the oil film achieves a certain degree of mobility, a higher concentration of CO2 can facilitate the detachment of the oil film from the quartz surface.
3.4. The impact of burial depth on produced gas flooding for oil recovery
Different geological environments exhibit varying pressure and temperature gradients. The influence of different pressure and temperature gradients at different depths of the formation on gas flooding for oil displacement was investigated. Since the mixed gas showed poor displacement on shale oil at a CH4 content of 50%, this condition was chosen to explore whether increasing temperature and pressure would enhance the displacement effect. The surface temperature of the formation was set at 30 °C. There is a significant difference between the formation pressure and atmospheric pressure. Therefore, atmospheric pressure was neglected. The geothermal gradient and pressure gradient were set at 20 K km−1 and 15 MPa km−1, respectively.Regardless of the variation in burial depth, shale oil exhibits two distinct density peaks near the matrix, indicating significant aggregation of aliphatic molecules on the matrix surface (Fig. 9a). The increasing temperature and pressure cannot effectively improve the displacement effect of gas injection. As the depth rises, the density peak of the first adsorption layer of shale oil gradually decreases. With the increase in temperature, the internal energy of the system increases and the molecular kinetic energy increases, making shale oil less likely to be stably adsorbed. However, at a depth of 2 km, the density peak of shale oil on the matrix is significantly higher than at other depths, and the diffusion coefficient also indicates that the fluidity of shale oil is the poorest at 2 km (Fig. 9c). Moreover, the density peaks of CO2 and CH4 near the matrix surface are also the lowest (Fig. 9b). Combining with the ECO2–surface and Edecane–surface, we speculate that at this temperature and pressure, although the adsorption of shale oil is worse compared to shallow depths, the adsorption of gas phase on the matrix surface is also unstable. The difference between Edecane–surface and ECO2–surface is expanded, indicating that the stability of shale oil adsorption is greater than that of gas phase adsorption, resulting in poor desorption of shale oil (Table 3). However, under the pressure of deeper reservoir conditions (>2 km), Edecane–surface significantly decreases, and the instability of shale oil adsorption is greater than that of gas phase adsorption, making shale oil more prone to desorption.
| Time (ps) | Depth (km) | Edecane–surface | ECO2–surface | ECO2–decane | Egas–decane |
|---|---|---|---|---|---|
| 0 | 1 | −191.15 | — | — | — |
| 2 | −188.87 | — | — | — | |
| 3 | −179.64 | — | — | — | |
| 4 | −170.77 | — | — | — | |
| 4000 ps | 1 | −92.00 | −122.35 | −460.05 | −902.77 |
| 2 | −118.32 | −87.61 | −423.61 | −738.63 | |
| 3 | −92.36 | −102.12 | −408.16 | −760.31 | |
| 4 | −79.14 | −74.23 | −412.53 | −761.26 |
3.5. The influence of alkane carbon chain length on produced gas flooding for oil recovery
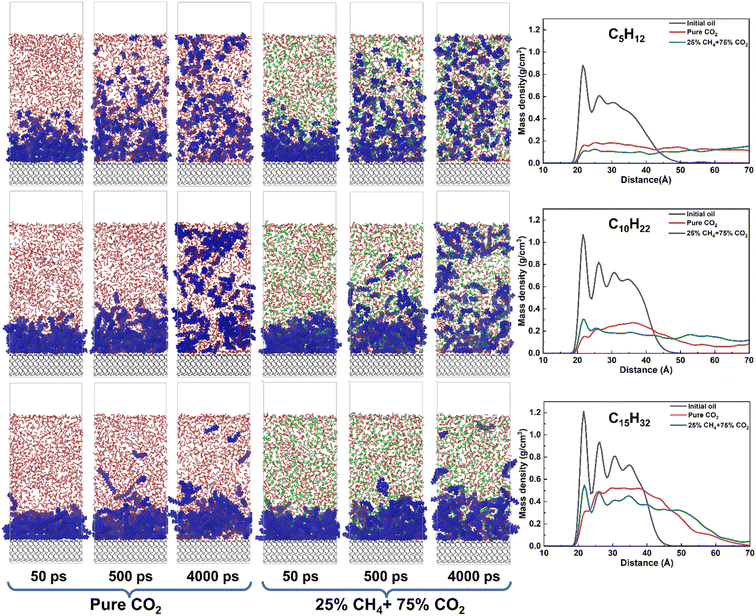
In addition to the proportion of CH4 in the injected gas, the properties of the crude oil are equally important. The influence of oil composition was compared and discussed by comparing the results of the light oil model (C5H12) alkanes with conventional carbon chain length (C10H22) and the heavy oil model (C15H32). As shown in Fig. 10, as the carbon chain length increases, the density of oil accumulation near the matrix surface increases in the pure CO2 system, but the first density peak of oil disappears, indicating that the crude oil is effectively isolated from the matrix surface by CO2. When the proportion of CH4 increased to 25%, the density peak near the matrix for light oil disappeared, similar to the situation with pure CO2. However, for heavy oil, there are still two distinct density peaks near the matrix surface, indicating that the alkane molecules on the matrix surface still have prominent aggregation characteristics and the gas phase cannot effectively displace the crude oil at this stage.To further study the molecular distribution of alkanes, the radial distribution function between alkanes was calculated. Compared to other alkanes, the initial RDF peak of pentane is the lowest, indicating its looser adsorption near the matrix surface. Owing to the diminished dimensions of pentane molecules, intermolecular spaces are expanded, facilitating the swift traversal of CO2 and CH4 through the interstices amidst pentane molecules towards the silica surface. Upon the integration of the gas phase with the alkane molecular system, the dispersibility of the system becomes stronger. The free movement of pentane also strengthens and gradually moves away from the rock wall. Moreover, under the 25% CH4 system, the RDF peak of pentane is slightly higher than that of the pure CO2 system, indicating that the dispersibility of pentane in the 25% CH4 system is stronger (Fig. 11). As the carbon chain length increases, the initial RDF peak of alkanes gradually increases, and the alkane molecules become denser. This is because the aggregation ability of high molecular weight alkanes increases with the increase in carbon number, resulting in a gradual decrease in the gaps between alkane molecules and a weakening ability for the gas phase to pass through them. Especially in the pentadecane system, it tends to aggregate and does not mix with the gas phase. Among the three alkane systems, the RDF peaks under the 25% CH4 phase system are lower than those under the pure CO2 system, further confirming that the presence of CH4 causes a greater expansion of alkanes. In addition, we calculated the interaction energy under different alkane systems (Table 4). Ealkane–surface of hexane and decane molecules are relatively low, indicating a weak interaction strength between the alkane molecules and quartz surface. Therefore, the mixed gas can effectively strip hexane and decane molecules. The difference between Egas–surface and Ealkane–surface is rather small, which is not sufficient to cause pentadecane to separate from the quartz surface. It indicates that when crude oil contains a significant amount of light components, it may be more effective to extract the oil using a mixture of CO2 and CH4.
| Alkanes | Condition | Ealkane–surface | Egas–surface | Egas–alkanes |
|---|---|---|---|---|
| nC5 | Pure CO2 | −43.05 | −223.97 | −798.50 |
| 25% CO2 + 75% CH4 | −53.77 | −193.50 | −782.13 | |
| nC10 | Pure CO2 | −65.80 | −214.11 | −906.11 |
| 25% CO2 + 75% CH4 | −71.83 | −163.68 | −895.03 | |
| nC15 | Pure CO2 | −84.60 | −180.28 | −675.28 |
| 25% CO2 + 75% CH4 | −122.30 | −139.92 | −767.09 |
4. Conclusions
The impact of CH4 content in produced gas on the displacement efficiency of shale oil was investigated in the present study using molecular dynamics simulations. The oil recovery efficiency is significantly influenced by the CH4 content in the produced gas. When the CH4 content in the produced gas reaches 25%, the oil displacement efficiency of shale oil is comparable to that of pure CO2. As the proportion of CH4 in the produced gas increases, the diffusion coefficients of CO2 and CH4 gradually increase which causes the oil film to expand more rapidly. However, when the proportion of CH4 in the produced gas becomes too high (increasing to 50% and 100%), the interaction energy between the gas molecules and the quartz surface is significantly reduced. The gas can only cause crude oil expansion and dispersion, but cannot separate from the quartz surface, thus affecting the final oil displacement performance. Furthermore, since CH4 is difficult to adsorb stably on the quartz surface, the CH4 content in the produced gas will increase during the cyclic injection and production process, thereby affecting the gas flooding performance. In addition, the binding force of CO2 molecules on the quartz surface is not strong enough under the temperature and pressure of deep reservoirs, so the effect of burial depth on CO2/CH4 displacement of crude oil seems to be less significant. Furthermore, the extraction efficiency of light hydrocarbons may be more effective with mixed gas (with a methane content of 25%), while the extraction efficiency for heavy oil is relatively poor.The research is to investigate the behaviour and interaction between CH4, CO2, oil and quartz during oil displacement. The results are helpful in potentially developing strategies in gas selection for more efficient oil displacement and film detachment processes. Additionally, the findings may also contribute to the development of more effective and environmentally friendly methods for oil extraction and production by produced gas. It also holds promise for enhancing our understanding of multiphase interactions in oil and gas systems, which can have implications for various applications in enhanced oil recovery and reservoir engineering.
Author contributions
Ping Feng: conceptualization, investigation, methodology, formal analysis, writing, funding acquisition. Yangwen Zhu: investigation, methodology. Keling Zhao: investigation, methodology, formal analysis, writing. Ying Gao: methodology, writing. Haiying Liao: methodology. Quanqi Dai: methodology. Yongqiang Tang: methodology. Kezhen Gou: investigation. Xueshuai Zhu: writing.Conflicts of interest
There are no conflicts to declare.Acknowledgements
This work is financially supported by the Open Foundation of SINOPEC Key Laboratory of Carbon Capture, Utilization and Storage (grant number 33550000-22-ZC0613-0323), China Yibin City 2022 Introduction of High-level Talents Project (2022YG04).References
- V. Salygin, I. Guliev, N. Chernysheva, E. Sokolova, N. Toropova and L. Egorova, Sustainability, 2019, 11, 1627 CrossRef.
- L. A. Davis, Engineering, 2018, 4, 438–439 CrossRef CAS.
- C. Zou, Z. Yang, G. Li, J. Li, X. Liu, Y. Tang, T. Jiang, Y. Yang, X. Bai, S. Pan, M. Lu, Z. Lei and B. Cai, J. Earth Sci., 2022, 33, 1324–1327 CrossRef.
- Y. Xu, Z. Lun, Z. Pan, H. Wang, X. Zhou, C. Zhao and D. Zhang, J. Pet. Sci. Eng., 2022, 211, 110183 CrossRef CAS.
- X. Dong, W. Xu, R. Liu, Z. Chen, N. Lu and W. Guo, J. Mol. Liq., 2022, 119322, DOI:10.1016/j.molliq.2022.119322.
- W. Chen, X. Geng, W. Liu, B. Ding, C. Xiong, J. Sun, C. Wang and K. Jiang, Energy Fuels, 2023, 37, 4729–4750 CrossRef CAS.
- H. Liu, Y. Huang, M. Cai, S. Meng and J. Tao, Pet. Explor. Dev., 2023, 50, 688–698 CrossRef.
- X. Huang, Z. Kang, J. Zhao, G. Wang, H. Zhang and D. Yang, Energy, 2023, 277, 127677 CrossRef CAS.
- Y. Xu, Z. Lun, H. Wang, X. Zhou, C. Zhao, G. Zhang and D. Zhang, J. Pet. Sci. Eng., 2022, 219, 111067 CrossRef CAS.
- Y. Lu, J. Zhou, H. Li, X. Chen and J. Tang, ACS Omega, 2020, 5, 22568–22577 CrossRef CAS.
- M. Bizhani, O. H. Ardakani, S. B. Hawthorne, J. Cesar, B. Kurz and J. B. Percival, Minerals, 2022, 12, 779 CrossRef CAS.
- Y. Xu, Z. Lun, H. Wang, C. Zhao, X. Zhou, W. Hu, J. Zou and D. Zhang, Sep. Purif. Technol., 2024, 334, 125970 CrossRef CAS.
- S. Yuan, D. Ma, J. Li, T. Zhou, Z. Ji and H. Han, Pet. Explor. Dev., 2022, 49, 955–962 CrossRef.
- K. Novak Mavar, N. Gaurina-Međimurec and L. Hrnčević, Sustainability, 2021, 13, 1800 CrossRef.
- X. Du, Y. Cheng, Z. Liu, Z. Hou, T. Wu, R. Lei and C. Shu, Alexandria Eng. J., 2020, 59, 5165–5178 CrossRef.
- H. Sui, F. Zhang, L. Zhang, D. Wang, Y. Wang, Y. Yang and J. Yao, Sci. Total Environ., 2024, 908, 168356 CrossRef CAS PubMed.
- R. Iddphonce and J. Wang, J. Pet. Sci. Eng., 2021, 205, 108802 CrossRef CAS.
- H. Sun, H. Zhao, N. Qi and Y. Li, J. Phys. Chem. C, 2017, 121, 10233–10241 CrossRef CAS.
- P. A. Bonnaud, F. Oulebsir, G. Galliero and R. Vermorel, Fuel, 2023, 352, 129020 CrossRef CAS.
- W. Yong, J. Derksen and Y. Zhou, J. Nat. Gas Sci. Eng., 2021, 87, 103746 CrossRef CAS.
- N. Choudhary, M. F. A. Che Ruslan, A. K. Narayanan Nair and S. Sun, Ind. Eng. Chem. Res., 2021, 60, 729–738 CrossRef CAS.
- D. Lang, Z. Lun, C. Lyu, H. Wang, Q. Zhao and H. Sheng, Pet. Explor. Dev., 2021, 48, 702–712 CrossRef.
- S. Kong, G. Feng, Y. Liu and K. Li, Fuel, 2021, 296, 120643 CrossRef CAS.
- L. Wang, Y. Zhang, R. Zou, R. Zou, L. Huang, Y. Liu and H. Lei, J. Mol. Liq., 2023, 385, 122389 CrossRef CAS.
- T. Huang, L. Cheng, R. Cao, X. Wang, P. Jia and C. Cao, Chem. Eng. J., 2024, 479, 147743 CrossRef CAS.
- R. Wang, S. Bi, Z. Guo and G. Feng, Chem. Eng. J., 2022, 440, 135796 CrossRef CAS.
- B. Liu, M. Zhang, T. Wang and W. Jia, Energy Sci. Eng., 2019, 7, 663–675 CrossRef CAS.
- S. Wu, Appl. Petrochem., 2017, 36, 84–88 Search PubMed.
- R. K. Srivastava, S. S. Huang and M. Dong, SPE Reservoir Eval. Eng., 1999, 2, 238–247 CrossRef CAS.
- T. Hoffman, S. Sonnenberg and K. Hossein, The Benefits of Reinjecting Instead of Flaring Produced Gas in Unconventional Oil Reservoirs, Denver, Colorado, 2014 Search PubMed.
- X. Li, P. Wang, S. Wang, Q. Feng and Q. Xue, Chem. Eng. J., 2021, 405, 127012 CrossRef CAS.
- X. Dong, W. Xu, H. Liu, Z. Chen, N. Lu and W. Wang, Geoenergy Sci. Eng., 2023, 223, 211528 CrossRef CAS.
- H. Sui, F. Zhang, L. Zhang, Z. Wang, S. Yuan, D. Wang and Y. Wang, Fuel, 2023, 349, 128692 CrossRef CAS.
- Y. Luan, B. Liu, P. Hao, K. Zhan and J. Liu, J. Pet. Sci. Eng., 2020, 188, 106899 CrossRef CAS.
- T. Yu, Q. Li, H. Hu, Y. Tan and L. Xu, Colloids Surf., A, 2022, 632, 127807 CrossRef CAS.
- T. Fang, M. Wang, C. Wang, B. Liu, Y. Shen, C. Dai and J. Zhang, Chem. Eng. Sci., 2017, 164, 17–22 CrossRef CAS.
- H. Sun, J. Phys. Chem. B, 1998, 102, 7338–7364 CrossRef CAS.
- W. Guang, Z. Zhang, L. Zhang, P. G. Ranjith, S. Hao and X. Liu, Energy, 2023, 278, 127929 CrossRef CAS.
- S. Wang, F. Javadpour and Q. Feng, Fuel, 2016, 171, 74–86 CrossRef CAS.
- S. Liang, J.-M. Wang, Y.-K. Liu, B. Liu, S. Sun, A.-Q. Shen and F.-Y. Tao, Front. Earth Sci., 2022, 9, 833302 CrossRef.
- D. Y. Moh, H. Zhang, S. Wang, X. Yin and R. Qiao, Fuel, 2022, 308, 122026 CrossRef CAS.
- Y. Wang, Y. Chen, J. Wang, Z. Pan and J. Liu, ACS Omega, 2021, 6, 29618–29628 CrossRef CAS PubMed.
- X. Yang, Z. Chen, X. Liu, Z. Xue, F. Yue, J. Wen, M. Li and Y. Xue, Energy, 2022, 240, 122789 CrossRef CAS.
- P. Huo, D. Zhang, Z. Yang, W. Li, J. Zhang and S. Jia, Int. J. Greenhouse Gas Control, 2017, 66, 48–59 CrossRef CAS.
- T. Yu, Q. Li, H. Hu, Y. Tan and L. Xu, J. Pet. Sci. Eng., 2022, 218, 110989 CrossRef CAS.
- Y. Luo, H. Xiao, X. Liu, T. Zheng and Z. Wu, J. Mol. Liq., 2023, 382, 121943 CrossRef CAS.
- B. Liu, C. Wang, J. Zhang, S. Xiao, Z. Zhang, Y. Shen, B. Sun and J. He, Energy Fuels, 2017, 31, 738–746 CrossRef CAS.
- G. Rucker, X. Yu and L. Zhang, Fuel, 2020, 267, 117252 CrossRef CAS.
- L. Zheng, Q. Zhao, Y. Dong, H. Jin, B. Bawaa and L. Guo, J. Supercrit. Fluids, 2023, 195, 105862 CrossRef CAS.
- C. Li, H. Pu, X. Zhong, Y. Li and J. X. Zhao, Fuel, 2020, 276, 118058 CrossRef CAS.
- D. Y. Moh, H. Zhang, S. Sun and R. Qiao, Fuel, 2022, 324, 124662 CrossRef CAS.
Footnote |
| † Electronic supplementary information (ESI) available. See DOI: https://doi.org/10.1039/d3ra08610k |
| This journal is © The Royal Society of Chemistry 2024 |

