 Open Access Article
Synthesis and spectral characterization of the phenothiazine-thiosemicarbazide probe for the optical solid-state detection of Hg2+ and Cu2+†
Fatimah A. M. Al-Zahrani a and
Mohamed A. Abdel-Lateef
 *b
*b
aChemistry Department, Faculty of Science, King Khalid University, PO Box 9004, Abha 61413, Saudi Arabia
bDepartment of Pharmaceutical Analytical Chemistry, Faculty of Pharmacy, Al-Azhar University, Assiut Branch, Assiut 71524, Egypt. E-mail: mohamed_abdellateef@azhar.edu.eg
First published on 24th May 2024
Abstract
In this study, a phenothiazine-thiosemicarbazide (PTZDS) probe was synthesized and characterized. The synthesized PTZDS probe exhibited a yellow color, with a native fluorescence emission at λemission = 550 nm and λexcitation = 450 nm. Over other metal ions, the probe exhibited significant selectivity and sensitivity towards Hg2+ and Cu2+. The probe showed fluorescence quenching along with a minor shift in the absorbance spectra from 400 to 450 nm and 430 nm in the presence of Hg2+ and Cu2+, respectively. In addition, the color of the synthesized probe remarkedly faded with the addition of Hg2+ or Cu2+. Fluorescence measurements, infrared spectroscopy (IR), and density functional theory studies were employed to elucidate the binding process in the PTZDS + Cu2+ and PTZDS + Hg2+ sensor systems. Furthermore, photophysical investigations of the synthesized probe with Hg2+ and Cu2+ were performed. Finally, the probe was successfully employed as a solid-state thin layer chromatography (TLC) optical sensor for detecting Hg2+ and Cu2+ ions.
1. Introduction
Heavy metals are natural metallic elements that are toxic or harmful when absorbed even in small doses and have a relatively high density.1 In their natural form, heavy metals can also be found in the crust of Earth. They occasionally enter human bodies through the air, food, and water. As trace elements, some heavy metals such as zinc, selenium, and copper are essential and required at very low concentrations for regulating body metabolism.2,3 However, they become toxic when their concentrations exceed specific thresholds.4 The bioaccumulation potential of heavy metals gives rise to significant concerns. Heavy metal contamination of water resources can originate from numerous sources including consumer and industrial waste, weathering of rocks, volcanic eruptions, and acid rain, which decompose the soil and release metals into streams, rivers, lakes, and groundwater.5–7 One of the frequently used heavy metals is copper (Cu). It is typically used in electronic chips, water pipes, batteries, mobile phones, semiconductors, pulp and paper industry, fungicide and pesticide industries, and manufacturing catalysts and products for metal processing.8–11 Although Cu is essential for proper growth of living things, high doses of copper may be quite dangerous. In high doses, copper is poisonous and can lead to nausea, diarrhea, weakness, or, in cases of severe exposure, liver cirrhosis. Similar to iron (Fe), copper may take part in chemical processes that generate highly reactive oxygen species (ROS), which are in charge of lipid oxidation in membranes, direct oxidation of proteins, and breaking of RNA and DNA strands.12,13 Aging and numerous illnesses including disorders of the neurological system and cancer are largely influenced by the production and activation of ROS.14 Cu toxicity may also occur with the displacement of other metal co-factors from their native ligands, in addition to the production of ROS. For example, the human estrogen receptor changes its signal transmission function in vivo when Cu(II) enters the zinc-finger DNA binding domain and replaces Zn(II).15 To stop the buildup of Cu ions to dangerous levels, specific regulatory mechanisms should be established.Mercury is a hazardous, bioaccumulative, and persistent contaminant.16–18 It is classified as the third most dangerous metal by the US Government Agency for Dangerous Substances and Disease Registry, after lead and arsenic.19,20 Environmental mercury exists in three forms: inorganic mercuric (Hg2+), metallic mercury, and mercurius salts and organic molecules (such as methyl-, ethyl-, and phenyl-mercury). Although all forms of mercury are dangerous, their toxicokinetic profiles vary, with organic mercury being the most toxic and elemental the least. Inorganic mercury salts, such as inorganic mercurous (Hg) and mercuric (Hg2+), are composed of inorganic mercury plus one of the following three elements: oxygen, chlorine, or sulfur. Mercury is also released into the atmosphere from a variety of anthropogenic and natural sources, including (i) primary natural sources, such as volcanic eruptions, rock weathering, geothermal activity, and soil erosion, which account for 10% of emissions; (ii) primary anthropogenic sources, which include mining and extraction of fossil fuels like coal, gas or oil; (iii) consequent anthropogenic sources like mercury-dependent small-scale gold mining [ASGM], various manufacturing procedures across the chloralkaline industry, which account for 30%; and (iv) re-utilisation and re-radiation (biomass blazing, forest exculpating, wildfires), which represent 60%. Anthropogenic activities have nearly quadrupled the quantity of mercury in the atmosphere and are responsible for the annual increase in atmospheric load by 1.5 percent. As a consequence of expanding industrial, medical, and home use, mercury concentrations are continually rising, creating a global concern. Mercury thresholds of 0.01 mg L−1 for industrial effluents and 0.001 mg L−1 for drinking water were established by the Bureau of Indian Standards and the WHO.21,22 Mercury poisoning has a severe impact on the neurological system as it can interfere with energy generation, disrupting cellular detoxification processes and forcing the cell to either die or exist in a chronically malnourished condition.23,24
As a result, scientists working in a variety of sectors are developing novel, accurate, and quick ways to detect these heavy metals. Due to their excellent sensitivity, selectivity, and low cost,25–28 fluorescence sensors hold the potential to be one of the most effective heavy metal ion detection technologies.25 Numerous fluorescent probes have recently been discovered for simultaneously detecting Cu2+ and Hg2+.29,30 A majority of Hg2+ chemosensors work by coupling Hg2+ with numerous N atoms or S atoms in well-known fluorophores, such as rhodamine, pyrene, coumarin,31 or BODIPY derivatives.32 A common method for developing novel fluorescent probes for Hg2+ is chemo dosimetry.
Using the phenothiazine (PTZ) core, which shows strong luminescence and excellent photo-responsivity and is often employed as an electron donor in dye-sensitized solar cells and organic light-emitted diodes,33–36 for heavy metal detection is a novel strategy. To the best of our knowledge, there have been just a few reports on using fluorescent probes based on PTZ.29,37,38 The creation of a PTZ fluorescence probe, namely the phenothiazine-thiosemicarbazide compound, for detecting Hg2+ ions and Cu2+ ions at nanomolar concentrations is described in this work. For Hg2+ ions and Cu2+ ions in aqueous solutions, this compound functions as a colorimetric and highly selective fluorescence probe.
2. Experimental methods
2.1 Materials and instruments
Solvents purchased from Sigma Aldrich were utilized without purification. The purity of the products was checked using aluminum silica gel F254-TLC, and any spots observed were identified based on the absorption of UV light. NMR spectra were captured in DMSO-d6 using Bruker Avance 850 MHz and 213 MHz spectrometers. The chemical shifts (δ) are reported in ppm, and coupling constants are given in Hz. A UV-vis absorbance spectrophotometer (Agilent 8453) in the wavelength range of 250–800 nm was utilized to record the UV-vis absorbance spectra. A Hitachi F-7000 fluorescence spectrometer device was utilized to obtain the fluorescence spectra.2.2 Synthetic procedures
![[double bond, length as m-dash]](https://www.rsc.org/images/entities/char_e001.gif) N), 11.324 (s, 2H, NH). 13C NMR (213 MHz, DMSO-d6); 14.39, 22.46, 26.34, 26.42, 28.87, 29.01, 31.51, 47.26, 116.23, 116.35, 116.80, 123.60, 123.64, 123.84, 125.33, 128.25, 128.43, 129.29, 130.14, 141.40, 141.71, 144.54, 145.48, 178.06 and IR (cm−1, KBr): 3425.89, 3258.88, 3147.86, 2922.45, 2851.39, 2360.96.
N), 11.324 (s, 2H, NH). 13C NMR (213 MHz, DMSO-d6); 14.39, 22.46, 26.34, 26.42, 28.87, 29.01, 31.51, 47.26, 116.23, 116.35, 116.80, 123.60, 123.64, 123.84, 125.33, 128.25, 128.43, 129.29, 130.14, 141.40, 141.71, 144.54, 145.48, 178.06 and IR (cm−1, KBr): 3425.89, 3258.88, 3147.86, 2922.45, 2851.39, 2360.96.2.3. Solvent selection and metal detection
A variety of solvents were tested to determine the best “off-on” ratio. Selectivity toward Hg2+/Cu2+ ions was better in acetonitrile than other solvents. Furthermore, we also performed PTZDS spectral titrations with various ratios (0–90% with an equal span of 10%) of H2O for efficient selectivity. The probe demonstrated a greater “off-on” sensory response to Hg2+/Cu2+ only in CH3CN/H2O (v/v, 1![[thin space (1/6-em)]](https://www.rsc.org/images/entities/char_2009.gif) :
:![[thin space (1/6-em)]](https://www.rsc.org/images/entities/char_2009.gif) 1).
1).
UV-visible and spectrofluorimetric titrations were conducted for the probe solution in CH3CN/H2O (v/v, 1![[thin space (1/6-em)]](https://www.rsc.org/images/entities/char_2009.gif) :
:![[thin space (1/6-em)]](https://www.rsc.org/images/entities/char_2009.gif) 1) at a concentration of 10−5 M. A 10−4 M stock solution of the probe was prepared, and the metal ions used were Co2+, K+, Mg2+, Ni2+, Fe2+, Fe3+, Pb2+, Zn2+, Cu2+, and Hg2+ (2 × 10⁻³M). The UV spectra was measured between 250 and 800 nm, the fluorescence spectra were obtained after excitation at 450 nm, and the fluorescence emission was scanned and measured between 500 and 800 nm.
1) at a concentration of 10−5 M. A 10−4 M stock solution of the probe was prepared, and the metal ions used were Co2+, K+, Mg2+, Ni2+, Fe2+, Fe3+, Pb2+, Zn2+, Cu2+, and Hg2+ (2 × 10⁻³M). The UV spectra was measured between 250 and 800 nm, the fluorescence spectra were obtained after excitation at 450 nm, and the fluorescence emission was scanned and measured between 500 and 800 nm.
| LOD = 3S/ρ | (1) |
3. Results and discussion
3.1. Synthesis and characterization of PTZDS
10-Octyl-10H-phenothiazine-3-carbaldehyde (1) and thiosemicarbazide (2)39 were used to synthesize the probe (PTZDS), as shown in Scheme 1. 1H NMR, 13C NMR, and IR were used to characterize PTZDS (Fig. S1 and S2 in ESI†).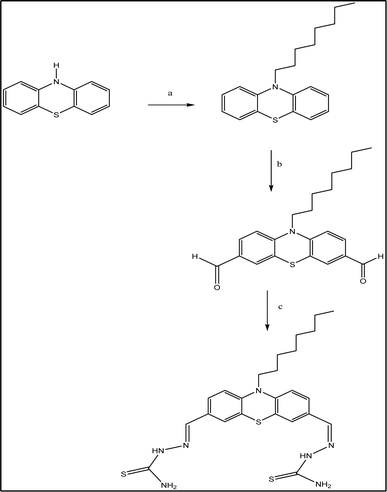 | ||
| Scheme 1 Synthesis of PTZDS. (a) Mixing of DMSO and K2CO3 for 24 hours; (b) refluxing of DMF and POCl3 for 24 hours; (c) stirring of thiosemicarbazide for 4 hours at room temperature in EtOH. | ||
3.2 Selectivity of PTZDS toward Hg2+ and Cu2+ versus other metal ions
PTZDS was evaluated against a number of important metal ions, including Co2+, Pb2+, Zn2+, K+, Mg2+, Ni2+, Fe2+, Fe3+, Cu2+, and Hg2+, in order to examine its selectivity towards Hg2+ and Cu2+. The addition of the aforementioned metal ions had no discernible effect on the intensity of the fluorescence spectra of PTZDS (Fig. 1). In addition, the fluorescence behavior of various metal ions in hindering the binding of Hg2+ and Cu2+ binding to PTZDS was investigated. A viable investigation showed that fluorescence quenching caused by Hg2+ and Cu2+ (1 equiv.) in the presence of other metal ions (1 equiv.) were equivalent to those in the presence of Hg2+ and Cu2+ alone (Fig. 1). These findings suggest that PTZDS is far more sensitive and selective to Hg2+ and Cu2+ than other competing metal ions. Fig. 1 shows the competitive binding and selectivity of PTZDS towards Hg2+ ions and Cu2+ ions. The green and purple bars show the fluorescence intensities of PTZDS + metal ions + Hg2+, and PTZDS + metal ions + Cu2+, respectively, while the yellow bars show the fluorescence intensity values of PTZDS in the presence of only Hg2+ and Cu2+.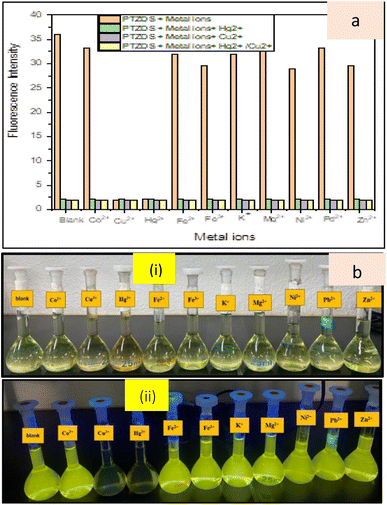 | ||
| Fig. 1 (a) Selectivity and competitive binding of PTZDS towards Hg2+ and Cu2, and (b) photos of PTZDS with different metal ions under (i) daylight and (ii) UV lighting. | ||
3.3. Photophysical studies of PTZDS with Hg2+and Cu2+
Absorbance bands at 300 and 400 nm were observed for the PTZDS (10−5 M) solution in CH3CN/H2O (v/v, 1![[thin space (1/6-em)]](https://www.rsc.org/images/entities/char_2009.gif) :
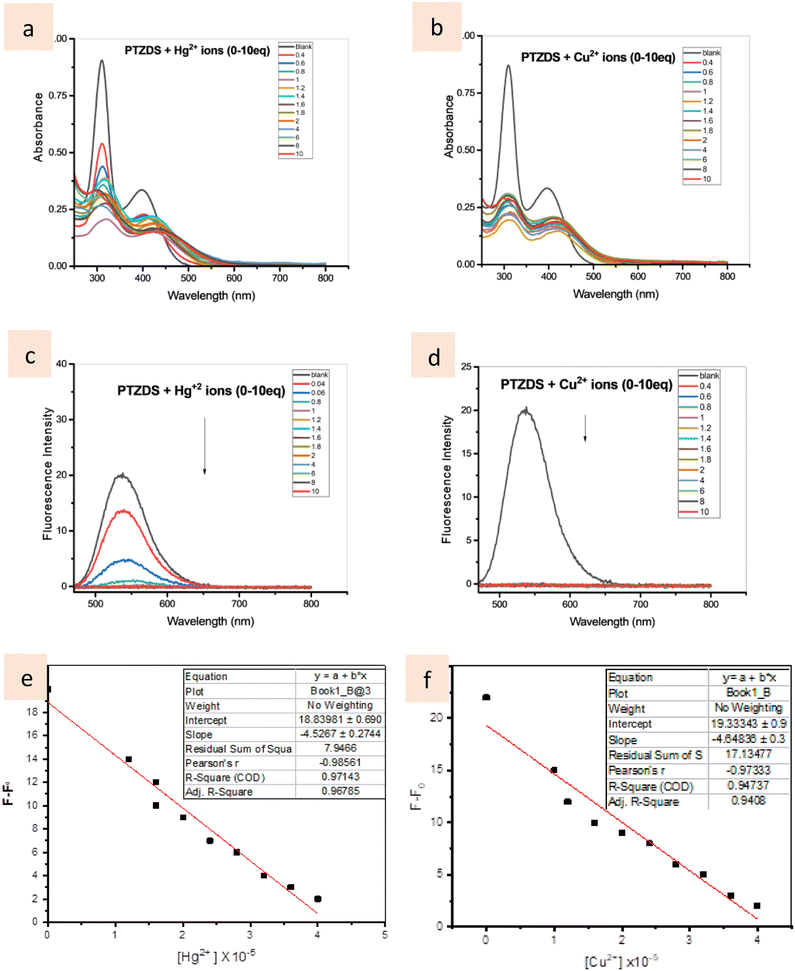
:![[thin space (1/6-em)]](https://www.rsc.org/images/entities/char_2009.gif) 1). The absorbance bands at 300 and 450 nm decreased with the addition of Hg2+ ions (0–10 equiv.), as seen in Fig. 2a and S3,† but the absorbance peak at 400 nm marginally increased (50 nm red-shift). Similar results were observed when the PTZDS solution was titrated with Cu2+ ions (0–10 equiv.) In Fig. 2b and S3,† a red-shifted band at can be seen at 450 nm. The stoichiometries of the complexes produced between PTZDS and the Hg2+ ions or Cu2+ ions were calculated using Job's plots as reported in a previous study.40 These findings suggest a 1
1). The absorbance bands at 300 and 450 nm decreased with the addition of Hg2+ ions (0–10 equiv.), as seen in Fig. 2a and S3,† but the absorbance peak at 400 nm marginally increased (50 nm red-shift). Similar results were observed when the PTZDS solution was titrated with Cu2+ ions (0–10 equiv.) In Fig. 2b and S3,† a red-shifted band at can be seen at 450 nm. The stoichiometries of the complexes produced between PTZDS and the Hg2+ ions or Cu2+ ions were calculated using Job's plots as reported in a previous study.40 These findings suggest a 1![[thin space (1/6-em)]](https://www.rsc.org/images/entities/char_2009.gif) :
:![[thin space (1/6-em)]](https://www.rsc.org/images/entities/char_2009.gif) 1 stoichiometry for the binding of PTZDS to these metal ions.
1 stoichiometry for the binding of PTZDS to these metal ions.
In the CH3CN/H2O (v/v, 1![[thin space (1/6-em)]](https://www.rsc.org/images/entities/char_2009.gif) :
:![[thin space (1/6-em)]](https://www.rsc.org/images/entities/char_2009.gif) 1) solution, PTZDS (10−5 M) was investigated for its fluorescence spectroscopic characteristics in the presence of Hg2+ ions and Cu2+ ions. PTZDS displayed an emission band at 550 nm after excitation at 450 nm (using slit widths of 5 nm for excitation and emission). Hg2+ treatment, however, caused the fluorescence signal at 550 nm to totally disappear (>80%) (Fig. 2c). A similar fluorescence quenching effect was seen at 550 nm (100%) after titrating the PTZDS solution with Cu2+ (0–10 equiv.) (Fig. 2d). Furthermore, the linear relationship between the fluorescence intensity and the concentrations of Hg2+ and Cu2+ are presented in Fig. 2e and f, respectively. According to these results, the detection limits (LOD) for Hg2+ ions and Cu2+ ions at 550 nm were calculated as 8.0 × 10⁻⁹ and 9.7 × 10⁻⁹ mol L−1, respectively. The LOD values show that the as-prepared probe is sensitive enough to detect Hg2+ and Cu2+ quantitatively. Table 1 offers a comparison of the LOD of previously reported chemosensors with the PTZDS sensor, demonstrating that PTZDS is the most sensitive sensor reported thus far.
1) solution, PTZDS (10−5 M) was investigated for its fluorescence spectroscopic characteristics in the presence of Hg2+ ions and Cu2+ ions. PTZDS displayed an emission band at 550 nm after excitation at 450 nm (using slit widths of 5 nm for excitation and emission). Hg2+ treatment, however, caused the fluorescence signal at 550 nm to totally disappear (>80%) (Fig. 2c). A similar fluorescence quenching effect was seen at 550 nm (100%) after titrating the PTZDS solution with Cu2+ (0–10 equiv.) (Fig. 2d). Furthermore, the linear relationship between the fluorescence intensity and the concentrations of Hg2+ and Cu2+ are presented in Fig. 2e and f, respectively. According to these results, the detection limits (LOD) for Hg2+ ions and Cu2+ ions at 550 nm were calculated as 8.0 × 10⁻⁹ and 9.7 × 10⁻⁹ mol L−1, respectively. The LOD values show that the as-prepared probe is sensitive enough to detect Hg2+ and Cu2+ quantitatively. Table 1 offers a comparison of the LOD of previously reported chemosensors with the PTZDS sensor, demonstrating that PTZDS is the most sensitive sensor reported thus far.
| Method | Analyte | Solvent | LOD, M |
|---|---|---|---|
| 6 and 41 | Cu2+ and Hg2+ | EtOH/H2O (HEPES, pH 7.4) 4![[thin space (1/6-em)]](https://www.rsc.org/images/entities/char_2009.gif) : :![[thin space (1/6-em)]](https://www.rsc.org/images/entities/char_2009.gif) 1 (v/v) 1 (v/v) |
1.63 × 10⁻⁶ (Cu) |
| 2.36 × 10⁻⁶ (Hg) | |||
| 42 | Cu2+ and Hg2+ | EtOH/water (2![[thin space (1/6-em)]](https://www.rsc.org/images/entities/char_2009.gif) : :![[thin space (1/6-em)]](https://www.rsc.org/images/entities/char_2009.gif) 1, v/v) buffer (HEPES, pH 7.2) 1, v/v) buffer (HEPES, pH 7.2) |
3.37 × 10⁻⁶ (Cu) |
| 1.50 × 10⁻⁷ (Hg) | |||
| 43 | Cu2+ and Hg2+ | MeCN | 8.0 × 10⁻⁸ (Cu) |
| 5.3 × 10⁻⁷ (Hg) | |||
| 44 | Cu2+ and Hg2+ | THF/HEPES buffer (8![[thin space (1/6-em)]](https://www.rsc.org/images/entities/char_2009.gif) : :![[thin space (1/6-em)]](https://www.rsc.org/images/entities/char_2009.gif) 2, v/v, pH 7.4) 2, v/v, pH 7.4) |
9.7 × 10⁻⁸ (Cu) |
| 8.0 × 10⁻⁸ (Hg) | |||
| 45 | Cu2+ and Hg2+ | MeCN/H2O (7/3, v/v) | 2.3 × 10⁻⁸ (Cu) |
| 3.2 × 10⁻⁷ (Hg) | |||
| 46 | Cu2+ and Hg2+ | MeCN/HEPES (8![[thin space (1/6-em)]](https://www.rsc.org/images/entities/char_2009.gif) : :![[thin space (1/6-em)]](https://www.rsc.org/images/entities/char_2009.gif) 2, v/v, pH 7.4) 2, v/v, pH 7.4) |
1.9 × 10⁻⁸ (Cu) |
| 0.77 × 10⁻⁸ (Hg) | |||
| 47 | Cu2+ and Hg2+ | MeOH/H2O (1![[thin space (1/6-em)]](https://www.rsc.org/images/entities/char_2009.gif) : :![[thin space (1/6-em)]](https://www.rsc.org/images/entities/char_2009.gif) 1, v/v) 1, v/v) |
3.6 × 10⁻⁷ (Cu) |
| 2.49 × 10⁻⁶ (Hg) | |||
| The present work | Cu2+ and Hg2+ | CH3CN/H2O (v/v, 1![[thin space (1/6-em)]](https://www.rsc.org/images/entities/char_2009.gif) : :![[thin space (1/6-em)]](https://www.rsc.org/images/entities/char_2009.gif) 1) 1) |
8.0 × 10⁻⁹ |
| 9.7 × 10⁻⁹ |
Radiative quantum yield (Φ) is a crucial parameter in molecular chemistry as it offers valuable insights into several aspects, such as excited electronic states, electronic-to-vibrational coupling, and radiationless transitions. By using eqn (2), the fluorescence quantum yield values (Φ) of PTZDS, PTZDS + Hg2+, and PTZDS + Cu2+ in ethanol were calculated in comparison with the reference fluorescence quantum yield value of 9,10-diphenylanthracene.
 | (2) |
The subscript R indicates the reference fluorophore with a known quantum yield, n represents the refractive index, OD represents the optical density, and F represents the integrated fluorescence intensity. Table 2 displays the quantum yield values of PTZDS only, PTZDS + Hg2+, and PTZDS + Cu2+.
| Composition | Tot Ea | HOMO (eV) | LUMO (eV) | HLGb (eV) | Φ |
|---|---|---|---|---|---|
a Total energy.b HOMO–LUMO gap, quantum yields in CH3CN![[thin space (1/6-em)]](https://www.rsc.org/images/entities/char_2009.gif) : :![[thin space (1/6-em)]](https://www.rsc.org/images/entities/char_2009.gif) H2O (1/1) using 9,10-diphenylanthracene (Φ = 0.9) as the reference. H2O (1/1) using 9,10-diphenylanthracene (Φ = 0.9) as the reference. |
|||||
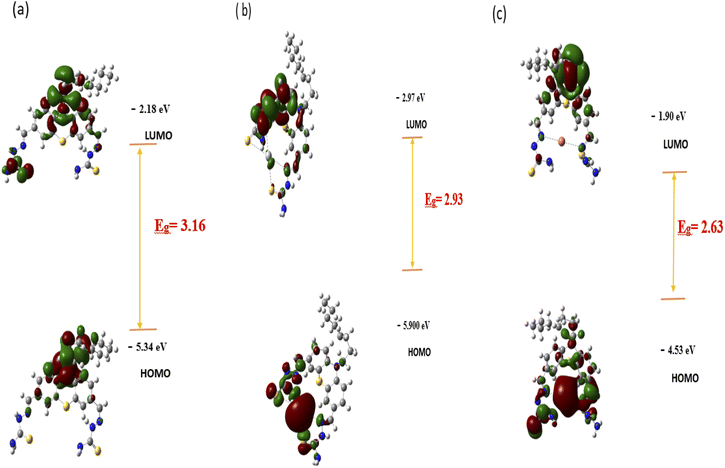
| PTZDS | −2509.56 | −5.34 | −2.18 | 3.16 | 0.269 |
| PTZDS + Hg2+ | −1387.63 | −5.90 | −2.97 | 2.93 | 0.033 |
| PTZDS + Cu2+ | −4149.04 | −4.53 | −1.90 | 2.63 | 0.041 |
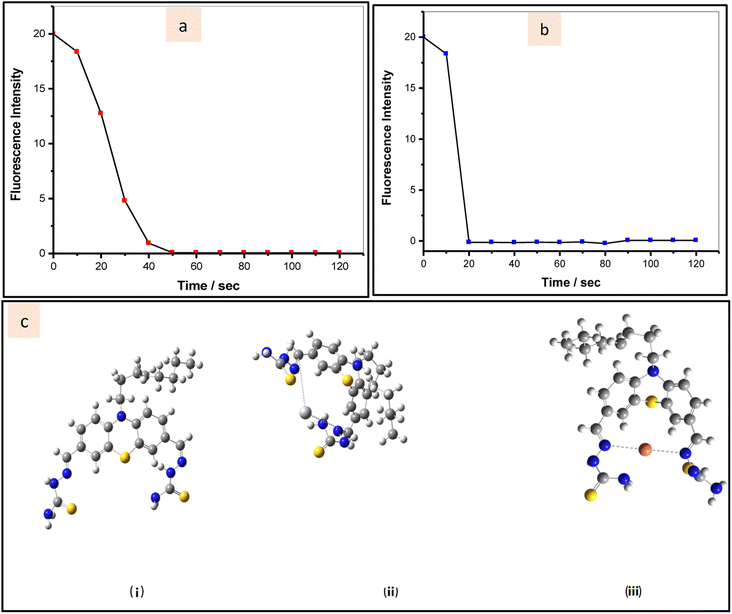
Further, we used time-dependent fluorescence responses to analyze the reaction kinetics of the utilized probe in presence of Hg2+ ions and Cu2+ ions. In the presence of Hg2+, which encourages PTZDS hydration, the fluorescence intensity of PTZDS noticeably dropped after 40 seconds (Fig. 3a). Similar to this, the probe interaction with Cu2+ ended after 20 seconds (Fig. 3b).
3.4 DFT and FT-IR studies of PTZDS with Hg2+ ions and Cu2+ ions
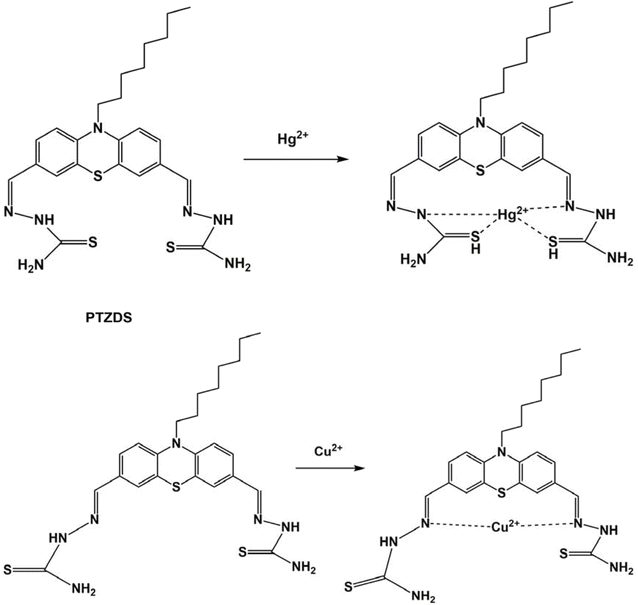
As observed in Scheme 2, the formation of the PTZDS + Cu2+ and PTZDS + Hg2+complexes were also well-supported by density functional theory (DFT) studies. DFT calculations were performed using the Gaussian 09 software to clarify the structures of PTZDS, PTZDS + Cu2+, and PTZDS + Hg2+. By employing the B3LYP/6-31G basis set, B3LYP/LANL2DZ level energy optimization of the chemosensor PTZDS and the PTZDS + Hg2+, and PTZDS + Cu2+ complexes was carried out. Fig. 3c displays the shapes of the used probe and the PTZDS + Hg2+ and PTZDS + Cu2+ complexes.According to the DFT analysis, Hg2+ is situated between two S atoms at distances of approximately 2.1775 Å and 2.1600 Å. Similarly, Hg2+ is situated roughly 2.0400 Å and 2.0201 Å from the two N atoms. The HOMO–LUMO energy gaps discovered by DFT calculations, in particular, provided strong evidence for the excimer production mechanism. In addition, the bandgap of PTZDS was determined to be 3.16 eV between its HOMO (−5.34 eV) and LUMO (−2.18 eV). The bandgap between the HOMO (−5.90 eV) and LUMO (−2.97 eV), on the other hand, was further reduced to 2.93 eV as a result of the PTZDS + Hg2+ coordination. Table 1 lists the HOMO, LUMO, and energy gaps (HLP) calculated using DFT. Our additional analysis demonstrated that other than the bandgap, the electron density of PTZDS was dispersed across the structure, as shown in Fig. 4. This is attributable to the values obtained in DFT investigations. The electron transfer and emission intensity of PTZDS towards Hg2+ ions was affected, according to the aforementioned data. In order to detect Hg2+ ions, a fluorescent turn-off sensor response was therefore observed. According to these observations, the distances between the Cu atom and the two nitrogen atoms were 1.80 Å and 2.00 Å. In addition, the suggested mechanism for the coordination of Cu2+ and Hg2+ ions with the used probe via nitrogen agrees with other reported studies on the coordination of Hg2+ ions and Cu2+ ions with phenothiazine probes.40,48
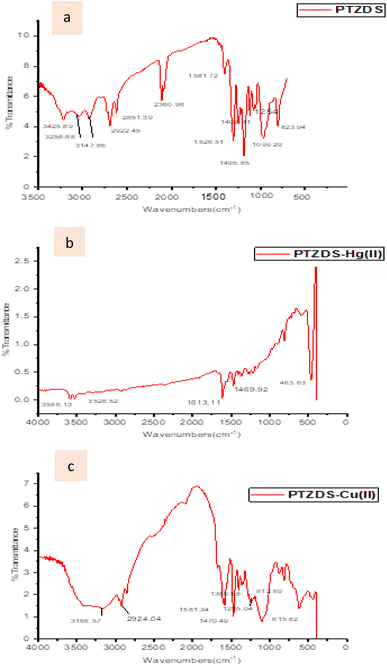
FT-IR measurements were used to test the postulated process. By combining PTZDS with either Cu(OCl4)2 or Hg(OCl4)2 and potassium bromide, the IR spectra of PTZDS with Hg2+ and Cu2+ were captured (Fig. 5). The –NH stretching peak at 3425 cm−1 was shifted to 3586 cm−1, and the C![[double bond, length as m-dash]](https://www.rsc.org/images/entities/char_e001.gif) N stretching band was shifted to 1613 cm−1 in the spectrum of PTZDS + Hg2+. The peak of Hg–S
N stretching band was shifted to 1613 cm−1 in the spectrum of PTZDS + Hg2+. The peak of Hg–S![[double bond, length as m-dash]](https://www.rsc.org/images/entities/char_e001.gif) C was seen at 463 cm−1. This indicated the binding of Hg2+ with the nitrogen and sulfur atoms. The Cu–N stretching signals of PTZDS -Cu(II) were first observed at 615 cm−1.49
C was seen at 463 cm−1. This indicated the binding of Hg2+ with the nitrogen and sulfur atoms. The Cu–N stretching signals of PTZDS -Cu(II) were first observed at 615 cm−1.49
3.5 Application of PTZDS as a solid-state sensor
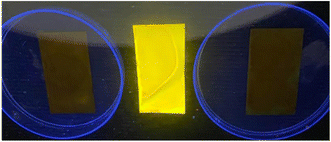
We examined the capacity of PTZDS to detect Hg2+ and Cu2+ on probe-pretreated TLC plates in order to determine the practical applicability of the solid-state sensor.29 After a brief period of PTZDS (10−3 M) adsorption, the TLC plates were dried in the air. In the next step, the yellow TLC plates were treated with a solution of Hg2+ and Cu2+ (2 mL, 10−5 M) in water, and a sudden colour shift from yellow to dark was noticed for both Hg2+ and Cu2+, as shown in Fig. 6. This experiment exhibits the solid-state Hg2+ and Cu2+ ion detection capability of PTZDS. This solid-state approach offers a straightforward, affordable, and practical alternative for the identification of Hg2+ ions and Cu2+ ions in environmental samples.4. Conclusions
A colorimetric and fluorescent probe was synthesized based on phenothiazine-thiosemicarbazide. The synthesized probe was characterized by the 1H NMR, 13C NMR, and IR techniques. It exhibited a fluorescence emission at 550 nm after fluorescence excitation at 450 nm. The fluorescence intensity of the probe was remarkedly quenched upon the addition of either Hg2+ ions or Cu2+ ions. Moreover, the yellow color of the synthesized phenothiazine-thiosemicarbazide probe was also remarkedly quenched with the addition of Hg2+ or Cu2+ ions. The sensitivity and selectivity of the synthesized phenothiazine-thiosemicarbazide probe toward Hg2+ and Cu2+ were studied and found to be good. Furthermore, photophysical studies of the synthesized probe with Hg2+ and Cu2+ were performed. The interaction between the synthesized probe and Hg2+ and Cu2+ was studied and analyzed by density functional theory calculations and infrared spectroscopic analysis. Moreover, a solid-state optical sensor fabricated using the synthesized probe proved successful in detecting Hg2+ and Cu2+.Author contributions
Fatimah Al-Zahrani designed the research, carried out experiments, interpreted the results, resources, and methodology, supervised the data, and wrote and edited the main manuscript. Mohamed A. Abdel-Lateef writing – original draft and writing – review & editing.Conflicts of interest
The authors declare no competing interests.Acknowledgements
The authors extend their appreciation to the Deanship of Scientific Research at King Khalid University for funding this work through large group Research Project under grant number RGP2/143/44.References
- R. M. El-Shishtawy, M. M. Rahman, T. A. Sheikh, M. Nadeem Arshad, F. A. Al-Zahrani and A. M. Asiri, Materials, 2020, 13, 2695 CrossRef CAS PubMed.
- F. A. Al-Zahrani, B. M. Al-Shehri and R. M. El-Shishtawy, Sustainability, 2023, 15, 4700 CrossRef CAS.
- F. A. Al-Zahrani, B. M. Al-Shehri, R. M. El-Shishtawy, N. S. Awwad, K. A. Khan, M. Sayed and S. M. Siddeeg, Materials, 2022, 15, 8136 CrossRef CAS PubMed.
- M. Jaishankar, T. Tseten, N. Anbalagan, B. B. Mathew and K. N. Beeregowda, Interdiscip. Toxicol., 2014, 7, 60 CrossRef PubMed.
- B. M. Al-Shehri, F. A. Al-Zahrani, R. M. El-Shishtawy, N. S. Awwad, M. Sayed and K. A. Khan, Sci. Rep., 2023, 13, 1631 CrossRef CAS PubMed.
- X.-D. Jiang, J. Zhao, Q. Li, C.-L. Sun, J. Guan, G.-T. Sun and L.-J. Xiao, Dyes Pigm., 2016, 125, 136–141 CrossRef CAS.
- M. S. Sankhla, M. Kumari, M. Nandan, R. Kumar and P. Agrawal, Int. J. Curr. Microbiol. Appl. Sci., 2016, 5, 759–766 CrossRef CAS.
- F. A. Al-Zahrani, R. M. El-Shishtawy, A. M. Asiri, A. M. Al-Soliemy, K. A. Mellah, N. S. Ahmed and A. Jedidi, BMC Chem., 2020, 14, 1–11 CrossRef PubMed.
- M. Parmar and L. S. Thakur, Int. J. Plant, Anim. Environ. Sci., 2013, 3, 143–157 CAS.
- D. Kumar, H. Singh, A. Jain, V. Sharma, N. Bhardwaj, S. Puri and M. Khatri, Chem. Pap., 2023, 77, 1907–1920 CrossRef CAS.
- T. Simon, M. Shellaiah, V. Srinivasadesikan, C.-C. Lin, F.-H. Ko, K. W. Sun and M.-C. Lin, New J. Chem., 2016, 40, 6101–6108 RSC.
- O. I. Aruoma, J. Am. Oil Chem. Soc., 1998, 75, 199–212 CrossRef CAS PubMed.
- C. Angelé-Martínez, K. V. T. Nguyen, F. S. Ameer, J. N. Anker and J. L. Brumaghim, Nanotoxicology, 2017, 11, 278–288 CrossRef PubMed.
- B. Halliwell and J. Gutteridge, Biochem. J., 1984, 219, 1 CrossRef CAS PubMed.
- P. F. Predki and B. Sarkar, J. Biol. Chem., 1992, 267, 5842–5846 CrossRef CAS.
- M. A. Abdel-Lateef, Sci. Rep., 2022, 12, 6953 CrossRef CAS PubMed.
- W. A. Al-Onazi and M. A. Abdel-Lateef, Spectrochim. Acta, Part A, 2022, 264, 120258 CrossRef CAS PubMed.
- M. A. Abdel-Lateef, A. Almahri, E. Alzahrani, R. A. Pashameah, A. A. Abu-Hassan and M. A. El Hamd, Chemosensors, 2022, 10, 358 CrossRef CAS.
- J. Wang, Q. Niu, T. Hu, T. Li and T. Wei, J. Photochem. Photobiol., A, 2019, 384, 112036 CrossRef CAS.
- M. Shellaiah, Y. C. Rajan, P. Balu and A. Murugan, New J. Chem., 2015, 39, 2523–2531 RSC.
- J. C. Clifton II, Pediatr. Clin. North Am., 2007, 54(2), e231–e245 CrossRef PubMed.
- R. K. Verma, M. S. Sankhla and R. Kumar, Int. J. Forensic Sci., 2018, 1, 72–78 Search PubMed.
- A. Frustaci, N. Magnavita, C. Chimenti, M. Caldarulo, E. Sabbioni, R. Pietra, C. Cellini, G. F. Possati and A. Maseri, J. Am. Coll. Cardiol., 1999, 33, 1578–1583 CrossRef CAS PubMed.
- F. A. Al-Zahrani, H. A. Al-Ghamdi, M. A. Abdel-Lateef and R. M. El-Shishtawy, Luminescence, 2023, 38, 477–486 CrossRef CAS PubMed.
- H. S. AlSalem, M. S. Binkadem, S. T. Al-Goul and M. A. Abdel-Lateef, Spectrochim. Acta, Part A, 2023, 295, 122616 CrossRef PubMed.
- M. A. Albalawi, H. Gomaa, M. A. El Hamd, M. A. Abourehab and M. A. Abdel-Lateef, Luminescence, 2023, 38, 92–98 CrossRef CAS PubMed.
- M. S. Binkadem, H. S. AlSalem, S. T. Al-Goul, W. T. Alsaggaf, M. A. El Hamd and M. A. Abdel-Lateef, Spectrochim. Acta, Part A, 2023, 299, 122839 CrossRef CAS PubMed.
- H. S. AlSalem, S. N. Alharbi, M. S. Binkadem, S. A. Mahmoud and M. A. Abdel-Lateef, Luminescence, 2024, 39, e4748 CrossRef PubMed.
- X. Lu, Y. Zhan and W. He, J. Photochem. Photobiol., B, 2022, 112528 CrossRef CAS PubMed.
- J. Hu, Z. Hu, Z. Chen, H.-W. Gao and K. Uvdal, Anal. Chim. Acta, 2016, 919, 85–93 CrossRef CAS PubMed.
- S. O. Aderinto, Chem. Pap., 2020, 74, 3195–3232 CrossRef CAS PubMed.
- A. Roy, M. Nandi and P. Roy, TrAC, Trends Anal. Chem., 2021, 138, 116204 CrossRef CAS.
- L. M. Nhari, E. N. Bifari, A. R. Al-Marhabi, F. A. Al-Zahrani, H. A. Al-Ghamdi, S. N. Al-Ghamdi, A. M. Asiri and R. M. El-Shishtawy, J. Organomet. Chem., 2023, 989, 122648 CrossRef CAS.
- R. S. Rao, B. Yadagiri, G. D. Sharma and S. P. Singh, Chem. Commun., 2019, 55, 12535–12538 RSC.
- F. AM Al-Zahrani, Pigm. Resin Technol., 2022, 493–501 Search PubMed.
- A. Slodek, D. Zych, G. Szafraniec-Gorol, P. Gnida, M. Vasylieva and E. Schab-Balcerzak, Materials, 2020, 13, 2292 CrossRef CAS PubMed.
- K. M. Vengaian, C. D. Britto, K. Sekar, G. Sivaraman and S. Singaravadivel, Sens. Actuators, B, 2016, 235, 232–240 CrossRef CAS.
- P. Karuppusamy and S. Sarveswari, Inorg. Chim. Acta, 2021, 515, 120073 CrossRef CAS.
- R. M. El-Shishtawy, F. A. Al-Zahrani, Z. M. Al-Amshany and A. M. Asiri, Sens. Actuators, B, 2017, 240, 288–296 CrossRef CAS.
- V. Govindasamy, S. Perumal, I. Sekar, B. Madheswaran, S. Karuppannan and S. B. Kuppannan, J. Fluoresc., 2021, 31, 667–674 CrossRef CAS PubMed.
- M. Li, Y. Sun, L. Dong, Q.-C. Feng, H. Xu, S.-Q. Zang and T. C. Mak, Sens. Actuators, B, 2016, 226, 332–341 CrossRef CAS.
- M. Ozdemir, J. Photochem. Photobiol., A, 2016, 318, 7–13 CrossRef CAS.
- X. He, J. Zhang, X. Liu, L. Dong, D. Li, H. Qiu and S. Yin, Sens. Actuators, B, 2014, 192, 29–35 CrossRef CAS.
- M. Kaur, M. J. Cho and D. H. Choi, Dyes Pigm., 2016, 125, 1–7 CrossRef CAS.
- D. Udhayakumari and S. Velmathi, Supramol. Chem., 2015, 27, 539–544 CrossRef CAS.
- D. Udhayakumari and S. Velmathi, Ind. Eng. Chem. Res., 2015, 54, 3541–3547 CrossRef CAS.
- Y. B. Wagh, A. Kuwar, S. K. Sahoo, J. Gallucci and D. S. Dalal, RSC Adv., 2015, 5, 45528–45534 RSC.
- J. Wang, Q. Niu, T. Wei, T. Li, T. Hu, J. Chen, X. Qin, Q. Yang and L. Yang, Microchem. J., 2020, 157, 104990 CrossRef CAS.
- D. Vashisht, S. Sharma, R. Kumar, V. Saini, V. Saini, A. Ibhadon, S. C. Sahoo, S. Sharma, S. K. Mehta and R. Kataria, Microchem. J., 2020, 155, 104705 CrossRef CAS.
Footnote |
| † Electronic supplementary information (ESI) available. See DOI: https://doi.org/10.1039/d3ra08624k |
| This journal is © The Royal Society of Chemistry 2024 |

