 Open Access Article
Controllable fabrication of CoNi bimetallic alloy for high-performance electromagnetic wave absorption†
Hai Xieabc,
Jinmei Liac,
Rui Yangac,
Juan Yangd,
Tingmei Wang*abc and
Qihua Wang *abc
*abc
aKey Laboratory of Science and Technology on Wear and Protection of Materials, Lanzhou Institute of Chemical Physics, Chinese Academy of Sciences, Lanzhou, 730000, China. E-mail: wangqh@licp.cas.cn; tmwang@licp.cas.cn
bCenter of Materials Science and Optoelectronics Engineering, University of Chinese Academy of Sciences, Beijing, 100049, China
cState Key Laboratory of Solid Lubrication, Lanzhou Institute of Chemical Physics, Chinese Academy of Sciences, Lanzhou, 730000, China
dLaboratory of Clean Energy Chemistry and Materials, State Key Laboratory of Solid Lubrication, Lanzhou Institute of Chemical Physics, Chinese Academy of Sciences, Lanzhou, 730000, China
First published on 25th March 2024
Abstract
With the coming era of artificial intelligence (AI) dominated by high-tech electronics, developing high-performance microwave absorption materials (MAMs) is imperative to solve the problem of increasing electromagnetic inference and pollution. Herein, a metal–organic framework (MOF)-derived CoNi bimetallic alloy (CoNi/C) with an irregular rod-like structure is prepared by a thermal reduction method. Introducing the CoNi alloy facilitates the balance between conduction loss and polarization loss and forms good impedance matching, leading to excellent microwave absorption performance. Interestingly, the optimization of absorption performance can be further achieved by controllably modulating the molar ratio of Co and Ni (Co2+/Ni2+). As expected, the obtained CoNi/C delivers excellent microwave absorption performance with a minimum reflection loss (RLmin) of −50.80 dB at 10.40 GHz and an effective absorption bandwidth (EAB) of 3.28 GHz (8.91–12.19 GHz) with a filler loading of 50 wt% at 2.0 mm. In addition, the CoNi/C can reach a maximum EAB of 4.77 GHz (12.99–17.76 GHz) at a low thickness of 1.5 mm, spanning nearly the entire Ku band. The CoNi3/C also exhibits an impressive RLmin of −44.84 dB at 3.28 GHz in the S band. This work offers a novel strategy to modulate the magnetic/electric properties of MOF-derived MAMs.
1. Introduction
The considerable electromagnetic inference and pollution generated by the widespread application of electromagnetic radiation have negatively affected electronic devices, information security, living environments, and human health.1–5 Currently, the development of suitable microwave absorption materials (MAMs) that can interact with electromagnetic waves and convert microwave energy into thermal energy is a promising approach to mitigate electromagnetic radiation.6–8 Excellent MAMs should have the advantages of “reducing weight, small coating thickness, broadening absorption, and strong reflection loss”.3,9–11 Despite the satisfactory microwave absorption performance of traditional MAMs, they have limited attenuation capacity, low dielectric loss capability, and poor impedance matching due to single polarization, making it difficult for them to reach the requirements.9,12,13 Therefore, it is of great significance to develop excellent MAMs.In recent years, alloys have been widely studied as important MAMs because of their favorable magnetic properties, good thermal and electrical conductivity, and high strength.14 Among the various alloys, the CoNi alloy has drawn considerable attention for its low cost, excellent magnetic loss properties, and desirable microwave absorption characteristics.15–17 However, the CoNi alloy has a high density and therefore cannot fulfill the needs of lightweight systems.15,17 In addition, as many papers reported, the CoNi alloys mostly suffer from mismatching electromagnetic parameters, resulting in poor electromagnetic wave absorption performance.15,18,19 It is highly desirable to explore a suitable precursor for the construction of CoNi alloys.
Metal–organic frameworks (MOFs) have been considered ideal candidates for the preparation of MAMs due to their tunable chemical composition and structure, hierarchical pore structure, good electromagnetic coordination and attenuation, and easy locking of dielectric/magnetic combinations.9,20–22 Currently, MOF-derived MAMs (carbon/metal oxide hybrids, carbon/metal hybrids, etc.) have made great progress in electromagnetic wave absorption with their excellent impedance matching and microwave loss characteristics.23,24 Therefore, developing high-performance CoNi alloys derived from MOFs is a viable strategy, but remains a great challenge.
Herein, we report the fabrication of a CoNi alloy anchored on carbon nanorods (CoNi/C) as an efficient MAM. By adjusting the molar ratio of Co and Ni (Co2+/Ni2+), the components and electromagnetic wave absorption performance of the CoNi alloy can be effectively controlled. Additionally, benefiting from the configuration of the CoNi alloy and strong interfacial interactions between CoNi and carbon nanorod, the as-prepared CoNi/C with a 50 wt% paraffin loading possesses exhibits a minimum reflection loss (RLmin) of −50.80 dB at a thickness of 2.0 mm. The CoNi3/C also delivers an impressive RLmin of −44.84 dB at 3.28 GHz in the S band. Meanwhile, the effective absorption bandwidth (EAB) of CoNi/C reaches a maximum of 4.77 GHz at a low thickness of 1.5 mm, covering nearly the whole Ku band frequency. The combination of the electrical loss of carbon and the magnetic loss of the NiCo alloy can optimize impedance matching of CoNi/C, effectively widening the absorbing band of the composite. This work opens up a promising strategy for the synthesis of MOF-derived alloy/carbon composites with high-performance.
2. Experimental
2.1 Synthesis of CoNi-MOF precursors
The CoNi-MOF precursors were synthesized by a facile one-pot method. Briefly, 0.02 mol Co(NO3)2·6H2O and 0.02 mol Ni(NO3)2·6H2O were dissolved in 240 mL ethyl alcohol by ultrasonic treating. Then 2.00 mmol terephthalic acid (PTA) was added under stirring. Subsequently, the above mixed solution was kept stirring in an oil bath at 80 °C for 120 min. After cooling, the solvent was evaporated by rotary evaporation. Finally, the resulting CoNi-MOF was dried at 60 °C for 12 h.For comparison, CoNi-MOF-1 and CoNi-MOF-2 were synthesized when the molar ratios of Co2+ and Ni2+ were modulated to 3![[thin space (1/6-em)]](https://www.rsc.org/images/entities/char_2009.gif) :
:![[thin space (1/6-em)]](https://www.rsc.org/images/entities/char_2009.gif) 1 and 1
1 and 1![[thin space (1/6-em)]](https://www.rsc.org/images/entities/char_2009.gif) :
:![[thin space (1/6-em)]](https://www.rsc.org/images/entities/char_2009.gif) 3, respectively, under the same preparation conditions.
3, respectively, under the same preparation conditions.
2.2 Synthesis of CoNi/C composites
In a typical synthesis, the resulting CoNi-MOF, CoNi-MOF-1, and CoNi-MOF-2 were placed in a quartz boat and annealed under an atmosphere of 10% H2–90% Ar at 600 °C for 4 h with a heating rate of 2 °C min−1 to obtain CoNi/C, Co3Ni/C, and CoNi3/C, respectively.For comparison, CoNi/C-500 and CoNi/C-700 were prepared by pyrolysis in a 10% H2–90% Ar atmosphere at 500 and 700 °C for 4 h, respectively, with a heating rate of 2 °C min−1.
2.3 Characterization
The morphologies of samples were characterized by scanning electron microcopy (SEM, JSM-6700) and high-resolution transmission electron microscopy (TEM, JEM-3010). The crystal structure, pore structure, and chemical state of samples were analyzed using X-ray diffractometer (XRD, Shimadzu XRD-7000), Brunauer–Emmett–Teller (BET, Quantachrome Autosorb-iQ), and X-ray photoelectron spectroscopy (XPS, JPS-9010 MC), respectively.2.4 Microwave absorption and electromagnetic parameters measurement
To investigate the electromagnetic wave absorption performance, the mixture of sample and paraffin (50 wt% mass loading) was pressed into testing ring with an inner diameter of 3 mm and an outer diameter of 7 mm. Additionally, CoNi/C-40 and CoNi/C-60 were prepared by uniformly mixing CoNi/C in the paraffin with filler loading of 40 wt% and 60 wt%, respectively. The electromagnetic parameters of samples could be detected by a PNA-L Vector Network Analyzer (Keysight, N5232B) over the range of 2–18 GHz. The RL value of samples was calculated by the transmission line theory:25–27
 | (1) |
 | (2) |
3. Results and discussion
3.1 Material synthesis and structural characterizations
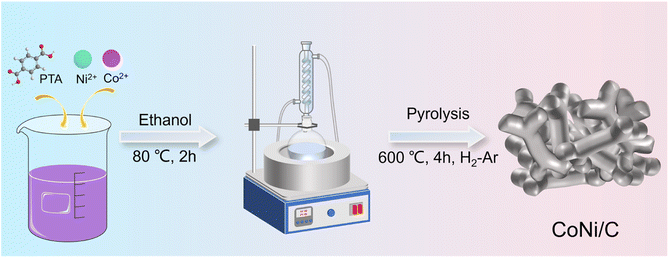
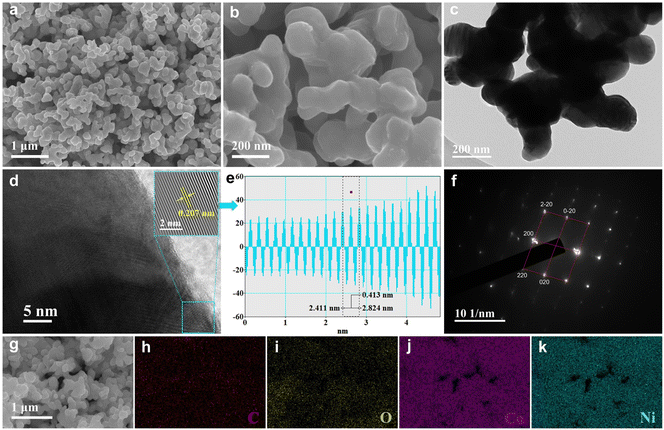
The detailed synthesis procedure of the CoNi/C composites is illustrated in Fig. 1. First, Co2+ and Ni2+ could coordinate with PTA and obtain CoNi-MOF precursors. In a pyrolysis process with an atmosphere of H2–Ar (10% H2), CoNi-MOF precursors could be transformed into CoNi alloys with an irregular rod-like structure.As shown in Fig. 2a and b, SEM image reveals that the CoNi/C consists of many irregular nanorods. It can be seen that Co3Ni/C and CoNi3/C exhibit a rod-like structure similar to that of CoNi/C (Fig. S1†). TEM image (Fig. 2c) also shows the same morphology. As depicted in Fig. 2d, the microstructure of CoNi/C is further investigated by the high-resolution TEM (HRTEM). The inverse fast Fourier transform (IFFT) pattern (the inset in Fig. 2d) and the line profiles (Fig. 2e) display a lattice fringe spacing of 0.207 nm, which corresponds to the (111) plane of Co0.5Ni0.5 (PDF#04-004-8490). In addition, the selected area electron diffraction (SAED) pattern of CoNi/C shows bright diffraction spots aligned in a line (Fig. 2f), indicating the single crystalline structure of CoNi/C. The diffraction spots are indexed to (200), (220), and (020) planes of CoNi alloy, which is in accordance with the XRD results. As shown in Fig. 2g–k, the elemental mapping images of CoNi/C indicate that the elements of C, O, Co, and Ni are homogeneously distributed on the CoNi/C surface.
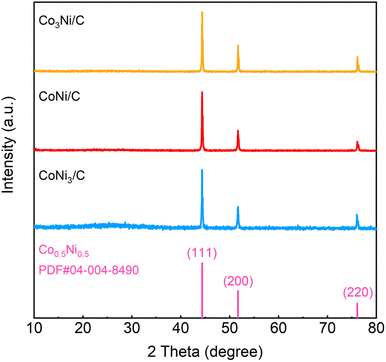
Furthermore, XRD spectra were conducted to determine the lattice structures of CoNi-MOF, Co3Ni/C, CoNi/C, and CoNi3/C composites. XRD pattern displays the characteristic diffraction peaks of CoNi-MOF (Fig. S2†). As depicted in Fig. 3, the diffraction peaks located at 44.4°, 51.7°, and 76.1° are corresponding to the (111), (200), and (220) planes of Co0.5Ni0.5 (PDF#04-004-8490), confirming the formation of CoNi alloy. This result is consistent with the TEM results, further demonstrating that constructing CoNi alloys via CoNi-MOF precursors is an effective strategy. In addition, CoNi/C-500 and CoNi/C-700 exhibit a crystal structure similar to that of CoNi/C (Fig. S3†).
To reveal the elemental compositions and chemical state of CoNi/C, the XPS is performed. As depicted in Fig. 4a, XPS survey spectrum of CoNi/C detects obvious signals of C 1s, O 1s, Co 2p, and Ni 2p, which is coincident with the results of elemental mapping analysis. In addition, the atomic contents of Co and Ni elements can be found to be 10.93 at% and 11.15 at%, respectively, which are close to the initial feed ratios. The C and O elements possess high atomic contents of 44.69% and 33.23% in the CoNi/C, respectively. The XPS analysis results further indicate a slight reduction in the atomic content of Co and Ni as the pyrolysis temperature increases (Fig. S4 and Table S1†). As shown in Fig. 4b, the high-resolution C 1s spectrum shows the two peaks at 284.6 and 285.7 eV, ascribing to the C–C and C–O bonds, respectively.2,16,28 The high-resolution Co 2p spectrum in Fig. 4c shows two pairs of doublet peaks located at 775–790 eV and 792–805 eV, which can be attributed to Co 2p3/2 and Co 2p1/2, respectively.29 For the Co 2p3/2 spin–orbit, three main peaks located at 779.2, 781.2, and 786.3 eV can be assigned to the Co0, Co2+, and satellite signal peaks, respectively.30 Likewise, Ni 2p3/2 XPS spectrum of CoNi/C (Fig. 4d) displays three peaks located at 853.0, 855.5, and 861.2 eV, corresponding to the Ni0, Ni2+, and satellite signal peaks, respectively.29,31 The existence of metallic Co0 and Ni0 proves the formation of CoNi bimetallic alloy.32 Besides, the peaks of Co2+ and Ni2+ are also defected, demonstrating the presence of metal oxidation states. This result is attributed to the formation of a high valence oxide passivation layer due to the unavoidable oxidation on the surface of nano-alloys.28,33,34 The pore structure of CoNi/C was measured by BET analysis. The CoNi/C shows type-IV isotherms with a type H3 hysteresis loop, implying the presence of mesoporous (Fig. S5†). The BET surface area of CoNi/C is 52.3 m2 g−1 with a main pore size of approximately 4.3 nm.
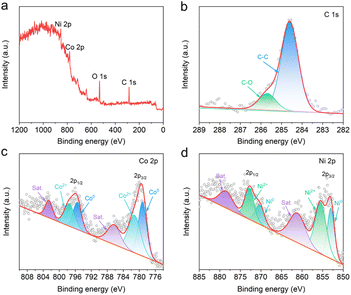 | ||
| Fig. 4 XPS spectra of CoNi/C. (a) Survey spectrum. High-resolution (b) C 1s, (c) Co 2p, and (d) Ni 2p spectra. | ||
3.2 Electromagnetic wave absorption performance
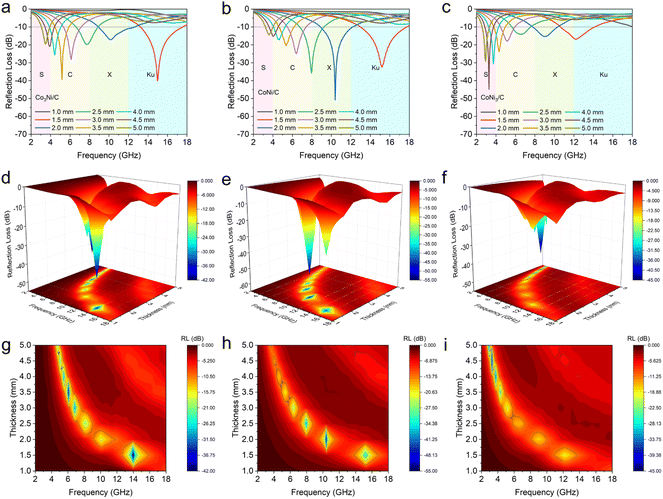
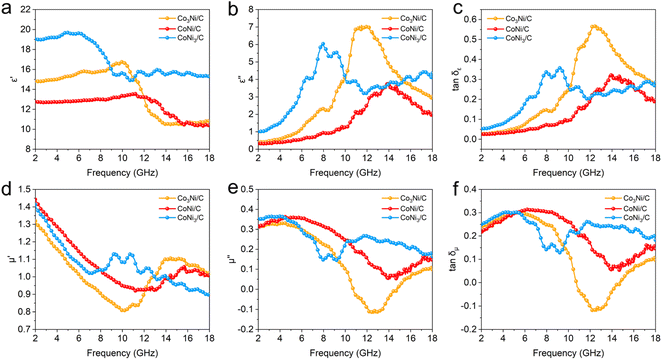
The RL and EAB values are important parameters for evaluating the electromagnetic wave absorption performance of nanomaterials.10 The calculated RL values of Co3Ni/C, CoNi/C, and CoNi3/C are shown in Fig. 5a–i. Co3Ni/C, with a low thickness of 1.5 mm, exhibits a strong RLmin of −40.08 dB at 14.98 GHz and a maximum EAB of 4.40 GHz (13.20–17.60 GHz) with a filler loading of 50 wt% (Fig. 5a). Under the same filler mass, the CoNi/C demonstrates an optimal RLmin of −50.80 dB at 10.40 GHz with a low thickness of 2.0 mm and a maximum EAB of 4.77 GHz (12.99–17.76 GHz) at 1.5 mm (Fig. 5b). As depicted in Fig. 5c, the RLmin of CoNi3/C reaches −44.84 dB at 3.28 GHz in the S band and the maximum EAB is 3.48 GHz (10.65–14.13 GHz). The corresponding three-dimensional (3D) and contour RL representations of Co3Ni/C, CoNi/C, and CoNi3/C are shown in Fig. 5d–i. In addition, CoNi/C-500, CoNi/C-700, CoNi/C-40, and CoNi/C-60 exhibit the RLmin values of −13.66 dB at 17.12 GHz (thickness of 1.5 mm), −22.02 dB at 14.04 GHz (thickness of 2.0 mm), −20.34 dB at 5.92 GHz (thickness of 5.0 mm), and −35.35 dB at 16.52 GHz (thickness of 2.0 mm), respectively (Fig. S6 and S7†). The corresponding EAB values of CoNi/C-500, CoNi/C-700, CoNi/C-40, and CoNi/C-60 are measured to be 2.88, 3.48, 5.82, and 5.96 GHz, respectively. The results indicate that the CoNi/C exhibits excellent electromagnetic wave absorption performance and broad EAB, surpassing most advanced MOF-based absorbers reported in the literature (Table S2†).To investigate the mechanism of electromagnetic wave absorption, the real parts (ε′ and μ′), imaginary parts (ε′′ and μ′′), dielectric loss tangent (tan![[thin space (1/6-em)]](https://www.rsc.org/images/entities/char_2009.gif) δε), and magnetic loss tangent (tan
δε), and magnetic loss tangent (tan![[thin space (1/6-em)]](https://www.rsc.org/images/entities/char_2009.gif) δμ) are displayed in Fig. 6. Generally, the real parts represent the storage ability of the electric and magnetic energy and imaginary parts denote the loss capability, such as energy dissipation, dielectric and magnetic loss.2,35,36 Fig. 6a and b show the complex dielectric constants of Co3Ni/C, CoNi/C, and CoNi3/C. In the frequency range of 2.0–18.0 GHz, the ε′ values of Co3Ni/C, CoNi/C, and CoNi3/C decrease from 14.8 to 10.8, 12.8 to 10.4 and 19.0 to 15.3, respectively, illustrating a decreasing trend with increasing frequency. This result is related to the frequency dispersion behavior.37 It is worth noting that the Co3Ni/C, CoNi/C, and CoNi3/C display obvious relaxation peaks at ∼11.6, 13.9, and 7.9 GHz, respectively, which can be attributed to the polarization behaviors at CoNi alloy/C heterogeneous interface.37,38 In addition, it is found that the tan
δμ) are displayed in Fig. 6. Generally, the real parts represent the storage ability of the electric and magnetic energy and imaginary parts denote the loss capability, such as energy dissipation, dielectric and magnetic loss.2,35,36 Fig. 6a and b show the complex dielectric constants of Co3Ni/C, CoNi/C, and CoNi3/C. In the frequency range of 2.0–18.0 GHz, the ε′ values of Co3Ni/C, CoNi/C, and CoNi3/C decrease from 14.8 to 10.8, 12.8 to 10.4 and 19.0 to 15.3, respectively, illustrating a decreasing trend with increasing frequency. This result is related to the frequency dispersion behavior.37 It is worth noting that the Co3Ni/C, CoNi/C, and CoNi3/C display obvious relaxation peaks at ∼11.6, 13.9, and 7.9 GHz, respectively, which can be attributed to the polarization behaviors at CoNi alloy/C heterogeneous interface.37,38 In addition, it is found that the tan![[thin space (1/6-em)]](https://www.rsc.org/images/entities/char_2009.gif) δε value of CoNi/C is higher than that of CoNi3/C in the frequency range between 12.0 and 16.0 GHz (Fig. 6c), indicating a higher polarization loss capability.37 As shown in Fig. 6d–f, it can be seen that the CoNi/C has the high μ and μ′′ values in the frequency range below 7.8 GHz, demonstrating its good impedance matching.39 Meanwhile, the tan
δε value of CoNi/C is higher than that of CoNi3/C in the frequency range between 12.0 and 16.0 GHz (Fig. 6c), indicating a higher polarization loss capability.37 As shown in Fig. 6d–f, it can be seen that the CoNi/C has the high μ and μ′′ values in the frequency range below 7.8 GHz, demonstrating its good impedance matching.39 Meanwhile, the tan![[thin space (1/6-em)]](https://www.rsc.org/images/entities/char_2009.gif) δμ values of the Co3Ni/C, CoNi/C, and CoNi3/C display a similar trend with the μ′′ values. Compared with the tan
δμ values of the Co3Ni/C, CoNi/C, and CoNi3/C display a similar trend with the μ′′ values. Compared with the tan![[thin space (1/6-em)]](https://www.rsc.org/images/entities/char_2009.gif) δε values of CoNi/C, it can be concluded that the loss of CoNi/C are mainly from magnetic loss in the frequency range of 2.0–11.9 GHz, while in 12.0–18.0 GHz mainly comes from dielectric loss. Similarly, it can be observed that the tan
δε values of CoNi/C, it can be concluded that the loss of CoNi/C are mainly from magnetic loss in the frequency range of 2.0–11.9 GHz, while in 12.0–18.0 GHz mainly comes from dielectric loss. Similarly, it can be observed that the tan![[thin space (1/6-em)]](https://www.rsc.org/images/entities/char_2009.gif) δμ values of Co3Ni/C and CoNi3/C are higher than the tan
δμ values of Co3Ni/C and CoNi3/C are higher than the tan![[thin space (1/6-em)]](https://www.rsc.org/images/entities/char_2009.gif) δε values in the low frequency range, implying that magnetic loss plays a predominant role in the lossy mechanism.28
δε values in the low frequency range, implying that magnetic loss plays a predominant role in the lossy mechanism.28
Generally, the Debye relaxation theory can be applied to analyze the dielectric polarization relaxation process through the following formula:40–42
 | (3) |
4. Conclusions
In summary, we report a facile thermal reduction method to fabricate CoNi bimetallic alloys/carbon composites (Co3Ni/C, CoNi/C, and CoNi3/C) with irregular rod-like structures. Benefiting from the tunable chemical composition and structure of CoNi-MOFs, the electromagnetic parameters of composites can be effectively controlled by modulating the molar ratio of Co and Ni. In addition, owing to the strong interfacial interaction of CoNi alloy and carbon, the optimized CoNi/C exhibits good impedance matching. As an electromagnetic wave absorber, the CoNi/C with a filler loading of 50 wt% delivers an optimal RLmin of −50.80 dB at 10.40 GHz and a maximum EAB of 4.77 GHz at a low thickness of 1.5 mm. Interestingly, the CoNi3/C also possesses an impressive RLmin of −44.84 dB at 3.28 GHz in the S band. The present work provides a feasible method to controllably fabricate MOF-derived MAMs.Conflicts of interest
There are no conflicts to declare.Acknowledgements
This work was supported by the Science and Technology Foundation of Lanzhou (2021-1-40), the Central Guidance on Local Science and Technology Development Fund of Gansu Province (23ZYQA314), and the LICP Cooperation Foundation for Young Scholars (HZJJ23-10).References
- S. Hou, Y. Wang, F. Gao, H. Yang, F. Jin, L. Ren, Q. Wu, H. Ge and Y. Wang, Chem. Eng. J., 2023, 471, 144779 CrossRef CAS.
- C. Wen, X. Li, R. Zhang, C. Xu, W. You, Z. Liu, B. Zhao and R. Che, ACS Nano, 2022, 16, 1150–1159 CrossRef CAS PubMed.
- Y. Li, X. Liu, X. Nie, W. Yang, Y. Wang, R. Yu and J. Shui, Adv. Funct. Mater., 2019, 29, 1807624 CrossRef.
- B. Li, Y. Yang, N. Wu, S. Zhao, H. Jin, G. Wang, X. Li, W. Liu, J. Liu and Z. Zeng, ACS Nano, 2022, 16, 19293–19304 CrossRef CAS PubMed.
- M. Cao, X. Wang, W. Cao, X. Fang, B. Wen and J. Yuan, Small, 2018, 14, 1800987 CrossRef PubMed.
- B. Zhao, Y. Li, Q. Zeng, L. Wang, J. Ding, R. Zhang and R. Che, Small, 2020, 16, 2003502 CrossRef CAS PubMed.
- K. Hu, H. Wang, X. Zhang, H. Huang, T. Qiu, Y. Wang, C. Zhang, L. Pan and J. Yang, Chem. Eng. J., 2021, 408, 127283 CrossRef CAS.
- K. Cao, X. Yang, R. Zhao and W. Xue, ACS Appl. Mater. Interfaces, 2023, 15, 9685–9696 CrossRef CAS PubMed.
- R. Cheng, Y. Wang, X. Di, Z. Lu, P. Wang, M. Ma and J. Ye, J. Colloid Interface Sci., 2022, 609, 224–234 CrossRef CAS PubMed.
- N. Wang, Y. Wang, Z. Lu, R. Cheng, L. Yang and Y. Li, Carbon, 2023, 202, 254–264 CrossRef CAS.
- Y. Liu, Y. Wang, N. Wu, M. Han, W. Liu, J. Liu and Z. Zeng, Nano-Micro Lett., 2023, 15, 240 CrossRef CAS PubMed.
- Y. Han, J. Yuan, Y. Zhu, Q. Wang, L. Li and M. Cao, J. Colloid Interface Sci., 2022, 609, 746–754 CrossRef CAS PubMed.
- B. Li, N. Wu, Q. Wu, Y. Yang, F. Pan, W. Liu, J. Liu and Z. Zeng, Adv. Funct. Mater., 2023, 33, 2307301 CrossRef CAS.
- T. Zhao, Y. Liu, H. Wan, Z. Li, Y. Wu and H. Yan, Mater. Chem. Phys., 2023, 310, 128486 CrossRef CAS.
- Z. Chen, K. Tian, C. Zhang, R. Shu, J. Zhu, Y. Liu, Y. Huang and X. Liu, J. Colloid Interface Sci., 2022, 616, 823–833 CrossRef CAS PubMed.
- H. Zhang, Y. Zhao, X. Zuo, H. Huang, C. Sun, Z. Fan and L. Pan, Chem. Eng. J., 2023, 467, 143414 CrossRef CAS.
- Q. Liu, Q. Cao, H. Bi, C. Liang, K. Yuan, W. She, Y. Yang and R. Che, Adv. Mater., 2016, 28, 486–490 CrossRef CAS PubMed.
- M. A. Aslam, R. Ahsen, W. Uddin, S. ur Rehman, M. S. Khan, M. Bilal, N. Li and Z. Wang, Eur. Phys. J. Plus, 2022, 137, 480 CrossRef CAS.
- H. Qiu, X. Zhu, P. Chen, J. Liu and X. Zhu, Compos. Commun., 2020, 20, 100354 CrossRef.
- J. Tao, R. Tan, L. Xu, J. Zhou, Z. Yao, Y. Lei, P. Chen, Z. Li and J. Z. Ou, Small Methods, 2022, 6, 2200429 CrossRef CAS PubMed.
- F. Wu, M. Ling, L. Wan, P. Liu, Y. Wang, Q. Zhang and B. Zhang, Chem. Eng. J., 2022, 435, 134905 CrossRef CAS.
- Y. Ren, Y. Zhang, Q. Zheng, L. Wang and W. Jiang, Carbon, 2023, 206, 226–236 CrossRef CAS.
- S. Ren, H. Yu, L. Wang, Z. Huang, T. Lin, Y. Huang, J. Yang, Y. Hong and J. Liu, Nano-Micro Lett., 2022, 14, 68 CrossRef CAS PubMed.
- X. Zhang, X.-L. Tian, Y. Qin, J. Qiao, F. Pan, N. Wu, C. Wang, S. Zhao, W. Liu, J. Cui, Z. Qian, M. Zhao, J. Liu and Z. Zeng, ACS Nano, 2023, 17, 12510–12518 CrossRef CAS PubMed.
- C. Xu, P. Liu, Z. Wu, H. Zhang, R. Zhang, C. Zhang, L. Wang, L. Wang, B. Yang, Z. Yang, W. You and R. Che, Adv. Sci., 2022, 9, 2200804 CrossRef CAS PubMed.
- P. Yin, G. Wu, Y. Tang, S. Liu, Y. Zhang, G. Bu, J. Dai, Y. Zhao and Y. Liu, Chem. Eng. J., 2022, 446, 136975 CrossRef CAS.
- C. Liu, Z. Zeng, J. Qiao, Q. Wu, W. Liu, F. Gao and J. Liu, Carbon, 2023, 213, 118277 CrossRef CAS.
- X. Zhang, X. Tian, J. Qiao, X. Fang, K. Liu, C. Liu, J. Lin, L. Li, W. Liu, J. Liu and Z. Zeng, Small, 2023, 19, 2302686 CrossRef CAS PubMed.
- W. Wang, K. Nan, H. Zheng, Q. Li and Y. Wang, Carbon, 2023, 210, 118074 CrossRef CAS.
- N. He, Z. He, L. Liu, Y. Lu, F. Wang, W. Wu and G. Tong, Chem. Eng. J., 2020, 381, 122743 CrossRef CAS.
- Y. Lv, J. Tian, Z. Chen, J. Wang, L.-A. Ma, L. Zhang, S. Chen, Q. Wang and X. Ye, Chem. Eng. J., 2023, 478, 147413 CrossRef CAS.
- M. Sun, D. Wang, Z. Xiong, Z. Zhang, L. Qin, C. Chen, F. Wu and P. Liu, J. Mater. Sci. Technol., 2022, 130, 176–183 CrossRef CAS.
- L.-L. Liang, Z. Liu, L.-J. Xie, J.-P. Chen, H. Jia, Q.-Q. Kong, G.-H. Sun and C.-M. Chen, Carbon, 2021, 171, 142–153 CrossRef CAS.
- Z. Su, S. Yi, W. Zhang, L. Tian, Y. Zhang, S. Zhou, B. Niu and D. Long, Adv. Electron. Mater., 2022, 9, 2201159 CrossRef.
- W. Ma, R. Yang and T. Wang, ACS Appl. Nano Mater., 2020, 3, 8319–8327 CrossRef CAS.
- J. Yang, Z. Liu, H. Zhou, L. Jia, A. Wu and L. Jiang, ACS Appl. Mater. Interfaces, 2022, 14, 12375–12384 CrossRef CAS PubMed.
- X. Meng, L. He, Y. Liu, Y. Yu and W. Yang, Carbon, 2022, 194, 207–219 CrossRef CAS.
- H. Wang, F. Meng, F. Huang, C. Jing, Y. Li, W. Wei and Z. Zhou, ACS Appl. Mater. Interfaces, 2019, 11, 12142–12153 CrossRef CAS PubMed.
- J. Li, F. Zhang, H. Lu, W. Guo, X. He and Y. Yuan, Carbon, 2021, 181, 358–369 CrossRef CAS.
- W. Zhang, G. Tan, J. Hu, Q. Wang, W. Yan and Q. Man, Chem. Eng. J., 2023, 478, 147414 CrossRef CAS.
- X. Zhang, Y. Zhang, J. He, H. Li, Y. Bai and S. Gao, Fuel, 2023, 331, 125811 CrossRef CAS.
- X. Wang, P. Ou, Q. Zheng, L. Wang and W. Jiang, Small, 2023, 2307473, DOI:10.1002/smll.202307473.
- G. Yu, M. Ye, A. Han, Q. Liu, Y. Su and C. Chen, J. Alloys Compd., 2023, 939, 168592 CrossRef CAS.
- X. Wang, J.-C. Shu, X.-M. He, M. Zhang, X.-X. Wang, C. Gao, J. Yuan and M.-S. Cao, ACS Sustainable Chem. Eng., 2018, 6, 14017–14025 CrossRef CAS.
- Y. Wang, X. Di, Z. Lu and X. Wu, J. Colloid Interface Sci., 2021, 589, 462–471 CrossRef CAS PubMed.
- W. Wang, H. Zhang, Y. Zhao, J. Wang, H. Zhao, P. Li, J. Yun, Z. Deng, Z. Zhang, J. Tian, J. Yan, W. Zhao and F. Zhang, Chem. Eng. J., 2021, 426, 131667 CrossRef CAS.
Footnote |
| † Electronic supplementary information (ESI) available. See DOI: https://doi.org/10.1039/d3ra08896k |
| This journal is © The Royal Society of Chemistry 2024 |

