 Open Access Article
Enhanced electrochemical performance of Ce-MOF/h-CeO2 composites for high-capacitance energy storage applications†
Ruhani Baweja a,
Monika Verma
 bc,
Sanjeev Gautam
 *b,
Shailesh Upretid and
Navdeep Goyal
 a
a
aDepartment of Physics, Panjab University, Chandigarh 160014, India
bAdvanced Functional Materials Lab, Dr S. S. B. University Institute of Chemical Engineering & Technology, Panjab University, Chandigarh 160014, India. E-mail: sgautam@pu.ac.in; Tel: +91 97797 13212
cEnergy Research Centre, Panjab University, Chandigarh 160014, India
dCharge CCCV (C4V), Center of Excellence, Binghamton University, 45 Murray Hill Road, Vestal, NY 13850, USA
First published on 3rd June 2024
Abstract
The escalating demand for energy storage underscores the significance of supercapacitors as devices with extended lifespans, high energy densities, and rapid charge–discharge capabilities. Ceria (CeO2), known for its exceptional properties and dual oxidation states, emerges as a potent material for supercapacitor electrodes. This study enhances its capacitance by integrating it with Metal–Organic Frameworks (MOFs), carbon-rich compounds noted for their good conductivity. In our research, hollow ceria (h-ceria) is synthesized via hydrothermal methods and amalgamated with Ce-MOF, employing 2,6-dinaphthalene dicarboxylic acid as a ligand, to fabricate Ce-MOF@h-CeO2 composites. The structural and morphological characteristics of the composite are methodically examined using X-ray Diffraction (XRD), Field Emission Scanning Electron Microscopy (FE-SEM), and Fourier-Transform Infrared (FT-IR) spectroscopy. The band gap of the materials is ascertained through UV-Diffuse Reflectance Spectroscopy (UV-DRS). Electrochemical behavior and redox properties of the Ce-MOF composites are explored using Cyclic Voltammetry (CV), Galvanostatic Charge and Discharge (GCD), and Electrochemical Impedance Spectroscopy (EIS), providing insights into the material's stability. Electrochemical characterization of the composite reveals maximum specific capacitance, energy density and power density are 2643.78 F g−1 at a scan rate of 10 mV s−1, 249.22 W h kg−1, and 7.9 kW kg−1, respectively. Additionally, the specific capacitance of Ce-MOF synthesized with a 2,6-dinaphthalene dicarboxylic acid (NDC) ligand reaches 995.59 F g−1, surpassing that of Ce-MOF synthesized using a 1,3,5-tricarboxylic acid (H3BTC) ligand. These findings highlight the promising economic potential of high-performance, environmentally sustainable, and cost-effective energy storage devices. The innovative Ce-MOF@h-CeO2 composite materials at the core of this research pave the way for advancing the field of energy storage solutions.
1 Introduction
The burgeoning energy demands of the modern era, driven by the increased use of electronic devices, are leading to the depletion of fossil fuels. Concurrently, the detrimental impact of non-renewable energy sources on both humanity and the environment necessitates a re-evaluation of energy sources, propelling a shift towards renewable resources. These alternatives include wind, hydrothermal, and solar energy (either harnessed through photovoltaic systems1 or through concentrated solar power plants2), as well as thermoelectric energy3 and others.4,5 This escalating energy requirement has drawn attention towards energy storage devices, particularly supercapacitors and batteries.6–8 Supercapacitors, being an advanced technology, are preferred for their exceptional characteristics such as power density, long cycle life, rapid charge–discharge rates, and high specific capacity.9,10Although specific capacity depends upon many factors, electric double-layer capacitors (EDLCs) and pseudocapacitors generally have higher capacities compared to hybrid supercapacitors.10,11 EDLCs store charge via the reversible adsorption of electrolyte ions at the electrode–electrolyte interface,12,13 offering rapid charging and longer cycle stability, albeit with lower energy density. Pseudocapacitors, in contrast, utilize reversible faradaic reactions for charge storage,14 providing higher energy density and specific capacity but at the expense of cycle life and conductivity. Hybrid supercapacitors combine the attributes of both EDLCs and pseudocapacitors.15 Potential materials for EDLC electrodes include carbon-based substances like graphene and carbon nanotubes (CNT), while conductive polymers16 and transition metal oxides/hydroxides17 are suitable for pseudocapacitor electrodes. However, there is a continuous search for materials that can further enhance the efficiency of supercapacitors, including hybridizing high surface area materials from EDLCs with compounds used in pseudocapacitor electrodes.18
Considering suitable materials, metal–organic frameworks (MOFs) are emerging as a novel class of porous materials composed of metal ions or clusters coordinated to organic ligands, forming diverse structural dimensions.19,20 Their distinctive properties such as high surface area, porosity, thermal stability, and modifiability make them suitable for various energy and environmental applications.21 Nevertheless, their electrochemical application is limited due to low electrical conductivity.22 Transforming MOFs into other materials like metal oxides, porous carbon, metal hydroxides,23 phosphides,24 sulfides,25 selenides,26 or composites,27 has been a researched focus to overcome these constraints. For example, doping Ni-based MOFs with Zn ions28 significantly increased their capacitance.
Cerium oxide (CeO2), known as ceria, is noted for its affordability, non-toxicity, abundance, and ability to undergo reversible transitions between Ce3+ and Ce4+ states, alongside high oxygen storage capacity,29 making it suitable for supercapacitor applications. Reported30 specific capacitance of cerium oxide sheets is 481 F g−1 at a scan rate of 5 mV s−1, retaining about 83% capacity after 500 cycles. Transition metal-doped MOFs have shown promise as supercapacitor electrodes, with specific capacitance values ranging significantly.31 Yet, lanthanide-based MOFs, such as Ce-MOF, have been less explored, with Ce-MOF showing superior performance and retention.20 Combining ceria with MOFs (CeO2-MOFs) offers a novel approach to enhance supercapacitor efficiency.
This research details the development of a supercapacitor electrode, ceria-based Ce-MOF using the NDC ligand, and the successful creation of Ce-MOF@h-CeO2 composites with a distinctive hollow structure. The hypothesis posits that Ce-MOF contributes to redox reactions and ion diffusion, while the CeO2 component is responsible for boosting the electrical conductivity of the composite.
This investigation involves conducting diverse characterizations, including XRD and FE-SEM, to ascertain the properties of the material under examination. Furthermore, cyclic voltammetry studies are conducted to identify the specific capacity of the samples. The primary goal of this research is to identify materials with high capacity to fulfill energy requirements. The specific capacitance is expected to escalate with the addition of h-ceria into the Ce-MOF. Moreover, the comparison between the capacitance of Ce-MOF with 2,6-dinaphthalene dicarboxylic acid ligand and 1,3,5-tricarboxylic acid is made using CV analysis.
2 Experimental details
2.1 Materials
All reagents were obtained from Sigma-Aldrich with a 4 N purity and were used as received. The reagents included cerium nitrate hexahydrate (Ce(NO3)3·6H2O), acetic acid (CH3COOH), ethylene glycol (C2H6O2), polyvinyl pyrrolidone (PVP, K-25), and 2,6-naphthalene dicarboxylic acid (C12H8O4).2.2 Synthesis of hollow ceria
Hollow ceria (h-CeO2) was synthesized following a modified version of the method reported by Jiang et al.32 Initially, 2.0 g of Ce(NO3)3·6H2O and 16 ml of deionized water were mixed in 40 ml of ethylene glycol in a beaker and stirred for approximately one hour to achieve a homogeneous solution. Subsequently, 2 ml of acetic acid was gradually added and stirred for 15 minutes. Next, 1.6 g of PVP (K-25) was added and stirred for 20 minutes. The mixture was then transferred to a 100 ml Teflon-lined stainless-steel autoclave. The autoclave was maintained at 180 °C for 22 hours before cooling to room temperature. The resulting products were centrifuged, repeatedly rinsed with deionized water about 6–7 times, dried at 80 °C for 14 hours, and finally calcined at 500 °C for 4 hours in air to yield CeO2 microspheres.2.3 Synthesis of Ce-MOF
Ce-MOF was synthesized using a hydrothermal method.33 A mixture of 0.04 g Ce(NO3)3·6H2O and 0.2 g of 2,6-naphthalene dicarboxylic acid in 40 ml of deionized water was sonicated for about 30 minutes to form solution ‘X’. This solution was then transferred to a 100 ml Teflon-lined stainless-steel autoclave and heated at 60 °C for 20 hours. After naturally cooling to room temperature, the product was centrifuged, washed with deionized water approximately 6–7 times, and oven dried at 60 °C for 24 hours.2.4 Synthesis of Ce-MOF/h-CeO2
The schematic for the synthesis of Ce-MOF/h-CeO2 composites is illustrated in Fig. 1.33 Solution ‘X’ was prepared as described, and a predetermined quantity of h-CeO2 (Y = 0.05, 0.10 g) was added and thoroughly mixed. The solution was then transferred to a 100 ml Teflon-lined stainless-steel autoclave and maintained at 60 °C for 20 hours. Upon cooling to room temperature, the product was centrifuged, washed with deionized water, and dried at 80 °C for 24 hours. The resultant samples were denoted as Ce-MOF/h-CeO2-1 and Ce-MOF/h-CeO2-2, respectively.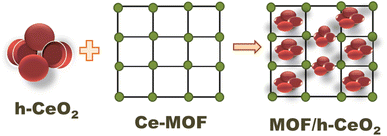 | ||
| Fig. 1 Schematic diagram of the synthesis route of Ce-MOF@h-CeO2 with the hollow structure using hydrothermal method. | ||
3 Characterization
3.1 Materials characterization
The structural and compositional characteristics of the fabricated samples were examined using X-ray diffraction (XRD) on a PANalytical (Netherlands) X'pert Pro model. Measurements were taken over a Bragg angle range of 5° to 80° at a scanning rate of 1° min−1, ensuring detailed structural resolution suitable for Rietveld refinement. The XRD data facilitated crystal phase identification and were further analyzed for Rietveld refinement using the FullProf Suite-2021.34Field Emission Scanning Electron Microscopy (FE-SEM) images and Energy Dispersive Spectroscopy (EDS) analyses of the synthesized samples were conducted on a Hitachi (Japan) Model-SU 8010 series, offering a resolution of 1 nm at a landing voltage of 1 kV for morphological studies. UV-DRS spectroscopy was employed to determine the band gaps of the samples, using BaSO4 as a reference. This was performed on a UV-2600 Shimadzu spectrophotometer across the wavelength range of 200–700 nm. For functional group identification, a PerkinElmer Spectrum-400 FT-IR spectrometer was used alongside KBr powder as the standard reference. The samples were thoroughly mixed with KBr, finely ground to produce a uniform powder, and subsequently compressed into pellets.
3.2 Electrochemical measurements
Electrochemical characterization of the prepared samples was performed using cyclic voltammetry, galvanostatic charge–discharge, and electrochemical impedance spectroscopy techniques to determine the conductivity of the nanocomposites. These measurements were conducted using a Potentiostat/Galvanostat M204 (Metrohm Autolab, central facility lab (TEQIP-III), Dr SSB UICET, Panjab University, Chandigarh).35 The experimental setup utilized a three-electrode system, comprising a platinum coil counter-electrode, an Ag/AgCl reference electrode, and a working electrode.The working electrode was prepared by depositing an ink, made from the sample, onto a glassy carbon electrode using the drop casting method. The ink was prepared by dissolving 3 mg of the active material in ethanol to form a homogeneous mixture after sonicating for 30 minutes. Using a micropipette, the ink was drop-cast onto the working electrode and allowed to dry to form a uniform layer. This process was repeated 3–4 times until a uniform layer was formed. The electrochemical analysis using CV was conducted over a potential range of −0.1 V to 1.0 V at various scan rates, i.e. 10, 20, 30, 40, 50, and 100 mV s−1, and GCD technique at various current densities of 1, 2, 3, 3.5, and 4 A g−1. The samples were used without a binder as the material is quite stable, adheres easily to the working electrode and maintain a good stability (contstant electric contact) at the interface between working electrode and deposit materials.
4 Results and discussion
4.1 X-ray diffraction measurements and Rietveld analysis
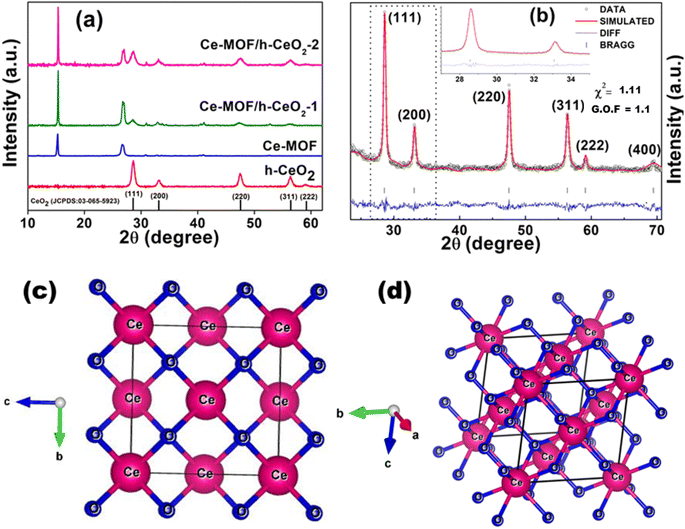
X-ray diffraction (XRD) was employed to examine the structure of the materials, evaluating aspects such as crystallinity, nanoparticle size, phase purity, and lattice parameters.The XRD patterns of h-CeO2 were consistent with the cubic phase of the cerium oxide structure (JCPDS No. 03-065-5923).36 The peaks at 28.6°, 33.1°, 47.5°, 58.9°, and 69.4° correspond to the (111), (200), (220), (311), and (222) planes, respectively, as depicted in Fig. 2(a). The dominant peak at 2θ = 28.6° corresponds to the (111) plane. Ce-MOF exhibited characteristic diffraction peaks at 11.83°, 15.24°, 26.73°, and 30.81°, which were slightly shifted (revealing substitutional doping of larger ceria atomic radii) from those reported in the literature.33 The Ce-MOF/h-CeO2 composites displayed distinct peaks for both h-CeO2 and Ce-MOF structures, with no impurity peaks, indicating single-phase (purity) and good crystallinity.
Crystallite size was determined using Scherrer's equation: D = kλ/β![[thin space (1/6-em)]](https://www.rsc.org/images/entities/char_2009.gif)
![[thin space (1/6-em)]](https://www.rsc.org/images/entities/char_2009.gif) cos
cos![[thin space (1/6-em)]](https://www.rsc.org/images/entities/char_2009.gif)
![[thin space (1/6-em)]](https://www.rsc.org/images/entities/char_2009.gif) θ, where D is the crystallite size (nm); k is the shape factor (0.9); λ is the X-ray wavelength (0.154056 nm for Cu Kα radiation); θ is the Bragg angle; and β is the full width at half maximum (FWHM in radians).37 The average crystallite size of h-ceria is determined to be 18.88 nm.
θ, where D is the crystallite size (nm); k is the shape factor (0.9); λ is the X-ray wavelength (0.154056 nm for Cu Kα radiation); θ is the Bragg angle; and β is the full width at half maximum (FWHM in radians).37 The average crystallite size of h-ceria is determined to be 18.88 nm.
Rietveld refinement was used for quantitative phase analysis,38,39 adjusting XRD data using standard lattice parameters. The experimental XRD patterns were precisely fitted by refining the structural parameters of simulated patterns (Fig. 2(b)). FullProf 2021 software was used for refinement, and step-scan data were recorded from 20° to 80° (step size 0.017°). The refinement was executed considering the cubic crystal structure (space group Fm![[3 with combining macron]](https://www.rsc.org/images/entities/char_0033_0304.gif) m) of CeO2
m) of CeO2![[thin space (1/6-em)]](https://www.rsc.org/images/entities/char_2009.gif) 40 with standard lattice parameters a = b = c = 5.4037 Å. The calculated lattice parameters were a = b = c = 5.4128 Å, and the unit cell volume was 158.589 Å3. The crystal structure (Fig. 2(c) and (d)) was generated from the cif file obtained from the simulated pattern, revealing the exact position coordinates of one cerium atom and two oxygen atoms present in the ceria system. This cif file is deposited at CCDC, UK (2359413) and also included in the ESI.† The XRD pattern confirms the phase corresponding to the space group “Fm
40 with standard lattice parameters a = b = c = 5.4037 Å. The calculated lattice parameters were a = b = c = 5.4128 Å, and the unit cell volume was 158.589 Å3. The crystal structure (Fig. 2(c) and (d)) was generated from the cif file obtained from the simulated pattern, revealing the exact position coordinates of one cerium atom and two oxygen atoms present in the ceria system. This cif file is deposited at CCDC, UK (2359413) and also included in the ESI.† The XRD pattern confirms the phase corresponding to the space group “Fm![[3 with combining macron]](https://www.rsc.org/images/entities/char_0033_0304.gif) m”, indicative of pure CeO2 nanoparticles.
m”, indicative of pure CeO2 nanoparticles.
Table 1 details the unit cell constraints derived from Rietveld refinement, including positional and atomic parameters. The R-factors obtained from the refinement (Rp, Rwp, Rexp) were 27.5, 20.8, and 19.7, respectively. Other fitting parameters such as χ2 was 1.11 and G.O.F was 1.1, as shown in Fig. 2(b).
| Atom | x | y | z | Occupancy |
|---|---|---|---|---|
| Ce | 0.00000 | 0.00000 | 0.00000 | 1.000 |
| O | 0.25000 | 0.25000 | 0.25000 | 1.032 |
4.2 Morphology and composition analysis
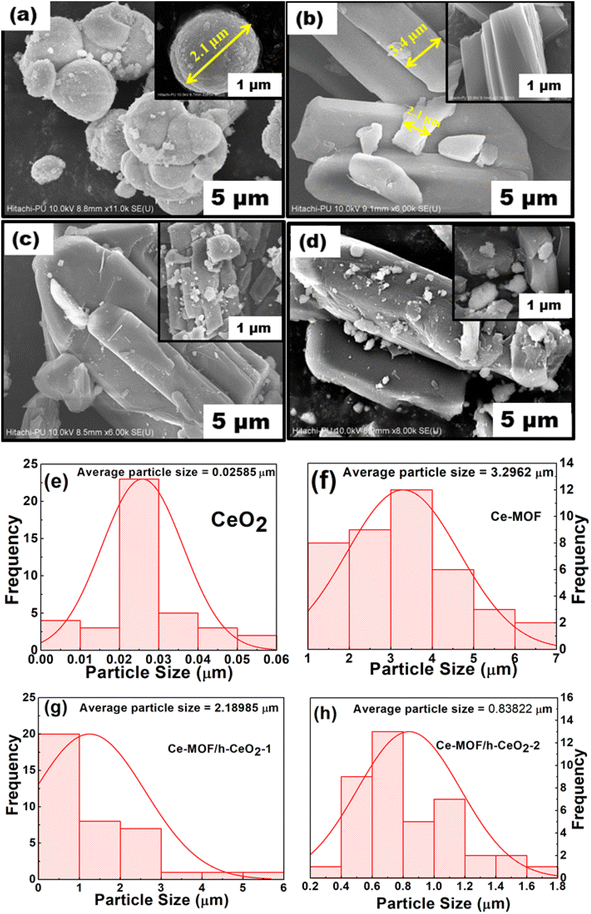
Field Emission Scanning Electron Microscopy (FE-SEM) images of h-CeO2, Ce-MOF, and Ce-MOF/h-CeO2 composites (Ce-MOF/h-CeO2-1 and Ce-MOF/h-CeO2-2) are presented in Fig. 3. The FE-SEM image of h-CeO2 displays uniformly dispersed microspheres with an average diameter of approximately 19–20 nm. Ce-MOF exhibits a diamond-like morphology with an average diameter of about 3 μm. The SEM images of Ce-MOF/h-CeO2-1 and -2 show a similar morphology to Ce-MOF, with ceria microspheres attached to the surface, resulting in an increased particle size. The consistent morphology across the Ce-MOF/h-CeO2 composite suggests successful synthesis, with the Ce-MOF homogeneously distributed over the h-CeO2 surface.33Particle size was analyzed using ImageJ Ver 1.53t software. It was observed that as the concentration of h-CeO2 in the Ce-MOF composites increased, the average particle size decreased, approaching that of pure ceria.
The particle size distribution of h-CeO2, Ce-MOF, Ce-MOF/h-CeO2-1, and Ce-MOF/h-CeO2-2, as derived from FE-SEM image analysis with ImageJ 1.53t, is depicted in Fig. 3(e)–(h). The histogram-based calculations from the FE-SEM image of h-ceria align closely with the results obtained from Rietveld analysis. Both methods demonstrate a consistent trend in particle size variation among the different samples.
Energy Dispersive Spectroscopy (EDS) was conducted to analyze the elemental composition of all synthesized samples: h-CeO2, Ce-MOF, Ce-MOF/h-CeO2-1, and Ce-MOF/h-CeO2-2. The EDS spectrum of the h-CeO2 sample, as shown in Fig. S1(a) (in ESI text†), confirmed the presence of only Ce and O, with no detectable impurity elements. Similarly, the EDS spectra for Ce-MOF and its composites, presented in Fig. S1(b)–(d) (in ESI text†), revealed the presence of Ce, O, and C in varying molar ratios, without any evidence of extraneous or impure peaks.
4.3 UV-diffuse reflectance spectroscopy (UV-DRS)
The optical properties of h-CeO2, Ce-MOF, and Ce-MOF/h-CeO2 composites (Ce-MOF/h-CeO2-1 and Ce-MOF/h-CeO2-2) were investigated using UV-Diffuse Reflectance Spectroscopy (UV-DRS) in the wavelength range of 300–700 nm. As depicted in Fig. 4(a), the primary optical absorption of these samples is situated in the ultraviolet region. The absorption edge wavelengths for h-CeO2, Ce-MOF, Ce-MOF/h-CeO2-1, and Ce-MOF/h-CeO2-2 composites are 443.01 nm, 424.65 nm, 427.58 nm, and 435.08 nm, respectively. | ||
| Fig. 4 (a) UV-DRS spectra, (b) band gap, and (c) FT-IR spectra of h-ceria, Ce-MOF, Ce-MOF/h-CeO2-1, and Ce-MOF/h-CeO2-2. | ||
The optical band gap energy (Eg) of these samples was calculated using the equation: (αhν)1/2 = A(hν − Eg), where hν = 1240/λ. In this equation, α represents the absorption coefficient, h is Planck's constant, λ signifies the absorption edges, and A is a constant.36 The calculated band gap energies for h-CeO2, Ce-MOF, Ce-MOF/h-CeO2-1, and Ce-MOF/h-CeO2-2 composites were found to be 2.71 eV, 2.86 eV, 2.78 eV, and 2.75 eV, respectively, as illustrated in Fig. 4(b).
4.4 FT-IR spectra
Fourier-Transform Infrared (FT-IR) spectroscopy was employed to investigate the chemical functional groups present in the synthesized samples, namely h-CeO2, Ce-MOF, and Ce-MOF/h-CeO2 composites (Ce-MOF/h-CeO2-1 and Ce-MOF/h-CeO2-2), as illustrated in Fig. 4(c). Peaks observed in the range of 1612–1557 cm−1 and 1435–1373 cm−1 are attributed to the asymmetric and symmetric stretching of carboxylate ions,41 respectively. The O–H stretching vibrations42 are identified in the range of 3300–3500 cm−1, and the C![[double bond, length as m-dash]](https://www.rsc.org/images/entities/char_e001.gif) O stretching vibration41 is noted at 1686.1 cm−1. Additionally, the region between 500–850 cm−1 is indicative of Ce–O stretching vibrations,43 confirming the presence of ceria in the composites.
O stretching vibration41 is noted at 1686.1 cm−1. Additionally, the region between 500–850 cm−1 is indicative of Ce–O stretching vibrations,43 confirming the presence of ceria in the composites.
4.5 Electrochemical characterization
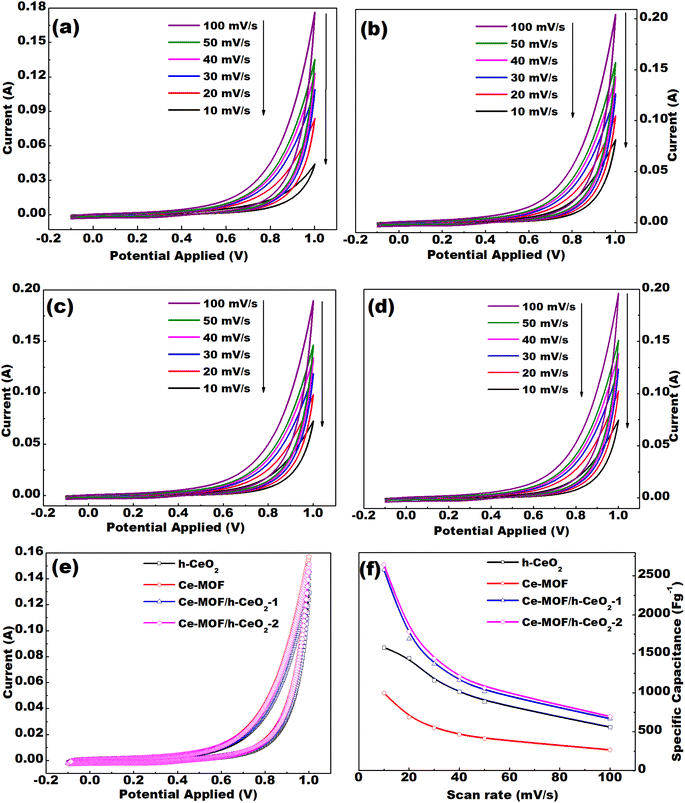
Cyclic voltammetry (CV) curves were analyzed for the prepared samples, which are h-CeO2, Ce-MOF, Ce-MOF/h-CeO2-1, and Ce-MOF/h-CeO2-2. The CV measurements were conducted at different scan rates of 10, 20, 30, 40, 50, and 100 mV s−1 within the potential range of −0.1 to 1.0 V, as shown in Fig. 5(e).
The specific capacitance (Cs) of the materials42 can be calculated using eqn (3), derived from the fundamental eqn (1):
| I = Csmk | (1) |
| A = (V2 − V1)Csmk | (2) |
![[thin space (1/6-em)]](https://www.rsc.org/images/entities/char_2009.gif) dV represents the integrated area under the CV curve, and the total contribution from both the charging (A1 = (V2 − V1)Csmk) and discharging (A2 = (V1 − V2)Csmk) phases is considered to obtain:
dV represents the integrated area under the CV curve, and the total contribution from both the charging (A1 = (V2 − V1)Csmk) and discharging (A2 = (V1 − V2)Csmk) phases is considered to obtain:
 | (3) |
![[thin space (1/6-em)]](https://www.rsc.org/images/entities/char_2009.gif) dV is the integrated area under the CV curve, m (g) is the mass of the active material, ΔV (V) denotes the width of the potential window, and k (V s−1) is the scan rate.
dV is the integrated area under the CV curve, m (g) is the mass of the active material, ΔV (V) denotes the width of the potential window, and k (V s−1) is the scan rate.
The CV curves obtained at different scan rates (10, 20, 30, 40, 50, and 100 mV s−1) for h-CeO2, Ce-MOF, Ce-MOF/h-CeO2-1, and Ce-MOF/h-CeO2-2 are shown in Fig. 5(a)–(d). The specific capacitance (Cs) values for h-CeO2, Ce-MOF, Ce-MOF/h-CeO2-1, and Ce-MOF/h-CeO2-2 were measured as 1581.52 F g−1, 995.59 F g−1,42 2575.74 F g−1, and 2643.78 F g−1, respectively, at a scan rate of 10 mV s−1. Specific capacitance values at the mentioned scan rates were calculated using eqn (3), and are presented in Table 2. The table reveals that the specific capacitance of samples decreases with increasing scan rates. This decrease is attributed to two factors: at lower scan rates, lower resistance and the kinetic energy of ions allow for extended interaction time with the electrode surface; conversely, at higher scan rates, ions have less time to interact with the electrode due to increased kinetic energy and resistance, thereby reducing specific capacitance.
| Sample | Specific capacitance (F g−1) at different scan rate | |||||
|---|---|---|---|---|---|---|
| 10 mV s−1 | 20 mV s−1 | 30 mV s−1 | 40 mV s−1 | 50 mV s−1 | 100 mV s−1 | |
| h-CeO2 | 1581.52 | 1446.18 | 1160.29 | 1015.84 | 887.39 | 559.03 |
| Ce-MOF | 995.59 | 685.37 | 549.64 | 466.79 | 410.27 | 267.85 |
| Ce-MOF/h-CeO2-1 | 2575.74 | 1690.82 | 1368.32 | 1161.54 | 1018.16 | 667.67 |
| Ce-MOF/h-CeO2-2 | 2643.78 | 1782.71 | 1437.83 | 1210.15 | 1062.31 | 696.24 |
Furthermore, the maximum specific capacitance of Ce-MOF, synthesized with 2,6-dinaphthalene dicarboxylic acid as the ligand, is found to be 995.59 F g−1 at a scan rate of 10 mV s−1. This is higher compared to that obtained for Ce-MOF with 1,3,5-tricarboxylic acid.42,44 This difference in capacitance is attributed to the higher number of active sites in 2,6-dinaphthalene dicarboxylic acid compared to 1,3,5-tricarboxylic acid, as illustrated in Fig. S2 (in the ESI text†).
It was determined from the CV that the electrode (working) gives almost the same results even after 50 cycles, which shows its cyclic stability as it decomposes less with time, as shown in Fig. S3(a) (in the ESI text†). The deviation of the voltammogram shapes from an ideal rectangular form indicates that the capacitance is mainly derived from pseudocapacitance due to faradaic redox reactions of the electroactive materials.45 Pseudocapacitors typically operate through three primary mechanisms for storing charge: monolayer adsorption, surface-level redox reactions, and intercalation/de-intercalation of ions within/from the electrode surface.46 In this study, the relationship between peak current (IP) and scan rate (ν) is modeled using the equation IP = aνb, where ‘a’ and ‘b’ are fitting parameters. The value of ‘b’ typically falls within the range of approximately 0.5 to 1 across all samples, indicating that both faradaic and non-faradaic charge storage mechanisms are at play. Since both mechanisms are active, all samples can be classified as pseudocapacitive in nature.
The respective equations for faradaic and non-faradaic charge storage processes are presented below, where ‘s’ denotes the surface:47
Faradaic:
| CeO2 + H2O + e− ⇌ Ce3+OOH | (4) |
Non-faradaic:
| (CeO2)s + K+ + e− ⇌ (CeO2·K+)s | (5) |
The peak current is plotted against the square root of the scan rate (ν1/2) to determine the diffusivity of the reactants, following the Randles–Sevcik equation,48 as shown in Fig. S3(b) (in the ESI text†). Higher diffusivity indicates improved electrochemical performance of the material. Since Ce-MOF has better diffusivity compared to h-CeO2, the addition of Ce-MOF to h-CeO2 improves its diffusivity in the electrolyte and hence enhances its electrochemical performance.
 | (6) |
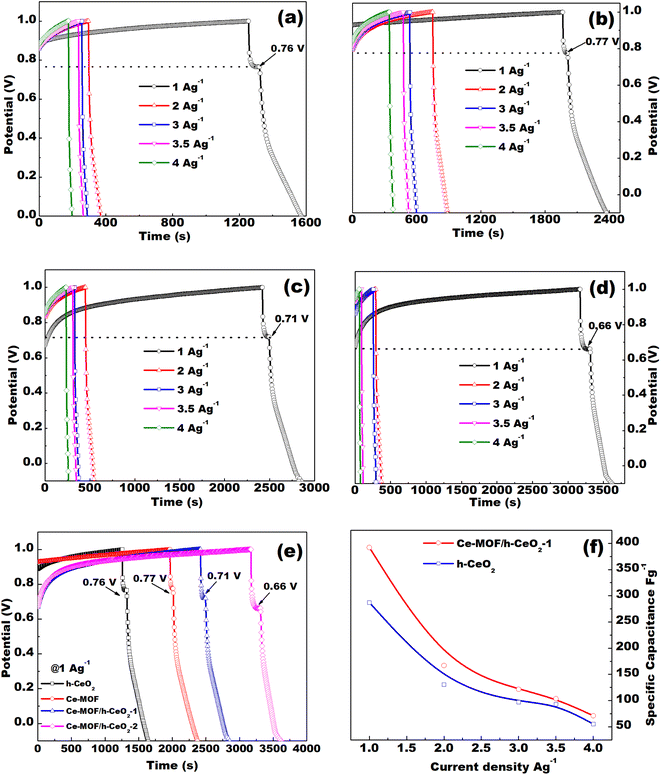
The specific capacitance decreases with an increase in current density, as shown in Fig. 6(f). The specific capacitance of Ce-MOF increases with the amount of h-CeO2 added to it. The decrease in specific capacitance at high current densities likely arises from the challenge of electrolyte ions reaching the inner active sites of the electrode. In other words, the electrodes may not adequately facilitate full redox reactions at higher current densities due to the slower diffusion rate of OH− ions into them.49 Moreover, with an increase in current density, the specific capacitance of the electrodes diminishes as the interaction between the electrode and electrolyte ions decreases at higher current densities. Essentially, at lower current densities, electrolyte ions can readily diffuse into all available spaces on the electrode surface, facilitating ample insertion reactions.50
The energy and power density of Ce-MOF and its composites can be calculated using the following equations:
 | (7) |
 | (8) |
Maximum energy density and power density of 249.22 W h kg−1 and 7.9 kW kg−1 were obtained for Ce-MOF/h-CeO2 composite respectively, signifies it to be a high performance supercapacitor electrode.
5 Conclusions and future outlook
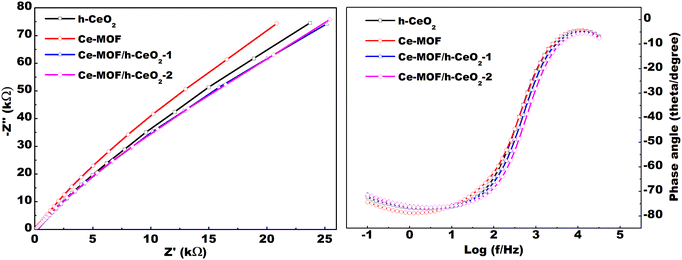
This study successfully synthesized Ce-MOF and h-ceria composites, incorporating up to 0.10 g of h-CeO2, using a hydrothermal method. Lattice imperfections and structural defects were analyzed through Rietveld refinement of XRD patterns, revealing the emergence of new peaks in Ce-MOF with increasing h-CeO2 concentration. Morphological characteristics were ascertained using FE-SEM analysis, while UV-DRS spectroscopy and FT-IR analysis were employed to determine the band gap energies and functional groups of the composites, respectively. Notably, the data indicated a decrease in band gap energy with an increase in h-CeO2 content.The electrochemical performance of the samples was evaluated using cyclic voltammetry (CV), which demonstrated an increase in specific capacitance upon the introduction of h-CeO2 into Ce-MOF. A significant specific capacitance of 2643.78 F g−1 was achieved at a scan rate of 10 mV s−1. The maximum energy and power density were found to be 249.22 W h kg−1 and 7.9 kW kg−1, respectively, using GCD analysis. The straight line Nyquist plots at high frequency region depicts low faradaic charge transfer resistance and may be useful in smart (memory) capacitor applications. All these electrochemical measurements indicate good pseudocapacitive behavior of Ce-MOF/h-CeO2 electrodes and their potential for use in energy storage devices.
Future research endeavors could focus on further developing Ce-MOF/h-CeO2 composites to enhance specific capacitance and overall efficiency of supercapacitors. Additionally, exploring other composites, such as those incorporating graphene oxide (GO) and carbon nanotubes (CNT), and comparing their performance could pave the way for more efficient energy storage devices. Since the maximum specific capacitance of Ce-MOF/h-CeO2 composites is found to be 2643.78 F g−1, it is expected to achieve supercapacitors with greater storage capacity with the addition of CNTs. These supercapacitors can further be used in conjunction with batteries in electric vehicles to provide bursts of power for acceleration and regenerative braking, enhancing the overall performance and efficiency of the vehicle.
Author contributions
Ruhani Baweja: writing – original draft, methodology, investigation, formal analysis, data mining. Monika Verma: methodology, investigation, data mining, discussions and writing-review & editing. Sanjeev Gautam: conceptualization, investigation, formal analysis, writing-review & editing, resources, funding acquisition, project administration and supervision. Navdeep Goyal: discussions, supervision, investigation and revisions. Shailesh Upreti: discussions, investigation and revisions.Conflicts of interest
There are no conflicts to declare.Notes and references
- M. Verma and S. Gautam, J. Magn. Magn. Mater., 2023, 588, 171436 CrossRef CAS.
- S. Gautam, M. Verma, R. Chauhan, S. Aghara and N. Goyal, Energy Adv., 2023, 2, 1309–1325 RSC.
- V. Thakur, K. Upadhyay, R. Kaur, N. Goyal and S. Gautam, Mater. Today Adv., 2020, 8, 100082 CrossRef.
- Y. Zhao, F. Liu, K. Zhu, S. Maganti, Z. Zhao and P. Bai, Adv. Compos. Hybrid Mater., 2022, 5, 1537–1547 CrossRef CAS.
- Z. Sun, K. Qu, J. Li, S. Yang, B. Yuan, Z. Huang and Z. Guo, Adv. Compos. Hybrid Mater., 2021, 4, 1413–1424 CrossRef CAS.
- C. Hou, B. Wang, V. Murugadoss, S. Vupputuri, Y. Chao, Z. Guo, C. Wang and W. Du, Eng. Sci., 2020, 11, 19–30 CAS.
- S. S. Patil, T. S. Bhat, A. M. Teli, S. A. Beknalkar, S. B. Dhavale, M. M. Faras, M. M. Karanjkar and P. S. Patil, Eng. Sci., 2020, 12, 38–51 CAS.
- S. Singh, A. C. Rastogi, F. Omenya, M. S. Whittingham, A. Lal and S. Upreti, MRS Online Proc. Libr., 2015, 1740, mrsf14–1740 CrossRef.
- S. Dai, Y. Bai, W. Shen, S. Zhang, H. Hu, J. Fu, X. Wang, C. Hu and M. Liu, J. Power Sources, 2021, 482, 228915 CrossRef CAS.
- S. Gautam, S. Rialach, S. Paul and N. Goyal, RSC Adv., 2024, 14, 14311–14339 RSC.
- Y. Ma, X. Xie, W. Yang, Z. Yu, X. Sun, Y. Zhang, X. Yang, H. Kimura, C. Hou and Z. Guo, et al., Adv. Compos. Hybrid Mater., 2021, 1–19 Search PubMed.
- W.-C. Fang, J. Phys. Chem. C, 2008, 112, 11552–11555 CrossRef CAS.
- K. Isakov, O. Sorsa, T. Rauhala, S. Saxelin, T. Kallio, H. Lipsanen and C. Kauppinen, Energy Adv., 2022, 1, 1041–1050 RSC.
- Y. Wang, Y. Song and Y. Xia, Chem. Soc. Rev., 2016, 45, 5925–5950 RSC.
- T. Liu, L. Zhang, W. You and J. Yu, Small, 2018, 14, 1702407 CrossRef PubMed.
- H. Gao and K. Lian, RSC Adv., 2014, 4, 33091–33113 RSC.
- Y. Wang, Y. Lei, J. Li, L. Gu, H. Yuan and D. Xiao, ACS Appl. Mater. Interfaces, 2014, 6, 6739–6747 CrossRef CAS PubMed.
- C. K. Maity, N. Goswami, K. Verma, S. Sahoo and G. C. Nayak, J. Energy Storage, 2020, 32, 101993 CrossRef.
- Z.-J. Lin, J. Lü, M. Hong and R. Cao, Chem. Soc. Rev., 2014, 43, 5867–5895 RSC.
- S. Ghosh, A. De Adhikari, J. Nath, G. C. Nayak and H. P. Nayek, ChemistrySelect, 2019, 4, 10624–10631 CrossRef CAS.
- Y. Wen, P. Zhang, V. K. Sharma, X. Ma and H.-C. Zhou, Cell Rep. Phys. Sci., 2021, 2, 100348 CrossRef CAS.
- G. Xu, C. Zhu and G. Gao, Small, 2022, 18, 2203140 CrossRef CAS PubMed.
- H. B. Wu and X. W. Lou, Sci. Adv., 2017, 3, eaap9252 CrossRef PubMed.
- W. Li, D. Xiong, X. Gao and L. Liu, Chem. Commun., 2019, 55, 8744–8763 RSC.
- K. Wan, J. Luo, C. Zhou, T. Zhang, J. Arbiol, X. Lu, B.-W. Mao, X. Zhang and J. Fransaer, Adv. Funct. Mater., 2019, 29, 1900315 CrossRef.
- K. Wan, J. Luo, X. Zhang, P. Subramanian and J. Fransaer, J. Energy Chem., 2021, 62, 198–203 CrossRef CAS.
- P. Li, R. Chen, S. Tian and Y. Xiong, ACS Sustain. Chem. Eng., 2019, 7, 9566–9573 CrossRef CAS.
- J. Yang, C. Zheng, P. Xiong, Y. Li and M. Wei, J. Mater. Chem. A, 2014, 2, 19005–19010 RSC.
- X.-Z. Song, W.-Y. Zhu, X.-F. Wang and Z. Tan, ChemElectroChem, 2021, 8, 996–1020 CrossRef CAS.
- B. Talluri, K. Yoo and J. Kim, Ceram. Int., 2022, 48, 164–172 CrossRef CAS.
- J. Yang, Z. Ma, W. Gao and M. Wei, Chem.–Eur. J., 2017, 23, 631–636 CrossRef CAS PubMed.
- X. Jiang, J. Zhang, L. Yu, R. Chen and X. Xu, Micro Nano Lett., 2016, 11, 137–141 CrossRef CAS.
- J. Yuan, B.-Y. Wang, Y.-C. Zong and F.-Q. Zhang, Inorg. Chem. Commun., 2023, 110799 CrossRef CAS.
- J. Rodríguez-Carvajal, Full Prof, 2000, pp. 1–139 Search PubMed.
- M. Kaur, S. Gautam, K. H. Chae, W. Klysubun and N. Goyal, Sci. Rep., 2023, 13, 10769 CrossRef CAS PubMed.
- B.-Y. Wang, E.-D. Li, Y.-C. Zong, X.-B. Wang, J. Yuan and F.-Q. Zhang, J. Mater. Res., 2022, 37, 1070–1082 CrossRef CAS.
- G. Williamson and W. Hall, Acta Metall., 1953, 1, 22–31 CrossRef CAS.
- T. Runcevski and C. M. Brown, Cryst. Growth Des., 2021, 21, 4821–4822 CrossRef CAS.
- D. Bhatnagar, S. Gautam, H. Batra and N. Goyal, J. Mech. Behav. Biomed. Mater., 2023, 142, 105814 CrossRef CAS PubMed.
- J. Hao, Y. Jiang, X. Gao, F. Xie, Z. Shao and B. Yi, J. Membr. Sci., 2017, 522, 23–30 CrossRef CAS.
- Z. Durmus, R. Köferstein, T. Lindenberg, F. Lehmann, D. Hinderberger and A. W. Maijenburg, Ceram. Int., 2023, 49, 24428–24441 CrossRef CAS.
- R. Ramachandran, W. Xuan, C. Zhao, X. Leng, D. Sun, D. Luo and F. Wang, RSC Adv., 2018, 8, 3462–3469 RSC.
- A. Lin, A. A. Ibrahim, P. Arab, H. M. El-Kaderi and M. S. El-Shall, ACS Appl. Mater. Interfaces, 2017, 9, 17961–17968 CrossRef CAS PubMed.
- Q. He, W. Wang, N. Yang, W. Chen, X. Yang, X. Fang and Y. Zhang, Molecules, 2023, 28, 6806 CrossRef CAS PubMed.
- S. Fatemi and M. R. Ganjali, et al., J. Energy Storage, 2022, 55, 105545 CrossRef.
- H. Huang and M. Niederberger, Nanoscale, 2019, 11, 19225–19240 RSC.
- S. Maiti, A. Pramanik and S. Mahanty, Chem. Commun., 2014, 50, 11717–11720 RSC.
- O. Gonzlez-Meza, E. Larios-Durn, A. Gutiérrez-Becerra, N. Casillas, J. Escalante and M. Bárcena-Soto, J. Solid State Electrochem., 2019, 23, 3123–3133 CrossRef.
- R. Wang, P. Wang, X. Yan, J. Lang, C. Peng and Q. Xue, ACS Appl. Mater. Interfaces, 2012, 4, 5800–5806 CrossRef CAS PubMed.
- R. Kötz and M. Carlen, Electrochim. Acta, 2000, 45, 2483–2498 CrossRef.
- R. Ramachandran, M. Saranya, P. Kollu, B. P. Raghupathy, S. K. Jeong and A. N. Grace, Electrochim. Acta, 2015, 178, 647–657 CrossRef CAS.
- A. Liu, H. Che, Y. Mao, Y. Wang, J. Mu, C. Wu, Y. Bai, X. Zhang and G. Wang, Ceram. Int., 2016, 42, 11435–11441 CrossRef CAS.
- N. S. Arul, D. Mangalaraj, R. Ramachandran, A. N. Grace and J. I. Han, J. Mater. Chem. A, 2015, 3, 15248–15258 RSC.
Footnote |
| † Electronic supplementary information (ESI) available. See DOI: https://doi.org/10.1039/d4ra00523f |
| This journal is © The Royal Society of Chemistry 2024 |

