 Open Access Article
Efficiency, mechanism and application prospect of ammonium adsorption and desorption over a sodium-acetate-modified synthetic zeolite†
Heng-Deng Zhou,
Chu-Ya Wang *,
Qi Wang,
Bo-Xing Xu and
Guangcan Zhu
School of Energy and Environment, Southeast University, Nanjing 210096, China. E-mail: wang-cy@seu.edu.cn
First published on 4th June 2024
Abstract
Adsorption is an effective approach for remediating ammonium pollution, and zeolite has exceptional efficacy for the adsorption of ammonium. The investigation of ammonium adsorption using coal-fly-ash-based zeolite has gained remarkable attention in contemporary research. In this work, a sodium-acetate-modified synthetic zeolite (MSZ) was used to absorb ammonium in simulated wastewater. The MSZ had an adsorption capacity for ammonium of 27.46 mg g−1, and the adsorption process followed the Langmuir isotherm model and pseudo-second-order kinetics model. The adsorption and desorption of ammonium were controlled by ion exchange, pore diffusion, and electrostatic attraction processes. Ion exchange was responsible for 77.90% of the adsorption process and 80.16% of the desorption process. The MSZ was capable of continuously removing large amounts of ammonium from wastewater through fixed bed adsorption. After 5 regeneration cycles, MSZ still maintained 75% adsorption characteristics for ammonium. Using MSZ adsorbed with ammonium as a soil amendment increased the germination rate of mung beans by 10%. Furthermore, it also increased the stem length, root length, and fresh weight by 20–30%. These findings suggest that MSZ provides a promising application prospect to mitigate ammonium pollution and recycle ammonium resources.
1. Introduction
The increase in ammonium emission is a major environmental concern due to its harmful impact on water quality and the ecosystem.1,2 Adsorption has gained increasing attention as an advanced method for removing ammonium, promoting reuse, and achieving energy-efficient treatment.3 With the advantages of customizable pore size, controllable composition and high adsorption capacity, synthetic zeolite has gradually been used to adsorb ammonium.4 Coal fly ash (CFA) is a prevalent air pollutant that mainly consists of SiO2 and Al2O3, which makes it a suitable material for zeolite synthesis.5The majority of existing literature focuses on the ammonium adsorption capacity and mechanism of zeolite synthesized from CFA, as well as exploring the high efficiency and energy-saving aspects of the synthesis process. Tang et al. employed zeolite synthesized from CFA to adsorb ammonium and the removal rates of ammonium in pig wastewater and biochemical plant effluent were 64.34% and 79.61%, respectively.6 Makgabutlane et al. synthesized pure phase sodalite (zeolite) using a low-energy microwave-assisted synthesis method, achieving ammonium removal rates of 82% and 73% for synthetic and actual urine, respectively.7 Chen et al. utilized ozone to enhance the crystallization process of zeolite, resulting in a shortened synthesis time from CFA and the production of an efficient artificial zeolite with a high adsorption capacity for ammonium.8 Zhao et al. investigated the adsorption efficiency of synthetic zeolite on nitrogen in municipal wastewater. The results demonstrated that a high removal rate (TN: 60.32%, NH4+–N: 77.5%) could be achieved by employing an appropriate amount of zeolite.9
Nevertheless, there is a lack of research on the adsorption and desorption properties and mechanisms of modified synthetic zeolite and the re-application of saturated adsorbent. The modification of zeolite with sodium acetate can enhance its adsorption properties and augment the quantity of surface-active sites occupied by Na+. Furthermore, the sodium acetate solution exhibits weak alkalinity. Following the alkali treatment of zeolite, silicon is selectively extracted from the zeolite, consequently reducing the Si/Al ratio. Consequently, a greater quantity of alkali metal cations infiltrates the zeolite, thereby enhancing its ion exchange capacity.10 Adsorption–desorption can effectively remove and recover pollutants. Following the adsorption of phosphate, zeolite contains relatively soluble phosphate minerals. Therefore, it is suitable as a slow-release amendment, providing nutrients for plants, improving soil quality, and restoring degraded land.11 Moreover, the conventional hydrothermal synthesis of zeolite results in a considerable accumulation of CFA residue, which limits its adsorption capacity.12,13 Introducing an alkaline fusing stage before the conventional hydrothermal conversion of CFA into high-purity zeolite can solve this problem.14 The pre-treatment of alkali fusion also allows the heavy metal elements in CFA to bind firmly into its structure, resulting in low leaching concentrations comparable to commercial zeolites.15 This characteristic ensures its safety for various applications.
In this study, CFA was employed as the initial material to synthesize zeolite using the “alkali fusion-hydrothermal” method. Subsequently, the zeolite was modified with sodium acetate to obtain an effective ammonium adsorbent named MSZ. This study elucidated the relationship between adsorbent structure and adsorption efficiency and examined the mechanism of adsorption–desorption. The experiment of continuous adsorption of ammonium in fixed bed was carried out. These findings serve as a reference for the engineering application of synthetic zeolite in ammonium adsorption. Additionally, the study validated the effectiveness of the adsorbent in slow-releasing ammonium to the field, thus providing a promising strategy for mitigating ammonium pollution and recycling ammonium resources through adsorption and subsequent field application.
2. Materials and methods
2.1. Materials
The zeolite (<0.178 mm) used in this study was sourced from Zhengzhou, China, and referred to as NZ. The coal fly ash obtained from Langfang, China was labeled as CFA. A mixture of 9 g of CFA and 18 g of NaOH powder in a 1![[thin space (1/6-em)]](https://www.rsc.org/images/entities/char_2009.gif) :
:![[thin space (1/6-em)]](https://www.rsc.org/images/entities/char_2009.gif) 2 ratio was heated in the presence of air at 600 °C for 90 minutes. Afterwards, the resulting mixture was pulverized and exposed to 80 °C for 1 hour. Finally, the mixture was crystallized at 100 °C for 12 hours to produce synthetic zeolite, which was subsequently impregnated with 1 mol L−1 sodium acetate for 6 hours to obtain modified synthetic zeolite (named MSZ). The selection of sodium acetate modified concentration was discussed in Text S1 and Fig. S1.† The material production process is shown in Fig. S2.†
2 ratio was heated in the presence of air at 600 °C for 90 minutes. Afterwards, the resulting mixture was pulverized and exposed to 80 °C for 1 hour. Finally, the mixture was crystallized at 100 °C for 12 hours to produce synthetic zeolite, which was subsequently impregnated with 1 mol L−1 sodium acetate for 6 hours to obtain modified synthetic zeolite (named MSZ). The selection of sodium acetate modified concentration was discussed in Text S1 and Fig. S1.† The material production process is shown in Fig. S2.†
The experiment employed chemical-grade reagents procured from Aladdin Industries, located in Shanghai, China. NH4Cl was dissolved in deionized water by the researcher to prepare a stock solution of ammonium at a concentration of 1000 mg L−1. The stock solution was subsequently diluted to the required concentration for the upcoming batch studies.
2.2. Batch adsorption experiments
An adsorption isotherm was constructed through batch studies to investigate the adsorption characteristics of NZ and MSZ for ammonium. The adsorption isotherm was examined by varying the concentration of the ammonium solution across multiple levels: 10, 20, 40, 50, 80, 120, 160, and 200 mg L−1. Before introducing the adsorbent, the pH of the solution was adjusted to 7.0 using a 0.1 mol L−1 solution of HCl and NaOH. The adsorbent was consistently used at concentrations of 2, 4, and 8 g L−1. The solution was then agitated at 150 revolutions per minute (rpm) for 24 hours until reaching equilibrium. After achieving equilibrium, the concentration of ammonium in the supernatant was measured. The entire experiment was conducted three times at a temperature of 25 °C. The concentration of ammonium was determined by calculating the average, while the adsorption capacity of ammonium (Qe, mg g−1) was computed using the following formula (1):
 | (1) |
The isothermal adsorption data of ammonium at 25 °C was fitted using the Langmuir and Freundlich models, and the equations are as follows:
| Qe = QmaxKLCe/(1 + KLCe) | (2) |
| Qe = KFCe1/n | (3) |
 | (4) |
Kinetics of adsorption: the kinetic studies were conducted by initial concentrations of ammonium at 10, 50, and 100 mg L−1. The solution's pH was adjusted to 7.0, and the adsorbent was added at a concentration of 4 g L−1. Undergo oscillation at a temperature of 25 °C with a rotational speed of 150 rpm. Collect periodic samples to quantify the concentration of ammonium. The experiment was replicated thrice and the mean concentration of ammonium was documented. Eqn (5) was utilized to compute the quantity of ammonium that was absorbed by a specific adsorbent at a particular time (Qt, mg g−1):
 | (5) |
The ammonium adsorption mechanism of MSZ was studied using the pseudo-first-order and pseudo-second-order models, with the following equations:
ln(Qe − Qt) = ln![[thin space (1/6-em)]](https://www.rsc.org/images/entities/char_2009.gif) Qe − k1t Qe − k1t
| (6) |
| t/Qt = 1/k2Qe2 + t/Qe | (7) |
Experiment on pH influence: a solution was created with a concentration of 100 mg L−1 of ammonium. The pH of the solution was altered within the range of 1.0 to 13.0 to study the impact of pH on the solution. Afterwards, 4 g L−1 of the adsorbent were introduced into the solution and agitated at a speed of 150 rpm at a temperature of 25 °C. Once adsorption equilibrium was achieved, the concentrations of leftover ammonium were measured. The experiment was replicated thrice, and the mean concentration of ammonium was determined.
Experiments on the influence of coexisting ions: the relative competitiveness of cations was evaluated by preparing binary solutions that included the common cations Mg2+, Na+, Ca2+, and K+. These solutions were then added to a 100 mg L−1 ammonium solution. The concentrations of the cations were varied in increments of 20 mmol L−1, ranging from 0 to 100 mmol L−1. Adjust the pH of the solution to 7.0. The subsequent procedures closely resemble those used in the pH experiment. Eqn (8) was used to calculate the adsorption capacity of the adsorbent on ammonium in the presence of competing cations,
 | (8) |
Experiment on the influence of temperature: according to the experiment of adsorption isotherm at 25 °C, two more sets were made at 35 °C and 45 °C. The experimental data collected at different temperatures were used to determine the changes in Gibbs free energy (ΔG0), enthalpy (ΔH0), and entropy (ΔS0) using the following equations:
| ΔG0 = ΔH0 − TΔS0 | (9) |
ΔG0 = −RT![[thin space (1/6-em)]](https://www.rsc.org/images/entities/char_2009.gif) ln ln![[thin space (1/6-em)]](https://www.rsc.org/images/entities/char_2009.gif) KC KC
| (10) |
| KC = Mw × 55.5 × 1000 × KL | (11) |
2.3. Characterization and analysis methods
The ammonium concentration was determined using Nessler reagent spectrophotometry with a spectrophotometer (752 N-spectrophotometer; China). Use a pH meter (pHS-3C, China) to determine the pH level of the fluid. The CFA, NZ and MSZ underwent an 8 h preprocessing using the standard degassing station at 120 °C under vacuum conditions. Subsequently, N2 adsorption and desorption tests were conducted using the 4-station automatic specific surface area analyzer, American Micromeritics APSP 2460, at a temperature of 77 K with liquid nitrogen. Upon completion of instrument analysis, the isothermal adsorption and desorption curve were generated, and the total specific surface area of the material was determined using the BET method. The sample weights for the test are as follows: CFA, 0.1418 g; NZ, 0.1251 g; SZ, 0.1398 g.Distinctions among NZ, MZ, and MSZ were analyzed using X-ray diffraction (XRD), Fourier-transform infrared spectroscopy (FTIR), and scanning electron microscopy (SEM). The X-ray diffraction (XRD) pattern was obtained using the German Bruker D2 Phaser instrument, covering the 2θ range from 5 to 40°. The pattern analysis was conducted using MDI Jade 6 software. The samples were evaluated using Thermo Scientific Nicolet iS5 to obtain FTIR spectra in the region of 4000 to 400 cm−1. Subsequently, the materials were mixed with KBr powder and compressed into particles. The XPS spectra of CFA, NZ, and MSZ were analyzed using the Shimadzu/Kratos AXIS SUPRA+ instrument in Japan.
2.4. Fixed bed adsorption
Various process parameters were utilized for the continuous fixed bed adsorption studies, including different input ammonium concentrations (C0 = 10, 50 mg L−1), varying flow rates (Q = 5, 10, 15 mL min−1), and different bed heights (H = 1, 2, 3 cm).The Bohart–Adams model postulates the absence of a reverse process and posits that the rate of removal at the site is directly proportional to both the concentration of the adsorbent and the remaining capacity of the adsorbent.17 The model is represented by eqn (12):
 | (12) |
2.5. Regeneration of the adsorbent and pot experiment
The MSZ adsorbent was regenerated by combining 0.4 g of MSZ with 100 mL of ammonium solution (200 mg L−1) and allowing them to react overnight at 25 °C. After mixing, the supernatant was collected, filtered, and quantified to determine the amount of ammonium adsorbed. The MSZ containing ammonium was then isolated from the solution through centrifugation for 15 minutes at 4000 rpm. The isolated solids were rinsed with distilled water for six cycles and subsequently dehydrated at 100 °C for two hours to obtain dehydrated MSZ with a higher concentration of ammonium (NH4+-MSZ). The dehydrated MSZ was then mixed with a desorption reagent solution (1 mol L−1 NaCl) and left to react for 6 hours. The resulting mixture was centrifuged at 4000 revolutions per minute for 15 minutes to separate the solids, which were then washed and dried. This processed MSZ was used as an adsorbent in subsequent experiments and was named De-NH4+-MSZ. The adsorption efficiency of ammonium was determined by dividing the amount of ammonium adsorbed by the initial amount in each cycle. The experiment was replicated thrice.The ammonium release kinetics from MSZ to ultrapure water were measured by mixing 0.5 g samples with 200 mL of ultrapure water at room temperature (25 ± 0.5 °C). The ammonium content in the aqueous solution was measured at various time points (0.5, 1, 2, 3, 6, 12, 24, 48, 72, 96 and 120 hours) to determine the release kinetics. The experiments were repeated three times, with the average data and standard deviation reported.
Soil samples were collected from the 0–20 cm surface layer of Southeast University in China for a pot experiment using mung bean seeds. NH4+-MSZ was added to six squares on the left side, with five seeds per square, resulting in a total of 30 seeds. No addition was made to the right six squares. NH4+-MSZ was added at a concentration of 2% of the dry weight of the soil. The plants were grown under room temperature conditions and watered daily. On day 14, the selected plants were assessed for their germination rate, as well as measurements of stem length, root length, and fresh weight.
3. Results and discussion
3.1. Characteristics of adsorbents
To evaluate the pore distribution and specific surface area of the adsorbent, BET tests were conducted, and the N2 adsorption–desorption isotherms of CFA, NZ, and MSZ are presented in Fig. 1a. Among the three materials, NZ exhibited the highest specific surface area of 15.98 m2 g−1. In contrast, CFA had an initial specific surface area of only 0.7396 m2 g−1. However, using the “alkali fusion-hydrothermal” method to produce MSZ, its specific surface area increased approximately threefold, reaching 2.158 m2 g−1. According to the IUPAC classification, the N2 adsorption–desorption isotherm of NZ exhibited a type IV isotherm with an H3 hysteresis loop, indicating a highly irregular pore structure.18 On the other hand, the N2 adsorption–desorption isotherms of CFA and MSZ displayed type III isotherms, suggesting that both materials were imperforate and had a low presence of micropores (0–2 nm) and mesopores (2–50 nm).19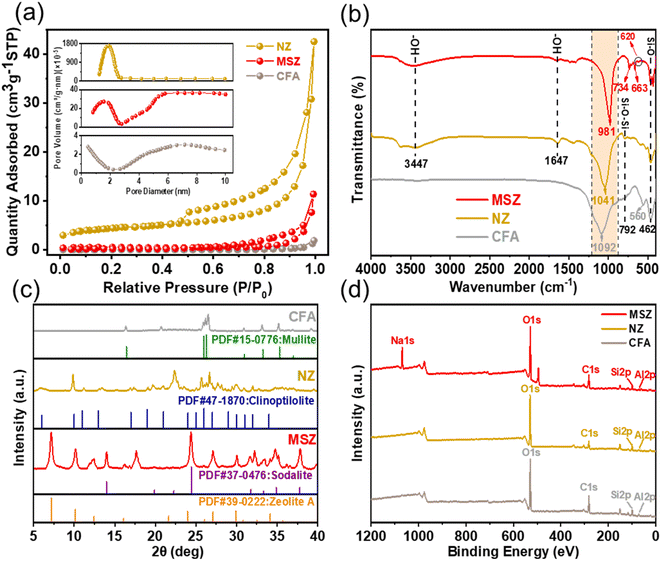 | ||
| Fig. 1 (a) N2 adsorption–desorption curves of CFA, NZ and MSZ, (b) FTIR spectra of CFA, NZ and MSZ, (c) XRD spectra of CFA, NZ and MSZ and (d) XPS spectra of CFA, NZ and MSZ. | ||
FTIR analysis was conducted to investigate the surface functional groups of the adsorbents. Fig. 1b illustrates the FTIR spectra of CFA, MSZ, and NZ. The notable absorption peaks observed at 3447 cm−1 and 1647 cm−1 correspond to the stretching and bending vibrations of the hydroxyl (–OH) group, respectively,20 indicating the possible presence of bound water in the zeolite structure of NZ and MSZ. In the FTIR spectra of CFA, the asymmetric stretching vibration peak at 1092 cm−1 and 792 cm−1 corresponds to the Si–O–Si bond, while the stretching vibration absorption peaks at 560 cm−1 and 462 cm−1 were attributed to the Al–O–Al bond.21 For MSZ, the bending vibration peak of Si–O was associated with a frequency of 462 cm−1.22 Additionally, the absorption peak observed at 620 cm−1 was linked to the double-ring vibration peak, indicating the formation of the double-ring structure within the zeolite crystal framework.23 The absorption peaks at 734 cm−1 and 663 cm−1 correspond to the symmetric and antisymmetric stretching vibrations of the Si–O tetrahedron, respectively.24 Notably, during the synthesis of zeolite from CFA, there was a remarkable alteration in the infrared absorption peak, shifting from 1092 cm−1 in CFA to 981 cm−1. This shift was due to the presence of a considerable quantity of Si–O–Na in the produced zeolite structure, which had a greater bond length and a reduced bond angle in comparison to Si–O–Si.25
XRD experiments were performed to examine the crystalline content and crystallinity of the adsorbed materials. Fig. 1c displays the XRD spectra of CFA, MSZ, and NZ. The XRD spectrum of CFA clearly showed a broad peak between 5 and 35 degrees, indicating the presence of a substantial amount of amorphous glassy phase chemicals in the raw material. These compounds are highly active and play a crucial role in the synthesis of zeolite.26 The predominant phases found in CFA were mullite (3Al2O3·2SiO2) and quartz (SiO2). MSZ mainly consisted A-zeolite and sodalite with high crystallinity, while it also contained some quartz and mullite. NZ products simultaneously incorporated quartz, mullite, and clinoptilolite, however, the degree of crystallinity was low.
XPS studies were conducted to examine the surface composition and molecular arrangement of the adsorbent materials. The XPS spectra of CFA, MSZ, and NZ are shown in Fig. 1d. The XPS spectra of CFA and NZ did not exhibit a typical peak for sodium (Na). However, a prominent Na 1s peak was observed in MSZ, suggesting that MSZ contained a substantial amount of sodium ions (Na+) that could potentially be exchanged with ammonium.
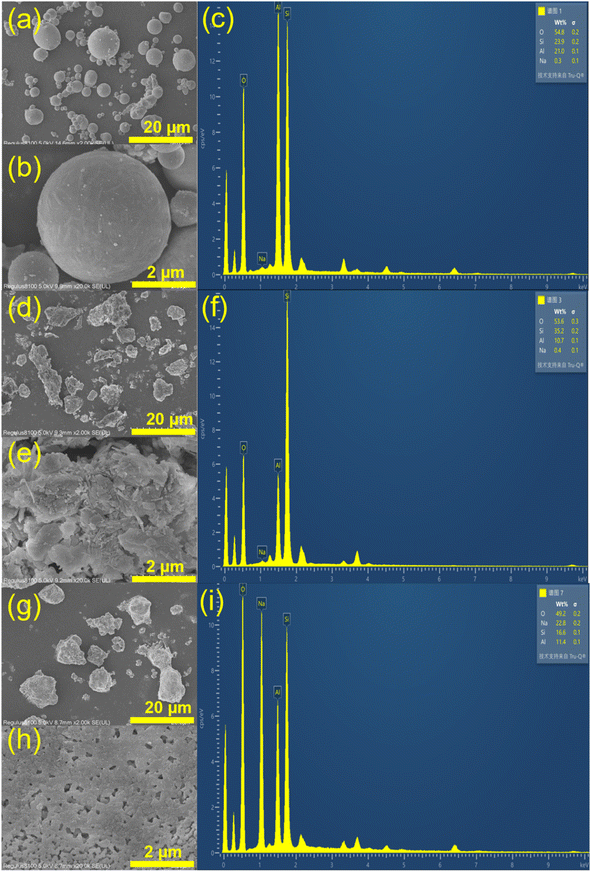
SEM-EDS characterization was conducted to examine the surface morphology and element distribution of the adsorbent materials. Examination of CFA's powder form using a scanning electron microscope (Fig. 2a and b) revealed that it was mainly composed of amorphous spherical glass beads of different sizes (0.6 to 6.0 micrometers). The glass beads had an uneven surface coated with small CFA particles. Moreover, CFA included loose and irregular blocky particles. The large number of highly active glass beads created the possibility of synthesizing zeolite from CFA. NZ's surface was uneven, coarse, and fragmented with unclear boundaries and corners, and it had a higher concentration of impurities (Fig. 2d and e). MSZ's structure was flexible and characterized by a uniform cylindrical prism shape, leading to increased porosity (Fig. 2g and h). Also, the crystalline surface of MSZ featured various irregular small cavities, probably resulting from alkaline modification with sodium acetate.
Table 1 shows the distribution of EDS elements for the three materials. CFA contained oxygen (O), silicon (Si), and aluminum (Al) as its primary constituents, with a Si/Al ratio of approximately 1![[thin space (1/6-em)]](https://www.rsc.org/images/entities/char_2009.gif) :
:![[thin space (1/6-em)]](https://www.rsc.org/images/entities/char_2009.gif) 1, which was particularly beneficial for the production of A-type zeolites.27 MSZ had a high sodium (Na) concentration, which reached 22.8%, leading to a considerable number of exchange sites for ammonium. Conversely, NZ had a silicon-to-aluminum ratio of 3, which is unfavorable for ammonium adsorption.28
1, which was particularly beneficial for the production of A-type zeolites.27 MSZ had a high sodium (Na) concentration, which reached 22.8%, leading to a considerable number of exchange sites for ammonium. Conversely, NZ had a silicon-to-aluminum ratio of 3, which is unfavorable for ammonium adsorption.28
| Samples | O (%) | Al (%) | Si (%) | Na (%) |
|---|---|---|---|---|
| CFA | 54.60 | 20.37 | 24.64 | 0.39 |
| NZ | 53.6 | 10.7 | 35.2 | 0.4 |
| MSZ | 49.2 | 11.4 | 16.6 | 22.8 |
In general, mullite and quartz were plentiful in CFA, making it a highly suitable raw material for MSZ production. Although MSZ had a remarkable level of crystallinity, it had a relatively limited surface area. It was characterized by its zeolite A and sodalite structure and consists of Si–O–Na bonds with a high sodium content. According to the findings, MSZ exhibited a greater number of ion exchange sites for NH4+ in comparison to NZ, which could potentially enhance the adsorption of ammonium by MSZ.
3.2. Ammonium adsorption isotherm, kinetics and thermodynamics
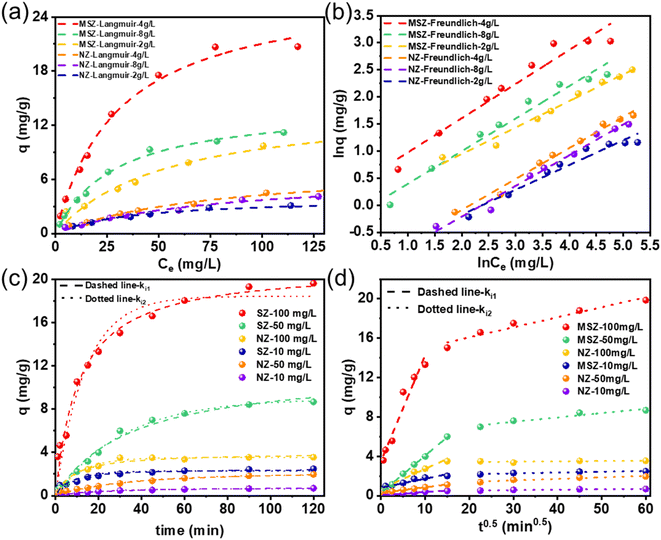
Fig. 3a and b depict the correlation between the equilibrium concentration of MSZ and NZ for ammonium, as well as their adsorption capability at different dosages. Both MSZ and NZ had maximum adsorption capacities at a concentration of 4 g L−1. Any deviation from this dosage, whether too high or too low, would be detrimental to the adsorption of ammonium. The experimental outcomes of ammonium adsorption by MSZ could be precisely described by the Langmuir and Freundlich models. Table 2 shows the adsorption values and parameters at the dosage of 4 g L−1. The Langmuir fitting correlation coefficient (R2 = 0.992) was higher than the Freundlich fitting correlation coefficient (R2 = 0.937), indicating that MSZ adsorbed NH4+ in a monolayer.29 According to eqn (2), the maximum adsorption capacity of MSZ for ammonium was 27.46 mg g−1.| Models | Parameters | Values (MSZ) | Values (NZ) |
|---|---|---|---|
| Langmuir | Q (mg g−1) | 27.46 | 7.61 |
| KL (L mg−1) | 0.0327 | 0.0127 | |
| R2 | 0.992 | 0.991 | |
| Freundlich | KF | 2.645 | 0.346 |
| 1/n | 0.471 | 0.534 | |
| R2 | 0.937 | 0.982 |
Fig. 3c shows the time-dependent profiles of ammonium adsorption by MSZ and NZ at different concentrations. During the first 30 minutes, both NZ and MSZ showed a higher rate of adsorption on ammonium at various concentrations. After 30 minutes, NZ reached the saturation point at both low and high ammonium concentrations. However, MSZ continued to adsorb ammonium at a decreasing rate, particularly at high ammonium concentrations. Comparing the fitting curves in Fig. 3c and the kinetics parameters in Table 3, it was evident that the pseudo-second-order model had the highest fitting correlation coefficient, R2, with a value of 0.980. The pseudo-second-order kinetic model was superior to the pseudo-first-order kinetic model in characterizing the adsorption behavior of ammonia on MSZ, suggesting that the adsorption of ammonia by MSZ was primarily due to chemisorption.30
| Models | Parameters | Values (MSZ) | Values (NZ) |
|---|---|---|---|
| Pseudo-first-order | Qe (mg g−1) | 18.42 | 2.27 |
| k1 (min−1) | 0.0724 | 0.1055 | |
| R2 | 0.945 | 0.932 | |
| Pseudo-second-order | Qe (mg g−1) | 21.13 | 2.49 |
| k2 (g mg−1 min−1) | 0.0043 | 0.0654 | |
| R2 | 0.980 | 0.929 | |
| Intraparticle diffusion | ki1 (mg g−1 min−1/2) | 1.073 | 0.2042 |
| C1 | 3.540 | 0.6826 | |
| ki2 (mg g−1 min−1/2) | 0.1019 | 0.0444 | |
| C2 | 14.05 | 6.173 |
One or more individual steps within the adsorption process can influence both the overall adsorption rate and adsorption capacity. To enhance our understanding of the adsorption process of ammonium on MSZ, we examined the in-particle diffusion model based on the kinetic data. The fitting results and corresponding parameters were presented in Fig. 3d and Table 3, respectively. The data for adsorption capacity (Q) and time0.5 (t0.5) did not exhibit a linear relationship starting from the origin, indicating that the adsorption process is controlled by multiple sequential steps. The data was separated into two distinct stages, namely external and internal diffusion, with the rate constants designated as ki1 and ki2, respectively. The adsorption rate constant (ki1) was greater than ki2, and the diffusion boundary layer thickness (C1) was smaller than C2. This indicated a gradual decrease in the adsorption rate and an increase in diffusion resistance, ultimately resulting in the attainment of adsorption equilibrium.31 Hence, the initial adsorption rates and capacities exerted a greater impact on the overall adsorption process.
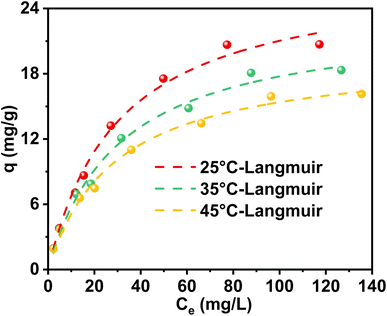
Upon increasing the temperature, a slight enhancement in the adsorption capacity of MSZ for ammonium was observed, as illustrated in Fig. 4 and Table 4. Specifically, when the temperature rose from 288 K to 308 K, the adsorption capacity of ammonium decreased from 27.46 mg g−1 to 19.84 mg g−1. The ΔG value displayed a negative sign, with its magnitude diminishing as the temperature increased, indicating a spontaneous process. A positive ΔS value indicated an increase in disorder at the interface between MSZ and ammonium, aligning with the adsorption of ammonium on the solid surface. Additionally, a positive ΔH value suggested that the adsorption process of ammonium is endothermic.32
| Temperature (K) | KL (L mg−1) | KC | ΔG (kJ mol−1) | ΔH (kJ mol−1) | ΔS (kJ mol−1 K−1) |
|---|---|---|---|---|---|
| 298 | 0.0327 | 32![[thin space (1/6-em)]](https://www.rsc.org/images/entities/char_2009.gif) 667.3 667.3 |
−25.75 | 2.226 | 0.0939 |
| 308 | 0.0337 | 33![[thin space (1/6-em)]](https://www.rsc.org/images/entities/char_2009.gif) 666.3 666.3 |
−26.69 | ||
| 318 | 0.0346 | 34![[thin space (1/6-em)]](https://www.rsc.org/images/entities/char_2009.gif) 565.4 565.4 |
−27.63 |
In general, the adsorption of ammonium by MSZ occurred in a single molecular layer and followed pseudo-second-order kinetics. The adsorption was a process of enthalpy and entropy increase, the Gibbs free energy was less than 0, and the reaction could be spontaneous. These characteristics were consistent with those of ion exchange adsorption, suggesting that ammonium adsorption by MSZ could involve ion exchange.
3.3. Ammonium desorption and recovery
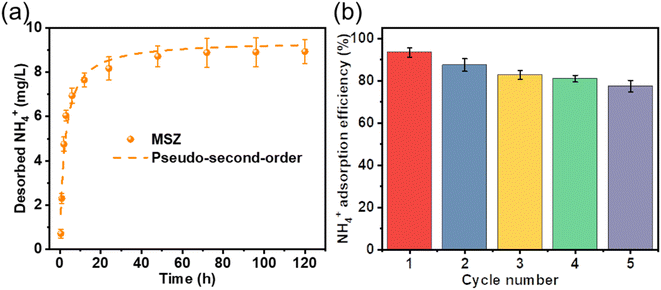
The investigation of MSZ's desorption kinetics regarding ammonium adsorption demonstrated a slow release of ammonium, which reached equilibrium within 24 hours (Fig. 5a). This shows the potential of adsorbing saturated MSZ as a slow-release nitrogen fertilizer for soil amendment. Furthermore, as depicted in Fig. 5b, this release process could be replicated when a fresh solution was introduced into the system, simulating plant growth conditions that utilized the released ammonium. Throughout five consecutive sustained release experiments, the quantity of released ammonium remained relatively constant. Ion exchange might be the main mechanism of ammonium desorption,33 because the adsorption capacity of ammonium would not be greatly reduced after repeated ion exchange.3.4. Ammonium adsorption–desorption mechanism
To examine the alterations in chemical functional groups of MSZ ammonium throughout the adsorption–desorption process, FTIR spectroscopy was employed to analyze the corresponding samples (Fig. 6a). Throughout the adsorption and desorption of ammonium, the asymmetric O–Si–O bending vibration peak on the surface of MSZ underwent a shift from 984 cm−1 to 986 cm−1 and subsequently to 983 cm−1. This change could be attributed to the distinct bond lengths of Si–O–Na and Si–O⋯NH4.30 This showed that Si–O–Na became Si–O⋯NH4 after adsorption, and Si–O⋯NH4 became Si–O–Na again after desorption, and ion exchange occurred during adsorption and desorption. The OH-tensile vibration peaks of MSZ shifted successively from 3455 cm−1 to 3441 cm−1 and then to 3471 cm−1. This shift signified the presence of electrostatic attractions between ammonium and MSZ throughout the adsorption–desorption process.34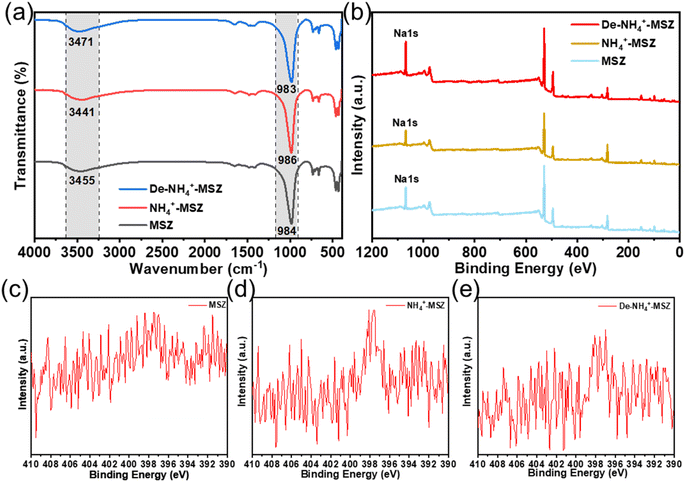 | ||
| Fig. 6 (a) FTIR spectra of MSZ adsorption–desorption ammonium, (b) XPS spectra of MSZ adsorption–desorption ammonium, XPS N 1s spectra of (c) MSZ, (d) NH4+-MSZ and (e) De-NH4+-MSZ. | ||
XPS analysis was conducted to investigate the surface composition changes of MSZ during the process of adsorption and desorption. Fig. 6b presents the XPS spectra of MSZ, NH4+-MSZ and De-NH4+-MSZ. The peak of Na 1s from MSZ to NH4+-MSZ to De-NH4+-MSZ increased and then decreased, while the peak intensity and peak area of N 1s (Fig. 6c–e) showed the opposite trend, which also indicated that ion exchange occurred in the process of adsorption and desorption. The reaction equation is as follows:
| Si–O–Na + NH4+ → Si–O⋯NH4 + Na+(adsorption) | (13) |
| Si–O–NH4 + Na+ → Si–O⋯Na + NH4+(desorption) | (14) |
To gain a more precise understanding of the adsorption and desorption processes, a material balance analysis was conducted. Table 5 presents the elemental composition of the MSZ surface before and after adsorption and desorption. Prior to adsorption, the Na content amounted to 8.86%, whereas after adsorption, it decreased to 6.81%. This indicated that during the adsorption process (1 g MSZ), approximately 0.0205 g of Na+ (0.00089 mol) were exchanged, resulting in an adsorption of 0.00089 mol NH4+ through ion exchange, which accounted for 77.90% of the total adsorption capacity. The calculation procedure is shown in Text S2.†
| Samples | Na (%) | N (%) | Si (%) | Al (%) |
|---|---|---|---|---|
| MSZ | 8.86 | 0.06 | 9.81 | 8.47 |
| NH4+-MSZ | 6.81 | 1.52 | 7.13 | 6.78 |
| De-NH4+-MSZ | 10.41 | 0.13 | 9.41 | 8.26 |
During desorption in ultra-pure water, there was no occurrence of ion exchange; instead, the process solely relied on pore diffusion. According to the kinetics experiment on desorption in ultra-pure water, 0.5 g of MSZ released 1.786 mg of NH4+. In regeneration experiments using a desorption solution (1 mol L−1 NaCl), 1 g of MSZ was capable of desorbing 18 mg of NH4+, involving both ion exchange and pore diffusion. Consequently, pore diffusion and electrostatic attraction contributed to 19.84% of the overall desorption process.
Both the adsorption and desorption of ammonium by MSZ were processes dominated by ion exchange, which involved pore diffusion and electrostatic attraction. Fig. 7 shows the schematic diagram illustrating the adsorption–desorption process.
3.5. Factors influencing ammonium adsorption and continuous adsorption effect
Below a pH value of 7, NH4+ becomes the dominant form of ammonia in the solution. Within the pH range of 7 to 9, NH4+ and NH3 H2O coexist in the solution, with NH4+ prevailing as the primary form. Nevertheless, as the pH value surpasses 9, the molecular weight of ammonia hydrate steadily increases.35 Fig. 8a depicts the influence of solution pH on ammonia adsorption. When optimal pH range was from 6 to 8, the adsorption rate was the highest. Beyond this range, the removal of ammonium declined obviously. This was attributed to the elevated concentration of H+ in low pH solutions, where ammonia primarily existed as NH4+. The smaller ionic radius of H+ compared to NH4+ enabled easier penetration of H+ into the zeolite, leading to a diminished adsorption effect on leading to a diminished adsorption effect on ammonia. High pH values corresponded to an increased concentration of hydroxide ions (OH−) in the solution. As a result, ammonia primarily existed in the form of NH3 H2O. Consequently, the zeolite's ability to exchange NH4+ ions was weakened, resulting in reduced adsorption capacity for NH4+ and overall adsorption effectiveness. Hence, the optimal pH range for ammonium adsorption using MSZ was 6 to 8. These findings indicate that MSZ primarily absorbed ammonium solution through ion exchange, with some additional adsorption.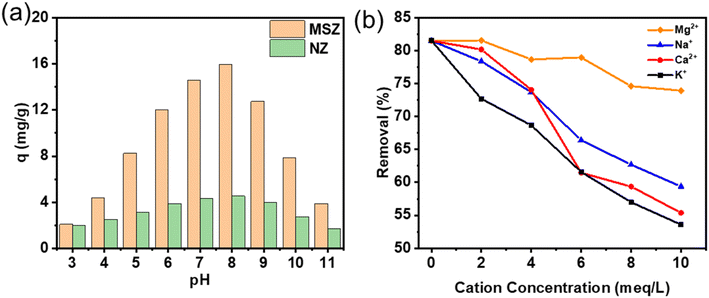 | ||
| Fig. 8 (a) Influence of pH of adsorption of ammonium by MSZ and NZ and (b) influence of co-ionic adsorption of ammonium by MSZ. | ||
The wastewater composition is highly complex, with various cations such as K+ (0.138 nm), Na+ (0.102 nm), Ca2+ (0.100 nm), and Mg2+ (0.072 nm) commonly coexisting alongside NH4+ (0.143 nm) (note: the radius of each alkali metal ion is provided in parentheses36–39). To investigate the impact of these cations on ammonium removal in MSZ, a study was conducted and the findings are presented in Fig. 8b. It was observed that the presence of these metal ions alone remarkably diminishes the efficiency of ammonium removal. As the initial concentration of cations increases, the efficiency of ammonium removal decreased. Specifically, when the concentrations of Mg2+, Na+, Ca2+, and K+ increased from 0 to 10 meq L−1, the removal rates of ammonium decreased to 73.93%, 59.36%, 55.37%, and 53.59%, respectively.
For a detailed analysis of dynamic adsorption, please refer to Text S3 and Fig. S3.† Table 6 displays the fitting parameters for the Bohart–Adams model. As the fixed bed height increased from 1 cm to 3 cm, the N0 value increased, while the kBA value decreased. Conversely, an increase in ammonium concentration and flow rate resulted in an inverse relationship between kBA and N0 values. Therefore, a higher flow rate or initial concentration of the ammonium solution led to rapid saturation of the fixed bed, followed by a decrease in adsorption capacity. These findings demonstrate that MSZ adsorbents effectively remove ammonium at the laboratory scale. To enhance the adsorption capacity of ammonium, the bed height can be increased, while reducing the ammonium concentration and flow rate. The optimal adsorption effect occurs when the ammonium content is 50 mg L−1, the injection rate is 5 mL min−1, and the material height is 2 cm.
| Experimental conditions | Bohart–Adams | ||||
|---|---|---|---|---|---|
| H (cm) | Q (mL min−1) | C0 (mg L−1) | kBA (L mg−1 min−1) | N0 (mg L−1) | R2 |
| 2 | 10 | 10 | 0.00093 | 22![[thin space (1/6-em)]](https://www.rsc.org/images/entities/char_2009.gif) 201 201 |
0.99 |
| 2 | 10 | 50 | 0.00101 | 19![[thin space (1/6-em)]](https://www.rsc.org/images/entities/char_2009.gif) 181 181 |
0.99 |
| 2 | 10 | 100 | 0.00132 | 12![[thin space (1/6-em)]](https://www.rsc.org/images/entities/char_2009.gif) 589 589 |
0.99 |
| 1 | 10 | 50 | 0.0017 | 14![[thin space (1/6-em)]](https://www.rsc.org/images/entities/char_2009.gif) 414 414 |
0.97 |
| 2 | 10 | 50 | 0.00096 | 16![[thin space (1/6-em)]](https://www.rsc.org/images/entities/char_2009.gif) 290 290 |
0.99 |
| 3 | 10 | 50 | 0.00092 | 18![[thin space (1/6-em)]](https://www.rsc.org/images/entities/char_2009.gif) 807 807 |
0.99 |
| 2 | 5 | 50 | 0.00068 | 60![[thin space (1/6-em)]](https://www.rsc.org/images/entities/char_2009.gif) 214 214 |
0.98 |
| 2 | 10 | 50 | 0.00093 | 19![[thin space (1/6-em)]](https://www.rsc.org/images/entities/char_2009.gif) 780 780 |
0.99 |
| 2 | 15 | 50 | 0.00145 | 7680 | 0.99 |
3.6. Efficacy of adsorbents as a soil amendment
To investigate the application of MSZ as a soil amendment, a series of pot experiments were conducted. The germination and growth results of mung beans after a 14 day period are presented in Fig. 9 and Table S1†. NH4+-MSZ treated plants exhibited a 10% increase in germination rate compared to the control plants, along with a statistically significant increase of 20–30% in average stem length, root length, and fresh weight (p < 0.001). These findings indicated that the introduction of NH4+-MSZ could retard the release of ammonium and enhance plant development.11,40 This confirmed that NH4+-MSZ, through the adsorption of ammonium and slow-release of nutrients, acting as a soil amendment, leading to improved soil quality and productivity.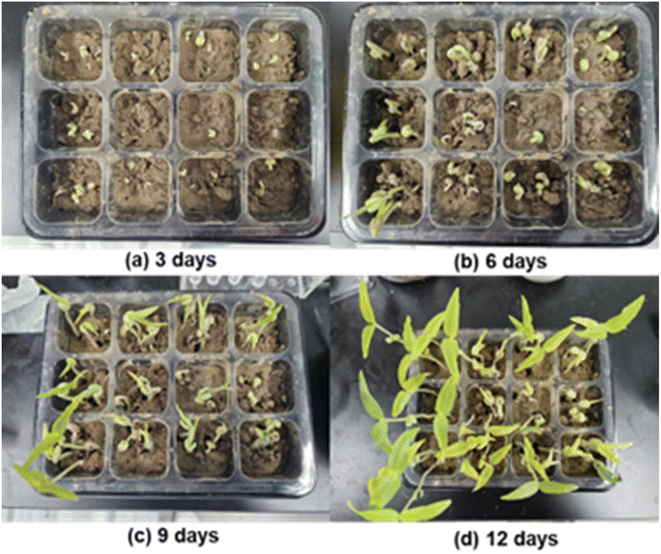 | ||
| Fig. 9 Pot experiment of mung bean growth (left 6 squares: add NH4+-MSZ; right 6 squares: no NH4+-MSZ added). | ||
4. Conclusion
MSZ was synthesized with CFA and subsequently modified with sodium acetate. The enhanced crystallinity and greater number of NH4+ exchange sites facilitated NH4+ removal from the aqueous solution, surpassing that of natural zeolite. MSZ adsorbed the ammonium following the Langmuir isotherm and pseudo-second-order kinetic model. The maximum adsorption capacity was 27.46 mg g−1, four times higher than that of natural zeolite. Moreover, the presence of 0–5 meq L−1 of typical cations (K+, Na+, Ca2+, and Mg2+) had no substantial inhibitory effect on MSZ adsorption of ammonium ions. Ammonium capture occurred spontaneously through pore diffusion and ion exchange processes. The maximum N0 of fixed bed adsorption under different working conditions was 60![[thin space (1/6-em)]](https://www.rsc.org/images/entities/char_2009.gif) 214 mg L−1. Ion exchange constituted a remarkable portion of the overall adsorption and desorption, with 77.90% ammonium adsorbed and 80.16% ammonium desorbed through ion exchange. Moreover, utilizing saturated MSZ that adsorbed ammonium could serve as a soil amendment, enhancing soil quality and promoting plant development. This study demonstrates the practicality of using MSZ to recover ammonium from wastewater and utilize them for agricultural purposes.
214 mg L−1. Ion exchange constituted a remarkable portion of the overall adsorption and desorption, with 77.90% ammonium adsorbed and 80.16% ammonium desorbed through ion exchange. Moreover, utilizing saturated MSZ that adsorbed ammonium could serve as a soil amendment, enhancing soil quality and promoting plant development. This study demonstrates the practicality of using MSZ to recover ammonium from wastewater and utilize them for agricultural purposes.
Data availability
All data underlying the results are generated and analyzed by the authors and are available as part of the article. No additional source data are included in the manuscript.Author contributions
Heng-Deng Zhou: data curation, formal analysis, methodology, software, visualization and writing – original draft. Chu-Ya Wang: conceptualization, funding acquisition, resources, supervision, validation and writing – review & editing. Qi Wang: data curation, formal analysis, project administration, software, validation and writing – review & editing. Bo-Xing Xu: methodology. Guangcan Zhu: investigation, funding acquisition and resources.Conflicts of interest
The authors declare no competing interests.Acknowledgements
The authors thank the Natural Science Foundation of Jiangsu Province (BK20211047 and BK20220038).References
- A. Alshameri, H. He, J. Zhu, Y. Xi, R. Zhu, L. Ma and Q. Tao, Appl. Clay Sci., 2018, 159, 83–93 CrossRef CAS.
- M. Sheikh, V. Vallès, C. Valderrama, J. L. Cortina and M. Rezakazemi, J. Environ. Chem. Eng., 2023, 11, 110833 CrossRef CAS.
- B. Han, C. Butterly, W. Zhang, J.-z. He and D. Chen, J. Cleaner Prod., 2021, 283, 124611 CrossRef CAS.
- Y. Li and J. Yu, Nat. Rev. Mater., 2021, 6, 1156–1174 CrossRef CAS.
- I. V. Joseph, L. Tosheva and A. M. Doyle, J. Environ. Chem. Eng., 2020, 8, 103895 CrossRef CAS.
- H. Tang, X. Xu, B. Wang, C. Lv and D. Shi, Sustainability, 2020, 12, 3423 CrossRef CAS.
- B. Makgabutlane, L. N. Nthunya, N. Musyoka, B. S. Dladla, E. N. Nxumalo and S. D. Mhlanga, RSC Adv., 2020, 10, 2416–2427 RSC.
- C. Jing, W. Xiaojun, C. Jing, Q. Mengzhu and Z. Songwei, Environ. Chem., 2019, 38, 903–910 Search PubMed.
- R. Zhao, G. Wang, H. Chen, S. Zhou, X. Sun, D. Wang, L. Huang and Z. Li, Desalin. Water Treat., 2023, 303, 59–69 CrossRef CAS.
- S. Zuo, Z. Jing, M. Tao, Z. Tao and Y. Wang, Appl. Chem. Ind., 2019, 48, 1136–1139+1145 Search PubMed.
- M. Hermassi, C. Valderrama, O. Font, N. Moreno, X. Querol, N. H. Batis and J. L. Cortina, Sci. Total Environ., 2020, 731, 139002 CrossRef CAS PubMed.
- C. Wang, G. Xu, X. Gu, Y. Gao and P. Zhao, Ceram. Int., 2021, 47, 22302–22315 CrossRef CAS.
- N. Shigemoto, H. Hayashi and K. Miyaura, J. Mater. Sci., 1993, 28, 4781–4786 CrossRef CAS.
- J. Huang, N. R. Kankanamge, C. Chow, D. T. Welsh, T. Li and P. R. Teasdale, J. Environ. Sci., 2018, 63, 174–197 CrossRef CAS.
- W. Feng, Z. Wan, J. Daniels, Z. Li, G. Xiao, J. Yu, D. Xu, H. Guo, D. Zhang, E. F. May and G. Li, J. Cleaner Prod., 2018, 202, 390–400 CrossRef CAS.
- H. N. Tran, S. J. You, A. Hosseini-Bandegharaei and H. P. Chao, Water Res., 2017, 120, 88–116 CrossRef CAS PubMed.
- K. H. Chu, Chem. Eng. J., 2020, 380, 122513 CrossRef CAS.
- X. Zhao, Q. Ma and G. Lu, Energy Fuels, 1998, 12, 1051–1054 CrossRef CAS.
- M. Sultan, T. Miyazaki and S. Koyama, Renew. Energy, 2018, 121, 441–450 CrossRef CAS.
- K. Davis and M. Tomozawa, J. Non-Cryst. Solids, 1996, 201, 177–198 CrossRef CAS.
- M. Ahmaruzzaman, Prog. Energy Combust. Sci., 2010, 36, 327–363 CrossRef CAS.
- R. Surya Murali, A. F. Ismail, M. A. Rahman and S. Sridhar, Sep. Purif. Technol., 2014, 129, 1–8 CrossRef CAS.
- X. Zhou, S. Shi, B. Ding, H. Jia, P. Chen, T. Du and Y. Wang, Environ. Sci. Pollut. Res., 2023, 30, 102803–102817 CrossRef CAS PubMed.
- J. d. C. Izidoro, D. A. Fungaro, J. E. Abbott and S. Wang, Fuel, 2013, 103, 827–834 CrossRef CAS.
- S. S. Bukhari, J. Behin, H. Kazemian and S. Rohani, Fuel, 2015, 140, 250–266 CrossRef CAS.
- Z. T. Yao, X. S. Ji, P. K. Sarker, J. H. Tang, L. Q. Ge, M. S. Xia and Y. Q. Xi, Earth-Sci. Rev., 2015, 141, 105–121 CrossRef.
- X. Ren, L. Xiao, R. Qu, S. Liu, D. Ye, H. Song, W. Wu, C. Zheng, X. Wu and X. Gao, RSC Adv., 2018, 8, 42200–42209 RSC.
- T. Taher, E. K. A. Melati, M. Febrina, S. Maulana, M. A. Asagabaldan, A. Rianjanu, A. Lesbani and R. R. Mukti, Silicon, 2023, 16, 1321–1328 Search PubMed.
- Q. He, X. Li and Y. Ren, BioChar, 2022, 4, 25 CrossRef CAS.
- L. Lin, Z. Lei, L. Wang, X. Liu, Y. Zhang, C. Wan, D.-J. Lee and J. H. Tay, Sep. Purif. Technol., 2013, 103, 15–20 CrossRef CAS.
- R. I. Yousef and B. El-Eswed, Sep. Sci. Technol., 2007, 42, 3187–3197 CrossRef CAS.
- Z. Gao, B. Li, J. Li, L. Jia and Z. Wang, Energy, 2023, 262, 125433 CrossRef CAS.
- S. S. Acharyya, S. Ghosh, Y. Yoshida, T. Kaneko, T. Sasaki and Y. Iwasawa, ACS Catal., 2021, 11, 6698–6708 CrossRef CAS.
- J. Kang, H. Liu, Y. M. Zheng, J. Qu and J. P. Chen, J. Colloid Interface Sci., 2011, 354, 261–267 CrossRef CAS PubMed.
- H. Liu, S. Peng, L. Shu, T. Chen, T. Bao and R. L. Frost, J. Colloid Interface Sci., 2013, 390, 204–210 CrossRef CAS PubMed.
- R. D. Shannon, Acta Crystallogr., Sect. A: Cryst. Phys., Diffr., Theor. Gen. Crystallogr., 1976, 32, 751–767 CrossRef.
- K. Hayamizu, Y. Chiba and T. Haishi, RSC Adv., 2021, 11, 20252–20257 RSC.
- S. Ghosh, S. S. Acharyya, T. Kaneko, K. Higashi, Y. Yoshida, T. Sasaki and Y. Iwasawa, ACS Catal., 2018, 8, 11979–11986 CrossRef CAS.
- P. L. Brown and C. Ekberg, Hydrolysis of Metal Ions, Alkali Metals, 2016, pp. 135–154, DOI:10.1002/9783527656189.ch6.
- R. Jarosz, J. Szerement, K. Gondek and M. Mierzwa-Hersztek, Catena, 2022, 213, 106125 CrossRef CAS.
Footnote |
| † Electronic supplementary information (ESI) available. See DOI: https://doi.org/10.1039/d4ra01547a |
| This journal is © The Royal Society of Chemistry 2024 |

