 Open Access Article
Creative Commons Attribution 3.0 Unported Licence
Study on the electrodeposition of uranium in chloride molten salt
Pei Wu a,
Liqin Wanga,
Jinrui Wanga,
Junhan Luob,
Yuexiang Lu
 b,
Xiaopeng Songa,
Jilian Liua,
Yongquan Qina,
Liudong Houa and
Jing Ma*a
aChina Nuclear Power Engineering Co., Ltd., Beijing 100840, People's Republic of China. E-mail: 13671212490@163.com
bInstitute of Nuclear and New Energy Technology, Tsinghua University, Beijing 100084, People's Republic of China
First published on 27th February 2024
Abstract
This study focuses on the recovery of UO2 from oxide spent fuel using electrodeposition. U3O8 was used as the initial material and dissolved in NaCl–2CsCl using NH4Cl at high temperatures by means of chlorination reaction. The electrolysis process was conducted using a three-electrode system to investigate the effects of cathode material and diameter, electrolysis temperature, electrolysis time, electrolysis voltage, and uranium concentration in the molten salt on the electrolysis reaction. By optimizing the electrolysis conditions, pure UO2 with a recovery efficiency of 97% was obtained, and the products were characterized using XRD, SEM-EDS, ICP-AES and XPS. It was found that within the scope of this experiment, increasing the cathode diameter, extending the electrolysis time, and increasing the reduction voltage appropriately all led to an improvement in the recovery efficiency of the electrolysis reaction, while other conditions had minimal effect on the reaction. Furthermore, doping of the electrolyte system was performed by adding La, Ce and Nd elements, while the removal of La showed good purification effects, with a maximum decontamination factor of 119. Furthermore, the system showed good purification effects for Nd, with a decontamination factor of 57.
1 Introduction
Nuclear energy is an important clean energy source that can effectively replace fossil fuel power generation, thereby reducing greenhouse gas emissions. In the current stage of sustainable development, the main issues related to nuclear energy include how to maximize the utilization of uranium resources and how to minimize nuclear waste.1 Dry reprocessing for spent fuel, based on molten salt electrolysis, offers unique advantages such as small-scale operations, low waste generation, high radiation tolerance, a simple process, and effective prevention of nuclear proliferation.2 It is currently considered one of the most effective methods for spent fuel reprocessing.Dry reprocessing of spent fuel is one of the critical steps in the nuclear fuel cycle. In recent years, dry reprocessing based on molten salt electrolysis has been considered one of the most effective methods for spent fuel reprocessing due to its unique advantages. The United States has developed molten salt electrorefining technology for spent metal fuel, while Russia has developed molten salt electrodeposition technology for metal oxide spent fuel. The dry reprocessing for oxide spent fuel based on molten salt system electrodeposition technology has a high maturity.3 In comparison to electrolytic refining in molten salt, the electrodeposition process is simpler, and the prepared mixed oxide of uranium and plutonium can be applied in the MOX of fast reactors.
Due to the high efficiency, conductivity, and selectivity, molten salt electrolysis method has become a commonly method for depositing metals, purifying metals and synthesizing functional materials in recent years.4–9 In the electrochemical deposition process, the dissolution and chlorination of oxides are key steps. Effectively chlorinating uranium oxide compounds in molten salt and reducing its corrosiveness to the device remains a significant challenge. For example, the Russian Research Institute of Atomic Reactors (RIAR) used Cl2 as a chlorinating agent,10 which generates a large amount of toxic and harmful exhaust gases. On the other hand, Cl2 as a chlorinating agent, can generate highly volatile UCl5 and UCl6 at high temperatures, which may lead to partial loss of uranium.11 UO2 exhibits low solubility in molten MgCl2 or CaCl2.12 Thermodynamic estimates suggest that the chlorination of UO2 is difficult in the ZrCl4–LiCl–KCl molten salt system.13 Accordingly, the aim of this experiment was to explore the recovery efficiency of UO2 from spent oxide fuel. First, UO2 was oxidized to U3O8 in an air environment.
Compared to NaCl–LiCl and NaCl–KCl eutectic salt, NaCl–2CsCl has some advantages of higher solubility for Cl2 and a lower melting point.4,14 Therefore, NaCl–2CsCl was chosen as reaction medium in the electrodeposition process. Additionally, the optimal parameters obtained from this work can be applied to the engineering field of scale expansion in the future. Considering the aspect of engineering applications, U3O8 obtained from spent fuel after high-temperature oxidation, and the dissolution of U3O8 was faster than that of UO2 under the air atmosphere.15 Therefore, U3O8 was used as a reactant to react with NH4Cl to generate UO2Cl2.11 Currently, this method proves to be effective for dissolving and chlorinating uranium oxide compounds. After cooling, the mixture was transferred to a glove box for electrolysis, leading to the production of UO2. Herrmann conducted electrolytic reduction refining on oxide spent fuel to recover metal U,16 and the decontamination factors for neodymium (Nd), cerium (Ce), and lanthanum (La) were only 25, 11, and 24.17 Considering the low decontamination factors of La, Ce and Nd by electrolytic reduction refining method, combining with the higher content of elements in real spent fuel, La, Ce and Nd were selected as doping elements for electrochemical deposition. The purity and morphology of UO2 in the product were analyzed using characterization techniques such as X-ray Diffraction (XRD), Inductively Coupled Plasma Atomic Emission Spectroscopy (ICP-AES), Scanning Electron Microscopy-Energy Dispersive X-ray Spectroscopy (SEM-EDS) and X-ray Photoelectron Spectroscopy (XPS). The recovery efficiency and decontamination factor were calculated based on the initial addition weight of U3O8 and impurity elements, laying the foundation for the industrial implementation of dry processing for depleted fuel.
2 Results and discussion
2.1 Oxidation reaction of UO2
Heating 9.9 g of UO2 at 650 °C for 5.5 h can product 10.0 g of U3O8 in a yield of 96.3%, as shown in eqn (1).
 | (1) |
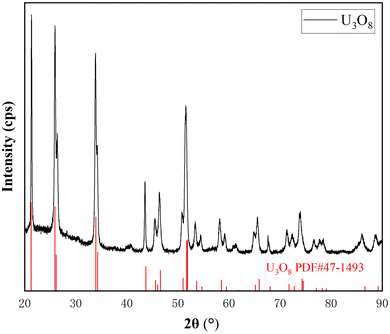
As shown in Fig. 1, the peaks in the XRD spectrum correspond to the standard card of U3O8, and there are no other peaks, indicating that UO2 has been completely oxidized to pure U3O8.
2.2 Chlorination reaction of UO2 (ref. 11 and 15)
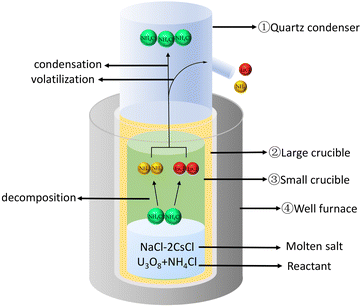
Using NH4Cl to chlorinate U3O8 to generate UO2Cl2, as shown in Fig. 2. Firstly, placed the large crucible ② (which protects the small crucible ③) into a high-temperature well furnace ④ and heated it to 650 °C in a fume hood. Mixed the prepared molten salt, U3O8, and NH4Cl evenly and added them to the small crucible ③. Then, placed the small crucible ③ into the large crucible ②, and installed a quartz condenser cover ① above it. Obviously, O2 in the air played an important role in the dissolution process, as it transformed tetravalent uranium into a higher valence state, which was the decisive factor in the formation of UO2Cl2.11,18 The reaction is shown in eqn (2).
 | (2) |
2.3 Optimization of electrodeposition reaction conditions
The Cl− in the chloride molten salt undergoes an oxidation reaction at the anode, accompanied by the formation of Cl2. While UO22+ gains electrons at the cathode and generates UO2. Different cathode has different reduction processes for UO22+.19 When W20–22 and glassy carbon23 were used, the reaction took two steps, and the formation of intermediate product UO2+ was found in the molten salt, which was unstable and easily disproportionated into UO2 and UO22+, while SnO2,24 Pt,25 graphite26 could reduce UO22+ to UO2 directly.In this experiment, the electrode material and diameter, electrolysis time, temperature, uranium concentration in molten salt, and electrolysis voltage were selected to investigate the influence of different conditions of electrodeposition reaction on the recovery efficiency of UO2.
Firstly, dissolved 0.1 g U3O8 in 10 g of molten salt (n(NaCl)![[thin space (1/6-em)]](https://www.rsc.org/images/entities/char_2009.gif) :
:![[thin space (1/6-em)]](https://www.rsc.org/images/entities/char_2009.gif) n(CsCl) = 1
n(CsCl) = 1![[thin space (1/6-em)]](https://www.rsc.org/images/entities/char_2009.gif) :
:![[thin space (1/6-em)]](https://www.rsc.org/images/entities/char_2009.gif) 2) at 650 °C, by means of Φ 6 mm graphite as anode and Φ 1 mm platinum as cathode, Φ 0.5 mm platinum was used as the reference electrode. Based on the reported Cyclic Voltammetry (CV) curves of UO2Cl2,11 the initial electrolysis voltage was selected as −1.2 V. Additionally, electrolyzed the U3O8 for 2 h at 650 °C in the argon glove box, which can act as the initial condition. After washing, centrifugation, and drying, pure UO2 was obtained with a recovery efficiency of 70%.
2) at 650 °C, by means of Φ 6 mm graphite as anode and Φ 1 mm platinum as cathode, Φ 0.5 mm platinum was used as the reference electrode. Based on the reported Cyclic Voltammetry (CV) curves of UO2Cl2,11 the initial electrolysis voltage was selected as −1.2 V. Additionally, electrolyzed the U3O8 for 2 h at 650 °C in the argon glove box, which can act as the initial condition. After washing, centrifugation, and drying, pure UO2 was obtained with a recovery efficiency of 70%.
 | (3) |
| No. | Cathode material and diameter (mm) | Temperature (°C) | Electrolysis time (h) | Uranium concentration in molten salt (U3O8 : molten salt) | Electrolysis voltage (V) | Recovery efficiency of UO2 (%) |
|---|---|---|---|---|---|---|
| 1 | Platinum Φ 1 | 650 | 2 | 1![[thin space (1/6-em)]](https://www.rsc.org/images/entities/char_2009.gif) : :![[thin space (1/6-em)]](https://www.rsc.org/images/entities/char_2009.gif) 100 100 |
−1.2 | 70 |
| 2 | Platinum Φ 2 | 650 | 2 | 1![[thin space (1/6-em)]](https://www.rsc.org/images/entities/char_2009.gif) : :![[thin space (1/6-em)]](https://www.rsc.org/images/entities/char_2009.gif) 100 100 |
−1.2 | 90 |
| 3 | Graphite Φ 5 | 650 | 2 | 1![[thin space (1/6-em)]](https://www.rsc.org/images/entities/char_2009.gif) : :![[thin space (1/6-em)]](https://www.rsc.org/images/entities/char_2009.gif) 100 100 |
−1.2 | 89 |
| No. | Cathode material and diameter (mm) | Temperature (°C) | Electrolysis time (h) | Uranium concentration in molten salt (U3O8 : molten salt) | Electrolysis voltage (V) | Recovery efficiency of UO2 (%) |
|---|---|---|---|---|---|---|
| 3 | Graphite Φ 5 | 650 | 2 | 1![[thin space (1/6-em)]](https://www.rsc.org/images/entities/char_2009.gif) : :![[thin space (1/6-em)]](https://www.rsc.org/images/entities/char_2009.gif) 100 100 |
−1.2 | 89 |
| 4 | Graphite Φ 5 | 650 | 3 | 1![[thin space (1/6-em)]](https://www.rsc.org/images/entities/char_2009.gif) : :![[thin space (1/6-em)]](https://www.rsc.org/images/entities/char_2009.gif) 100 100 |
−1.2 | 92 |
| 5 | Graphite Φ 5 | 650 | 5 | 1![[thin space (1/6-em)]](https://www.rsc.org/images/entities/char_2009.gif) : :![[thin space (1/6-em)]](https://www.rsc.org/images/entities/char_2009.gif) 100 100 |
−1.2 | 95 |
| 6 | Graphite Φ 5 | 650 | 6 | 1![[thin space (1/6-em)]](https://www.rsc.org/images/entities/char_2009.gif) : :![[thin space (1/6-em)]](https://www.rsc.org/images/entities/char_2009.gif) 100 100 |
−1.2 | 95 |
| No. | Cathode material and diameter (mm) | Temperature (°C) | Electrolysis time (h) | Uranium concentration in molten salt (U3O8 : molten salt) | Electrolysis voltage (V) | Recovery efficiency of UO2 (%) |
|---|---|---|---|---|---|---|
| 7 | Graphite Φ 5 | 600 | 5 | 1![[thin space (1/6-em)]](https://www.rsc.org/images/entities/char_2009.gif) : :![[thin space (1/6-em)]](https://www.rsc.org/images/entities/char_2009.gif) 100 100 |
−1.2 | 94 |
| 5 | Graphite Φ 5 | 650 | 5 | 1![[thin space (1/6-em)]](https://www.rsc.org/images/entities/char_2009.gif) : :![[thin space (1/6-em)]](https://www.rsc.org/images/entities/char_2009.gif) 100 100 |
−1.2 | 95 |
| 8 | Graphite Φ 5 | 700 | 5 | 1![[thin space (1/6-em)]](https://www.rsc.org/images/entities/char_2009.gif) : :![[thin space (1/6-em)]](https://www.rsc.org/images/entities/char_2009.gif) 100 100 |
−1.2 | 93 |
![[thin space (1/6-em)]](https://www.rsc.org/images/entities/char_2009.gif) :
:![[thin space (1/6-em)]](https://www.rsc.org/images/entities/char_2009.gif) 100 between U3O8 and the molten salt was chosen as the optimal concentration. This ensures a reduction in uranium usage as much as possible while maintaining ease of operation.
100 between U3O8 and the molten salt was chosen as the optimal concentration. This ensures a reduction in uranium usage as much as possible while maintaining ease of operation.
| No. | Cathode material and diameter (mm) | Temperature (°C) | Electrolysis time (h) | Uranium concentration in molten salt (U3O8 : molten salt) | Electrolysis voltage (V) | Recovery efficiency of UO2 (%) |
|---|---|---|---|---|---|---|
| 9 | Graphite Φ 5 | 650 | 5 | 1![[thin space (1/6-em)]](https://www.rsc.org/images/entities/char_2009.gif) : :![[thin space (1/6-em)]](https://www.rsc.org/images/entities/char_2009.gif) 50 50 |
−1.2 | 96 |
| 5 | Graphite Φ 5 | 650 | 5 | 1![[thin space (1/6-em)]](https://www.rsc.org/images/entities/char_2009.gif) : :![[thin space (1/6-em)]](https://www.rsc.org/images/entities/char_2009.gif) 100 100 |
−1.2 | 95 |
| 10 | Graphite Φ 5 | 650 | 5 | 1![[thin space (1/6-em)]](https://www.rsc.org/images/entities/char_2009.gif) : :![[thin space (1/6-em)]](https://www.rsc.org/images/entities/char_2009.gif) 200 200 |
−1.2 | 94 |
2.4 Characterization of UO2
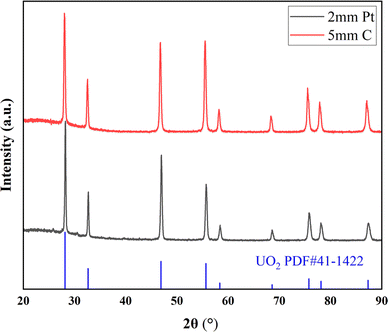
Factors such as cathode material and electrolysis voltage can influence the morphology and composition of the deposition. In this experiment, XRD, SEM-EDS, ICP-AES and XPS characterization were performed on the electrolytic product UO2 to study the deposition of different types and morphologies of particles on the electrode.Fig. 3 shows the XRD spectrum of the UO2 product obtained when using Φ 5 mm graphite and Φ 2 mm platinum as the cathodes. All peaks correspond to the standard XRD pattern of UO2, and no other peaks are observed. This confirms that both material of electrodes can product pure UO2 in the electrodeposition reaction.
The surface morphology of UO2 deposition formed under different cathodes and electrolysis voltages were analyzed using SEM-EDS. Fig. 4 presents the SEM images of the UO2 deposition obtained by electrolyzing at a constant potential of −1.2 V for 2 h in NaCl–2CsCl molten salt at 650 °C. When Φ 5 mm graphite was used as the cathode, UO2 were observed as dendritic particles (as shown in Fig. 4(a) and (b)). Conversely, when Φ 2 mm platinum was used as the cathode, UO2 products with blocky or powdered particles were obtained (as shown in Fig. 4(c) and (d)), this phenomenon was attributed to the different electrode surface roughness and solid electrolyte interface exhibited by graphite and platinum, which will affect the growth of dendrites.28 The particles size of both types of cathode depositions was in the micrometre range.
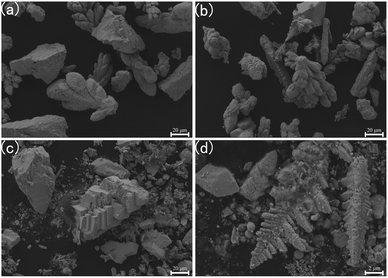 | ||
| Fig. 4 SEM image of the product after 2 h of electrolysis at 650 °C and −1.2 V; (a) and (b) deposition on Φ 5 mm graphite; (c) and (d) deposition on Φ 2 mm platinum. | ||
Fig. 5 illustrates the SEM images of the UO2 depositions obtained by electrolyzing at a constant voltage for 5 h using Φ 5 mm graphite as cathode in NaCl–2CsCl molten salt at 650 °C. Fig. 5(a) and (b) depict the products obtained at −1.6 V, exhibiting a morphology of large blocky dendritic particles. Fig. 5(c) and (d) show the products obtained at −0.8 V, consisting of smaller dendritic particles.
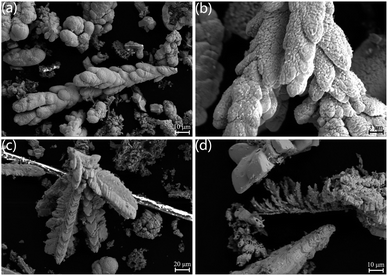 | ||
| Fig. 5 SEM image of the product obtained from electrolysis of 5 mm graphite at 650 °C for 5 h; (a) and (b) products deposited at −1.6 V; (c) and (d) products deposited at −0.8 V. | ||
The uranium–oxygen ratio of the electrodeposited products under different conditions was determined by ICP-AES. A standard curve for uranium was prepared in the range of 0–10 ppm. As shown in Table 6 (with the same number as Tables 1–5), the mass of the electrodeposited products under different conditions was accurately weighed and dissolved in 5 mL of 6 mol L−1 HNO3. Then, 75 μL of the solution was taken and diluted with deionized water to a volume of 900 μL, resulting in a 0.5 mol L−1 HNO3 solution. This solution was further diluted 66.7 times with 0.5 mol L−1 HNO3. The concentration of uranium after dilution was measured, and the masses of uranium and oxygen in the products were calculated accordingly. The uranium–oxygen ratio was determined to be 1![[thin space (1/6-em)]](https://www.rsc.org/images/entities/char_2009.gif) :
:![[thin space (1/6-em)]](https://www.rsc.org/images/entities/char_2009.gif) 2, confirming that the electrodeposited products were UO2.
2, confirming that the electrodeposited products were UO2.
| No. | Cathode material and diameter (mm) | Temperature (°C) | Electrolysis time (h) | Uranium concentration in molten salt (U3O8 : molten salt) | Electrolysis voltage (V) | Recovery efficiency of UO2 (%) |
|---|---|---|---|---|---|---|
| 11 | Graphite Φ 5 | 650 | 9 | 1![[thin space (1/6-em)]](https://www.rsc.org/images/entities/char_2009.gif) : :![[thin space (1/6-em)]](https://www.rsc.org/images/entities/char_2009.gif) 100 100 |
−0.8 | 91 |
| 5 | Graphite Φ 5 | 650 | 5 | 1![[thin space (1/6-em)]](https://www.rsc.org/images/entities/char_2009.gif) : :![[thin space (1/6-em)]](https://www.rsc.org/images/entities/char_2009.gif) 100 100 |
−1.2 | 95 |
| 12 | Graphite Φ 5 | 650 | 5 | 1![[thin space (1/6-em)]](https://www.rsc.org/images/entities/char_2009.gif) : :![[thin space (1/6-em)]](https://www.rsc.org/images/entities/char_2009.gif) 100 100 |
−1.6 | 97 |
| No. | Mass of the sample/mg | Measured concentration of uranium/ppm | Mass of uranium in the sample/mg | Uranium–oxygen ratio |
|---|---|---|---|---|
| 2 | 22.38 | 4.8755 | 19.50 | 0.46 ≈ 1![[thin space (1/6-em)]](https://www.rsc.org/images/entities/char_2009.gif) : :![[thin space (1/6-em)]](https://www.rsc.org/images/entities/char_2009.gif) 2 2 |
| 5 | 20.01 | 4.4464 | 17.79 | 0.54 ≈ 1![[thin space (1/6-em)]](https://www.rsc.org/images/entities/char_2009.gif) : :![[thin space (1/6-em)]](https://www.rsc.org/images/entities/char_2009.gif) 2 2 |
| 8 | 20.69 | 4.5441 | 18.18 | 0.49 ≈ 1![[thin space (1/6-em)]](https://www.rsc.org/images/entities/char_2009.gif) : :![[thin space (1/6-em)]](https://www.rsc.org/images/entities/char_2009.gif) 2 2 |
| 9 | 20.85 | 4.6974 | 18.79 | 0.61 ≈ 1![[thin space (1/6-em)]](https://www.rsc.org/images/entities/char_2009.gif) : :![[thin space (1/6-em)]](https://www.rsc.org/images/entities/char_2009.gif) 2 2 |
| 11 | 20.14 | 4.4071 | 17.63 | 0.47 ≈ 1![[thin space (1/6-em)]](https://www.rsc.org/images/entities/char_2009.gif) : :![[thin space (1/6-em)]](https://www.rsc.org/images/entities/char_2009.gif) 2 2 |
| 12 | 20.65 | 4.5109 | 18.04 | 0.46 ≈ 1![[thin space (1/6-em)]](https://www.rsc.org/images/entities/char_2009.gif) : :![[thin space (1/6-em)]](https://www.rsc.org/images/entities/char_2009.gif) 2 2 |
The uranium content in the molten salt after electrolysis under different conditions were determined using ICP-AES. A standard curve for uranium was prepared in the range of 0–2 ppm. The mass of the molten salt after electrolysis under different conditions were accurately weighed and dissolved in 10 mL of 0.5 mol L−1 HNO3. The uranium concentration after dilution was measured, and the mass and content of uranium in the molten salt after electrolysis were calculated accordingly. The results are shown in Table 7.
| No. | Mass of molten salt sample/mg | Measured concentration of uranium/ppm | Mass of uranium in molten salt sample/mg | The content of uranium in molten salt/% |
|---|---|---|---|---|
| 2 | 71.51 | 0.9363 | 0.009363 | 0.010 |
| 5 | 63.82 | 0.4825 | 0.004825 | 0.008 |
| 8 | 41.62 | 0.3483 | 0.003483 | 0.008 |
| 12 | 57.36 | 0.3304 | 0.003304 | 0.006 |
2.5 Doping experiment
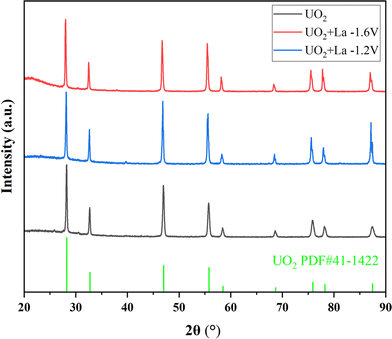
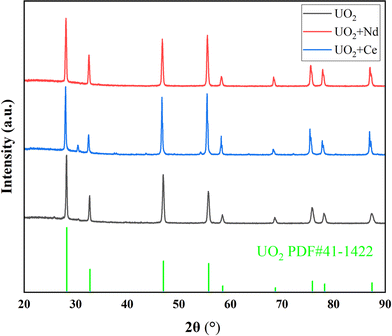
To investigate the influence of La, Ce, and Nd on uranium electrodeposition, these three elements were introduced into the reaction separately. Firstly, the doped La system was studied. Under the optimized conditions mentioned above, electrolysis was conducted at −1.2 V or −1.6 V, and the resulting products were characterized by XRD, ICP-AES, SEM-EDS, and XPS technologies to explore their effects on uranium recovery and decontamination factor.As shown in Fig. 6, when La2O3 was introduced into U3O8 and electrolysis was performed at −1.2 V or −1.6 V after chlorination, the obtained UO2 products exhibited negligible impurity peaks in the XRD spectra, the data with black line represents the UO2 product obtained under optimal conditions. To analyze the content of the doped element in the product, ICP-AES measurements were performed on the products obtained at different electrolysis voltages. As shown in Table 8, compared to the undoped blank sample, the introduction of La had no significant effect on the recovery efficiency of product. After doping with La2O3 and electrolysis at −1.2 V or −1.6 V, the La content in the UO2 products was determined to be 0.2% and 0.3%, respectively. The decontamination factors of La were calculated as DF(La) = 119 at −1.2 V and DF(La) = 79 at −1.6 V, respectively. The results indicate that electrolysis at −1.2 V is more favorable for the separation of impurity elements. The decontamination factor (DF) is calculated using the following equation.
| Entry | Doped element | Electrolysis voltages (V) | Recovery efficiency of UO2 (%) | Impurity metal content in the product (%) | Decontamination factor |
|---|---|---|---|---|---|
| 1 | La2O3 | −1.2 | 95 | 0.2 | DF(La) = 119 |
| 2 | La2O3 | −1.6 | 93 | 0.3 | DF(La) = 79 |
| 3 | CeO2 | −1.2 | 88 | 1.2 | DF(Ce) = 27 |
| 4 | Nd2O3 | −1.2 | 91 | 0.7 | DF(Nd) = 57 |
| 5 (blank) | — | −1.2 | 95 | — | — |
On the other hand, under an electrolysis voltage of −1.2 V, electrodeposition reactions were carried out for the doped CeO2 or Nd2O3 systems, and the XRD spectra of the resulting products are shown in Fig. 7, the data with black line represents the UO2 product obtained under optimal conditions. In Fig. 7, the main product was UO2, but trace impurity peaks can be observed, which may be the generation of CeOCl.29 As shown in Table 8, the recovery efficiency of the UO2 products were 88% and 91% for Ce and Nd, respectively, and the Ce and Nd contents in the UO2 products were determined to be 1.2% and 0.7%, respectively. The calculated decontamination factors were DF(Ce) = 27 and DF(Nd) = 57. The results indicate that the system doped with lanthanide elements, under the given electrolysis conditions, the recovery efficiency of UO2 was slightly reduced. This could be attributed to the formation of a thin film of lanthanide elements on the surface of UO2, which inhibits the growth of UO2 crystals.30–32 As a result, some extremely fine UO2 particles were lost during centrifugation and washing processes, leading to a decrease in the recovery efficiency of UO2. Regarding the aspect of separation, the separation of La from uranium is relatively easier, while the separation of Ce from uranium is relatively poorer.
The microstructures and elemental distribution of UO2 products obtained in the doping system were characterized by SEM-EDS respectively. As shown in Fig. 8, the electrolysis products of different doped elements were all relatively pure UO2, with the low content of impurity elements. The distribution of impurity elements was almost invisible in the EDS spectrum, which further proves the reliability of ICP-AES.
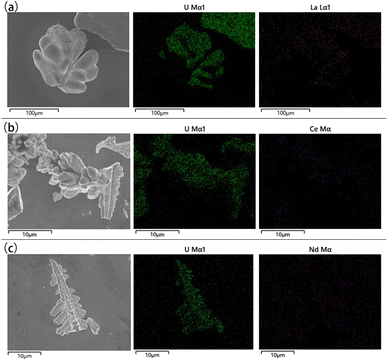 | ||
| Fig. 8 SEM-EDS spectra of different doping systems; (a) doping system with La; (b) doping system with Ce; (c) doping system with Nd. | ||
The valence states of impurity elements in the UO2 product obtained from the doped system were analyzed by XPS, and the analysis data was fitted with peak deconvolution, as shown in Fig. 9. In the product of the doped La system, the binding energy of the La element was determined to be 834.2 eV, corresponding to the characteristic peak of La, and exist in the form of LaOCl.33 In the product of the doped Ce system, the binding energies of the Ce element were determined to be 882.4, 886.2, 900.7, and 904.5 eV, all corresponding to the characteristic peaks of Ce.34 When Nd was introduced, the binding energy of Nd element was 982.5 eV, which corresponding to the characteristic peak of Nd.35,36 Considering the high temperature and the presence of trace amounts of H2O and O2 in the chloride molten salt, during the electrolysis process, LaOCl, CeOCl, NdOCl could be formed and mixed with the UO2 product.37,38
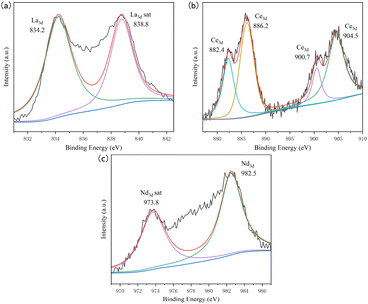 | ||
| Fig. 9 XPS spectra of different doping systems; (a) doping system with La; (b) doping system with Ce; (c) doping system with Nd. | ||
3 Conclusions
In this study, electrodeposition technology was used to investigate the recovery of UO2 from spent oxide fuel. Dissolution of U3O8 was achieved through chlorination using NH4Cl. By means of a three-electrode system, the effects of cathode material and diameter, electrolysis temperature, electrolysis time, electrolysis voltage and uranium concentration in the molten salt on the electrolysis reaction had been explored. Consequently, increasing the cathode diameter, extending the electrolysis time, and appropriately increasing the reduction voltage can all contribute to improving the recovery efficiency of the electrolysis reaction. When using Φ 5 mm graphite as the cathode, Φ 6 mm graphite as the anode, and Φ 0.5 mm platinum as the reference electrode, the temperature of 650 °C, the mass ratio of U3O8 and molten salt is 1![[thin space (1/6-em)]](https://www.rsc.org/images/entities/char_2009.gif) :
:![[thin space (1/6-em)]](https://www.rsc.org/images/entities/char_2009.gif) 100, pure UO2 was obtained by electrolytic reaction at −1.6 V for 5 h with a recovery efficiency of 97% and was characterized using XRD, SEM-EDS, ICP-AES and XPS.
100, pure UO2 was obtained by electrolytic reaction at −1.6 V for 5 h with a recovery efficiency of 97% and was characterized using XRD, SEM-EDS, ICP-AES and XPS.
Furthermore, doping experiments were conducted in this electrolyte system by introducing La, Ce, and Nd elements separately. Electrolysis voltage was performed at −1.2 V and −1.6 V, respectively. For introduction of La, the system exhibited better removal of La at −1.2 V, a decontamination factor as high as 119, which is superior to the −1.6 V (the decontamination factor decreased to 79). The system showed good purification effects for Nd, with a decontamination factor of 57 at an electrolysis voltage of −1.2 V. However, it was not effective in removing Ce, with a decontamination factor of only 27.
The further research work will be conducted on the removal of Ce in the future to achieve higher purification efficiency. Additionally, scaling up the research on electrodeposition and research on corrosion-resistant materials will be conducted to accelerate the research progress of electrolysis technology in the dry reprocessing of spent nuclear fuel.
4 Experimental section
4.1 Reagents and instruments
Sodium chloride (NaCl, anhydrous, 99.8% purity, Zancheng (Tianjin) Technology Co., Ltd.), cesium chloride (CsCl, anhydrous, 99.9% purity, Anhui Senrise Technology Co., Ltd.), and ammonium chloride (NH4Cl, anhydrous, GR grade, Aladdin Reagent (Shanghai) Co., Ltd.) were purchased. NaCl and CsCl were dried at 180 °C for over 12 h to minimize the amount of adsorbed water before use.The phases composition was analyzed and tested by X-ray diffraction (XRD) diffractometer using Miniflex 600 (Rigaku Corp.) with Cu Kα radiation at 40 kV and 40 mA. Scanning electron microscopy (SEM, ZEISS GeminiSEM 360, Zeiss Germany Inc.) was used to investigate morphology and size of samples. Energy dispersive X-ray spectroscopy (EDS, AZtecone, Oxford Instruments) was used to analyze the products' composition with SEM. And the concentrations of the uranium were tested by inductively coupled plasma atomic emission spectrometer (ICP-AES, ARCOS FHS12, Spectro Scientific). The valence states of the products were analyzed by an X-ray photoelectron spectrometer (XPS, Escalab250Xi, ThermoFisher Scientific Inc.) equipped with an Al Kalpha source.
4.2 Experiment
4.2.2.1 Chlorination reaction of pure U3O8. 1.48 g NaCl, 8.52 g CsCl, 2 g NH4Cl, and 0.1 g U3O8 were grinded thoroughly, the mixture was transferred to a corundum crucible, and heat at 650 °C for 2 h to obtain an orange solution. Then cool to room temperature yielding a yellow block solid.
4.2.2.2 Chlorination reaction of U3O8 with doping elements. Three systems were prepared with different doping elements:
(1) Doping with La element: 1.48 g NaCl, 8.52 g CsCl, 3 g NH4Cl, 0.1 g U3O8, and 49.7 mg La2O3 were accurately weighed, thoroughly mixed, and transferred to a corundum crucible. The crucible was then heated at 650 °C for 2 h and cooled to room temperature.
(2) Doping with Ce element: 1.48 g NaCl, 8.52 g CsCl, 3 g NH4Cl, 0.1 g U3O8 and 52.1 mg CeO2 were accurately weighed, thoroughly mixed, and transferred to a corundum crucible. The crucible was then heated at 650 °C for 2 h and cooled to room temperature.
(3) Doping with Nd element: 1.48 g NaCl, 8.52 g CsCl, 3 g NH4Cl, 0.1 g U3O8 and 49.5 mg Nd2O3 were accurately weighed, thoroughly mixed, and transferred to a corundum crucible. The crucible was then heated at 650 °C for 2 h and cooled to room temperature.
![[thin space (1/6-em)]](https://www.rsc.org/images/entities/char_2009.gif) :
:![[thin space (1/6-em)]](https://www.rsc.org/images/entities/char_2009.gif) n(CsCl) = 1
n(CsCl) = 1![[thin space (1/6-em)]](https://www.rsc.org/images/entities/char_2009.gif) :
:![[thin space (1/6-em)]](https://www.rsc.org/images/entities/char_2009.gif) 2) in a corundum crucible with the method in Section 4.2.2. Φ 6 mm graphite was used as the anode, Φ 1 mm platinum was used as the cathode, Φ 0.5 mm platinum was used as the reference electrode, and electrolysis at −1.6 V for 5 h inside the glovebox. A black solid product was formed, most of which fell into the molten salt, leaving only a small amount of product on the electrodes. After cooling to room temperature, added 50 mL of deionized water, stirred for 20 min to dissolve all molten salt on the cathode or in the crucible, centrifuged at 3000 rpm for 2 min, pour off the supernatant, and then wash the solid with deionized water (50 mL × 2) and anhydrous ethanol (50 mL × 2). Dry the solid at 50 °C overnight to obtain a black solid powder.
2) in a corundum crucible with the method in Section 4.2.2. Φ 6 mm graphite was used as the anode, Φ 1 mm platinum was used as the cathode, Φ 0.5 mm platinum was used as the reference electrode, and electrolysis at −1.6 V for 5 h inside the glovebox. A black solid product was formed, most of which fell into the molten salt, leaving only a small amount of product on the electrodes. After cooling to room temperature, added 50 mL of deionized water, stirred for 20 min to dissolve all molten salt on the cathode or in the crucible, centrifuged at 3000 rpm for 2 min, pour off the supernatant, and then wash the solid with deionized water (50 mL × 2) and anhydrous ethanol (50 mL × 2). Dry the solid at 50 °C overnight to obtain a black solid powder.Author contributions
Pei Wu: conceptualization, methodology, validation, investigation, formal analysis, software, writing – original draft. Liqin Wang: conceptualization, data curation, software, writing – review & editing. Jinrui Wang: investigation, writing – original draft. Junhan Luo: methodology, resources, investigation. Yuexiang Lu: resources, methodology, formal analysis. Xiaopeng Song: methodology, supervision. Jilian Liu: investigation, formal analysis, conceptualization, writing – review& editing. Yongquan Qin: supervision, project administration, funding acquisition, writing – review& editing. Liudong Hou: conceptualization, resources, supervision, funding acquisition, project administration. Jing Ma: conceptualization, resources, supervision, project administration, funding acquisition, writing – review& editing.Conflicts of interest
There are no conflicts to declare.Acknowledgements
This work was supported by the National Natural Science Foundation of China (No. 21976104).Notes and references
- H. Tang, Y.-M. Ren, L. Shao, Y. Zhong and R. Gao, J. Nucl. Radiochem., 2017, 39(6), 385–396 CAS.
- R.-S. Lin, H. He, H.-B. Tang and G.-A. Ye, At. Energy Sci. Technol., 2020, 54, 115–125 Search PubMed.
- X.-G. Liu, J. Nucl. Radiochem., 2009, 31, 35–44 Search PubMed.
- X. Liu, N. Fechler and M. Antonietti, Chem. Soc. Rev., 2013, 42, 8237–8265 RSC.
- X. Zhang, L. Zhang, T. Bo, S.-E. Huang, Z.-W. Huang and W.-Q. Shi, Chin. Chem. Lett., 2022, 33, 3527–3530 CrossRef CAS.
- S. E. Bae, Y. J. Park, S. K. Min, Y. H. Cho and K. Song, Electrochim. Acta, 2010, 55, 3022–3025 CrossRef CAS.
- J.-H. Luo, Q. Qing, L.-Q. Huang, Z. Wang, S. Liu, J. Chen and Y.-X. Lu, Chin. Chem. Lett., 2024, 35, 108483 CrossRef CAS.
- Y. Liu, K. Liu, L. Luo, L. Yuan, Z. Chai and W. Shi, Electrochim. Acta, 2018, 275, 100–109 CrossRef CAS.
- Y.-K. Zhong, K. Liu, Y.-L. Liu, Y.-X. Lu, T.-Q. Yin, L. Wang, Z.-F. Chai and W.-Q. Shi, J. Electrochem. Soc., 2019, 166, D276–D282 CrossRef CAS.
- K. Zhang, Y.-Q. Xiao, R.-S. Lin, Y.-H. Jia and H. He, J. Nucl. Radiochem., 2019, 41(3), 233–241 CAS.
- Y.-L. Liu, L.-X. Luo, N. Liu, B.-L. Yao, K. Liu, Y.-Y. Li, Z.-F. Chai and W.-Q. Shi, J. Nucl. Mater., 2018, 508, 63–73 CrossRef CAS.
- S. Dai, L. M. Toth, G. D. Del Cul and D. H. Metcalf, J. Phys. Chem., 1996, 100, 220–223 CrossRef CAS.
- Y. Sakamura, T. Inoue, T. Iwai and H. Moriyama, J. Nucl. Mater., 2005, 340, 39–51 CrossRef CAS.
- W. Ole, P. Francesco and O. Terje, Acta Chem. Scand., Ser. A, 1983, 37, 207–217 Search PubMed.
- Y.-C. Liu, Y.-L. Liu, L. Wang, Y.-K. Zhong, M. Li, W. Han, Y. Zhao, T. Zhou, Q. Zou, X. Zeng and W.-Q. Shi, J. Nucl. Mater., 2020, 542, 152475 CrossRef CAS.
- S. D. Herrmann and S. X. Li, Nucl. Technol., 2010, 171(3), 247–265 CrossRef CAS.
- Y.-Q. Wang, D.-J. Zeng, R.-S. Lin, H. He, Z.-B. Zhang, Y.-H. Liu and G.-A. Ye, J. Donghua Univ., 2021, 44(1), 82–89 Search PubMed.
- J.-H. Luo, Q. Qing, Z. Wang, S. Liu, J. Chen and Y.-X. Lu, Sep. Purif. Technol., 2024, 332, 125829 CrossRef CAS.
- D.-D. Wang, Y.-L. Liu, Y.-K. Zhong, S.-L. Jiang, Y.-C. Liu, J.-Z. Chen, W. Han, L. Wang and W.-Q. Shi, J. Electrochem. Soc., 2023, 170, 112507 CrossRef.
- T. Nagai, A. Uehara, T. Fujii and H. Yamana, J. Nucl. Mater., 2013, 439, 1–6 CrossRef CAS.
- H. Li, R. Liu, W. Han, W. Wang, Y. Zhang, Y. Sun, M. Zhang and M. Li, Electrochim. Acta, 2021, 400, 139474 CrossRef CAS.
- W. Han, X. Feng, Y. Wang, R. Liu, M. Zhang and M. Li, Sep. Purif. Technol., 2023, 308, 122965 CrossRef CAS.
- I. Uchida, J. Niikura and S. Toshima, J. Electroanal. Chem., 1981, 124, 165–177 CrossRef CAS.
- D. L. Hill, J. Perano and R. A. Osteryoung, J. Electrochem. Soc., 1960, 107, 698–705 CrossRef CAS.
- Y. Li, W. Huang and Q. Li, J. Electrochem. Soc., 2022, 169, 042505 CrossRef CAS.
- F. Satoa, M. Fukushima, M. Myochin, T. Namba, M. V. Kormilitsyn, V. S. Ishunin, A. V. Bychkov and T. Inagaki, J. Phys. Chem. Solids, 2005, 66, 675–680 CrossRef.
- Principles of the Oxide Electrowinning Process (Research Document), Japan Nuclear Cycle Development Institute, December 2003 Search PubMed.
- L.-T. Gao and Z.-S. Guo, Energy Technol., 2021, 9, 2000968 CrossRef CAS.
- Y.-P. Lan, H. Y. Sohn, A. Murali, J. Li and C. Chen, Appl. Phys. A, 2018, 124, 702 CrossRef.
- Y. Yang, M.-L. Zhou and H.-G. Li, Rare Met. Mater. Eng., 1994, 23, 52–55 CAS.
- S.-Q. Wang, G.-M. Wei and S.-X. Li, China Molybdenum Industry, 1997, 21, 99–101 Search PubMed.
- J. Zhang, Z.-Z. Luo, Y.-M. Li and Z.-W. Wang, China Molybdenum Industry, 2006, 30, 36–39 Search PubMed.
- A. F. Lucrédio, G. T. Filho and E. M. Assaf, Appl. Surf. Sci., 2009, 255, 5851–5856 CrossRef.
- G. Praline, B. E. Koel, R. L. Hance, H.-I. Lee and J. M. White, J. Electron. Spectrosc. Relat. Phenom., 1980, 21, 17–30 CrossRef CAS.
- B. Zhang, L.-F. Wang and Z.-L. Chen, Chin. J. Chem. Phys., 1997, 10(3), 265–268 CAS.
- X.-J. Zhang, H.-X. Liu, X.-J. Fan and J.-B. Fan, Acta Phys. Sin., 2013, 62(3), 037701 CrossRef.
- A. Marsal, E. Rossinyol, F. Bimbela, C. Tellez, J. Coronas, A. Cornet and J. R. Morante, Sens. Actuators, B, 2005, 109, 38–43 CrossRef CAS.
- J. Aride, J.-P. Chaminade and M. Pouchard, J. Cryst. Growth, 1982, 57, 194–196 CrossRef CAS.
| This journal is © The Royal Society of Chemistry 2024 |

