 Open Access Article
Creative Commons Attribution 3.0 Unported Licence
Uric acid quantification via colorimetric detection utilizing silver oxide-modified activated carbon nanoparticles functionalized with ionic liquid
Umar Nishan *a,
Ateeq Ahmeda,
Nawshad Muhammadb,
Mohibullah Shahc,
Muhammad Asada,
Naeem Khana,
Farman Ullahd,
Riaz Ullahe,
Essam A. Alif,
Haq Nawazg and
Amir Badshah*a
aDepartment of Chemistry, Kohat University of Science and Technology, Kohat 26000, KP, Pakistan. E-mail: umarnishan85@gmail.com; amirqau@yahoo.com
bDepartment of Dental Materials, Institute of Basic Medical Sciences Khyber Medical University, Peshawar, KPK, Pakistan
cDepartment of Biochemistry, Bahauddin Zakariya University, Multan 66000, Pakistan
dDepartment of Pharmacy, Kohat University of Science and Technology, Kohat 26000, KP, Pakistan
eDepartment of Pharmacognosy, College of Pharmacy, King Saud University, Riyadh, Saudi Arabia
fDepartment of Pharmaceutical Chemistry, College of Pharmacy, King Saud University, Riyadh, Saudi Arabia
gSchool of Chemistry and Chemical Engineering, Huaiyin Normal University, 223300, Huaiyin, Jiangsu, China
First published on 27th February 2024
Abstract
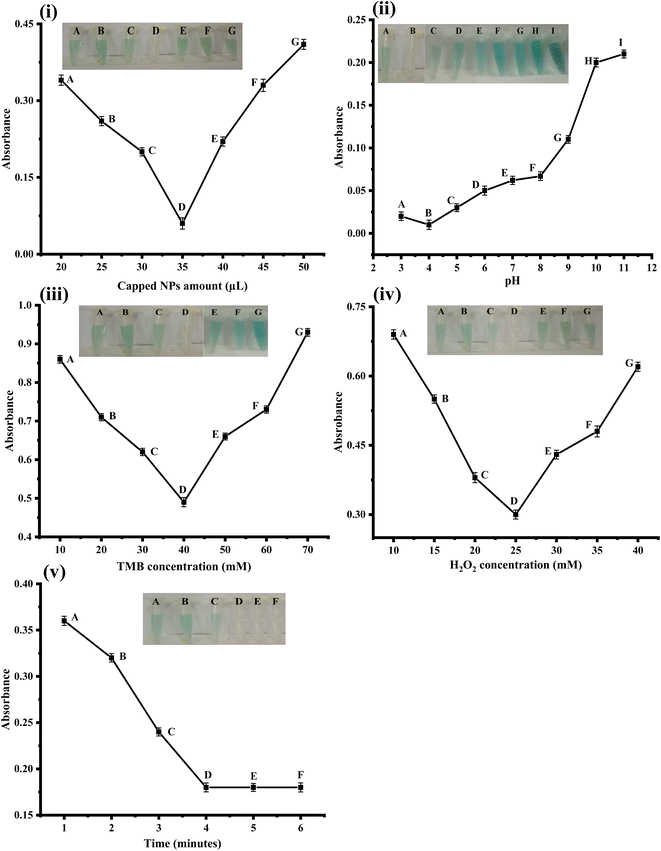
Uric acid (UA) is a significant indicator of human health because it is linked to several diseases, including renal failure, kidney stones, arthritis, and gout. Uric acid buildup in the joints is the source of chronic and painful diseases. When UA is present in large quantities, it causes tissue injury in the joints that are afflicted. In this research, silver oxide-doped activated carbon nanoparticles were synthesized and then functionalized with an ionic liquid. The synthesized nanomaterial assembly was employed as a colorimetric sensing platform for uric acid. Activated carbon offers a large internal surface area that acts as a good carrier for catalytic reactions. A salt-melting approach was used to synthesize the silver oxide-doped activated carbon nanocomposite. The synthesis was confirmed through various techniques, such as UV-vis spectrophotometer, FTIR, XRD, SEM, and EDX. The colorimetric change from blue-green to colorless was observed with the naked eye and confirmed by UV-vis spectroscopy. To obtain the best colorimetric change, several parameters, such as pH, capped NP loading, TMB concentration, hydrogen peroxide concentration, and time, were optimized. The optimized experimental conditions for the proposed sensor were pH 4 with 35 μL of NPs, a 40 mM TMB concentration, and a 4 minutes incubation time. The sensor linear range is 0.001–0.36 μM, with an R2 value of 0.999. The suggested sensor limits of detection and quantification are 0.207 and 0.69 nM, respectively. Potential interferers, such as ethanol, methanol, urea, Ca2+, K+, and dopamine, did not affect the detection of uric acid.
1 Introduction
The final product of purine derivatives in human metabolism is uric acid (UA). It is eliminated by the intestines and kidneys.1 Nutrition, age, drug use, and overall health all affect the amount of UA in the human body at varying concentrations. The range of UA in human serum is 120–460 μM.2 Serious conditions such as Lesch Nyhan syndrome, renal disorders, and gout can be brought on by abnormally high levels of UA.3 High UA levels, frequently referred to as hyperuricemia, are linked to hypertension, cardiovascular and cerebrovascular disorders, and metabolic syndrome.4 Thus, it is very crucial to develop a sensitive, accurate, and rapid platform for the detection of UA.A number of techniques have been used for the determination of UA, such as enzymatic methods,5 chemiluminescence,6 liquid chromatography,7 and electrochemiluminescence.8 However, these methods have limited applications because of the high cost and complexity of the procedures, thereby restricting their application in labs with limited resources. In comparison to the previously described methods, the colorimetric biosensor method for UA detection is extremely quick, easy to use, inexpensive, highly selective, and sensitive. Since the discovery of Fe3O4 nanoparticles as enzyme mimics,9 an increasing number of scientists have shown that nanozymes possess peroxidase-like activity. They effectively overcome the shortcomings of natural enzymes, such as their high cost, low shelf life, difficult handling, and instability.10
Activated carbons (ACs) have recently attracted a lot of attention due to their favorable physico- and electro-chemical characteristics. These include, accessibility, surface functionality, good electrical conductivity, thermal stability, low toxicity, uniform porosity, and high surface area.11 AC is a material that meets all of the requirements for usage as a catalyst support. In comparsion to conventional carriers like alumina or silica, ACs offer a larger internal surface area for a higher reaction rate and a lower cost per cubic meter. In the hydrothermal process, the addition of a tiny amount of metal ions to activated carbon led to the creation of carbon nanoparticles and gave them strong peroxidase-like activity and use in various aspects.12 The ability of iron nanoparticles was increased when they were modified with activated carbon compared to pure activated carbon.13
The capability of nanoparticles to facilitate quick electron transport between the electrode and the enzyme's active site is one of its special qualities.14 Various types of nanoparticles, including gold (AuNPs),15 zinc-oxide (ZnO-NPs),16 and iron-oxide (Fe3O4-NPs),17 have been used for enzyme immobilization to improve the stability and sensitivity of the activated carbon based biosensors. In addition, modified activated carbons are utilized in a variety of processes, including gas and air purification, water treatment, catalysis, metal extraction, energy storage, and bio and environmental applications. A large variety of chemical substances and bacterial nutrients can be effectively absorbed by AC.18
Ionic liquids are of great interest due to their unique properties, including low volatility, relatively strong ionic conductivity, chemical and thermal stability, and the capacity to dissolve a variety of compounds by appropriately altering the anions and cations.19 They can be used as a capping agent to improve the stability, electrical conductivity and deagglomeration of nanomaterials.20
In the current work, we have fabricated silver oxide-doped activated carbon using a salt melting method. The method as opposed to solvent based methods is free from the temperature limitation and can operate on temperatures as high as 1000 °C. Furthermore, the synthesized platform was functionalized with 1-H-3 methyl imidazolium acetate ionic liquid. The novelty of the current work lies in the use of silver oxide-doped activated carbon functionalized with ionic liquid for the colorimetric sensing of uric acid. The reported method is highly sensitive, selective, rapid, and simple. The chromogenic substrate 3,3′,5,5′-tetramethylbenzidine (TMB) was used with the support of H2O2. To obtain the best colorimetric response, various parameters, such as TMB concentration, ionic liquid-coated NPs, incubation time, and pH were optimized. The sensitivity and selectivity of the proposed sensor were also analyzed using the optimum conditions. The optimized platform was used successfully to detect UA in human blood serum samples with excellent sensitivity and selectivity.
2 Materials and methods
2.1 Chemicals and reagents
Sigma Aldrich provided 3,3′,5,5′-tetramethylbenzidine (TMB), sodium hydroxide (NaOH), hydrochloric acid (HCl), silver nitrate (AgNO3), and hydrogen peroxide (H2O2). BioWorld provided PBS in a range of pH levels. All of these compounds were in their pure form and were used without further purification. The solutions were made with deionized water from an Elga Purelab Ultra water deionizer, and the tests were carried out with high-quality glassware. Human serum samples were collected from a local lab (Al-Habib clinical laboratory) in Kohat and diluted to reduce the serum complexity and also to take advantage of the sensitive nature of the proposed sensor. This work was approved by the ethical committee of the Kohat University of Science and Technology, Kohat KP Pakistan via KUST/Ethical Committee/22-12.2.2 Instrumentation
The FTIR spectrometer used was from Agilent Technologies in Danbury, Conn. The FTIR spectra of the materials were obtained using a range of 4000–500 cm−1. Scanning electron microscopy (SEM) was used to examine the morphology of silver oxide-doped activated carbon nanoparticles. X-ray powder diffraction (XRD; PAN analytical, X'pert Powder) was used to analyze the size and phase of the synthesized silver oxide-doped activated carbon nanoparticles. On a UV-vis spectrophotometer, the UV-vis spectra of both the silver oxide-doped activated carbon nanoparticles and the experimental materials were recorded (Shimadzu, UV, 1800, Japan).2.3 Synthesis of silver oxide doped activated carbon
An innovative and inexpensive salt melting method was employed to synthesize silver oxide-doped activated carbon nanoparticles by utilizing a modified version of the method described elsewhere.21,22 Briefly, 5 g of silver nitrate and 10 g of activated carbon were mixed using a mortar and pestle. The combined samples were then placed in a muffle furnace in a crucible with a volume of 30 mL. The mixed sample was stored for four hours after being heated at a rate of 10 °C per minute from room temperature to 800 °C. The muffle furnace's interior was used to cool the activated sample to room temperature. After that, the synthesized NPs were processed for characterization.2.4 Characterization
The prepared nanoparticles were characterized using different techniques. These include Fourier transform infrared spectroscopy (FTIR), scanning electron microscopy (SEM), X-ray diffraction (XRD), thermogravimetric analysis (TGA), EDX, and UV-vis spectroscopy.2.5 Synthesis of ionic liquid
The preparation of 1-H-3 methylimidazolium acetate ionic liquid was done using the modified protocol previously reported by our group.23,242.6 Capping of silver oxide doped activated carbon NPs with ionic liquid
The synthesized platform (silver oxide doped AC) was functionalized by using 1-H-3-methyl imidazolium acetate ionic liquid (IL) as capping and deagglomeration agent. 1 mL of the ionic liquid was mixed with the 6 mg of the synthesized silver-oxide doped activated carbon. Using a pestle and mortar, the mixture was vigorously ground for thirty minutes. The ionic liquid-functionalized Ag2O nanoparticles were stored for further analysis. The functionalization of Ag with ionic liquid was also reported by Asad et al.252.7 Colorimetric detection of uric acid
The peroxidase-like activity of silver-doped activated carbon NPs was evaluated through colorimetric detection. In this method, 3,3′,5,5′-tetramethylbenzidine (TMB) is expected to be oxidized by H2O2 from a colorless to a blue-green product. The procedure will be carried out as follows: 50 μL of stock solution of silver-doped activated carbon NPs and 200 μL of TMB (2 mM) and 0.2 mM acetate buffer solution were mixed, followed by the addition of 200 μL of hydrogen peroxide. Subsequently, 150 μL of UA (0.36 μM) was added to the reaction solution and incubated. The expected colorimetric change was observed with the naked eye and confirmed with a UV-vis spectrophotometer.3 Results and discussion
3.1 FTIR analysis
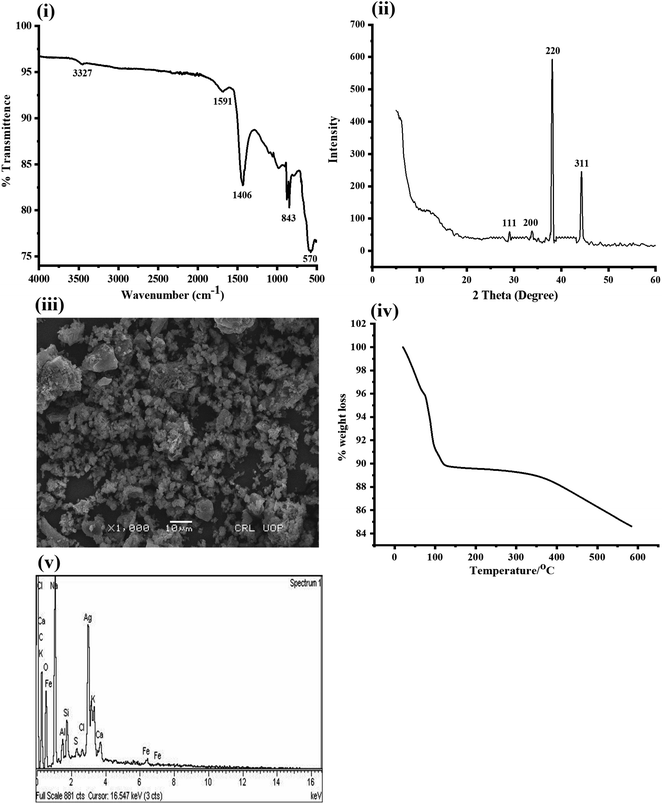
Fourier transform infrared spectroscopy was used for the determination of functional groups. Fig. 1(i) demonstrates the FTIR spectrum of the prepared silver oxide-doped activated carbon nanoparticles. The peak present at 3327 cm−1 reflect the presence of OH in our synthesized platform. The OH band at 3327 cm−1 usually comes from moisture that is present in the air. The peaks around 1591 cm−1 indicate the presence of C![[double bond, length as m-dash]](https://www.rsc.org/images/entities/char_e001.gif) C in conjugation with other functionalities. The other bands at 1406 cm−1 reflect the presence of alkyl bending functionalities. The band around 843 cm−1 is due to the presence of a C–Cl group present in the activated carbon. The final band at 570 cm−1 can be attributed to the presence of Ag–O in the platform.26
C in conjugation with other functionalities. The other bands at 1406 cm−1 reflect the presence of alkyl bending functionalities. The band around 843 cm−1 is due to the presence of a C–Cl group present in the activated carbon. The final band at 570 cm−1 can be attributed to the presence of Ag–O in the platform.26
| Element | Weight% | Atomic% |
|---|---|---|
| C | 33.56 | 51.64 |
| O | 28.42 | 32.66 |
| Na | 8.01 | 6.80 |
| Al | 1.24 | 0.90 |
| Si | 1.96 | 1.36 |
| S | 0.44 | 0.27 |
| Cl | 0.24 | 0.13 |
| K | 2.68 | 1.34 |
| Ca | 1.47 | 0.72 |
| Fe | 1.11 | 0.39 |
| Ag | 20.87 | 3.79 |
| Totals | 100.0 | 100.0 |
3.2 Colorimetric detection of uric acid
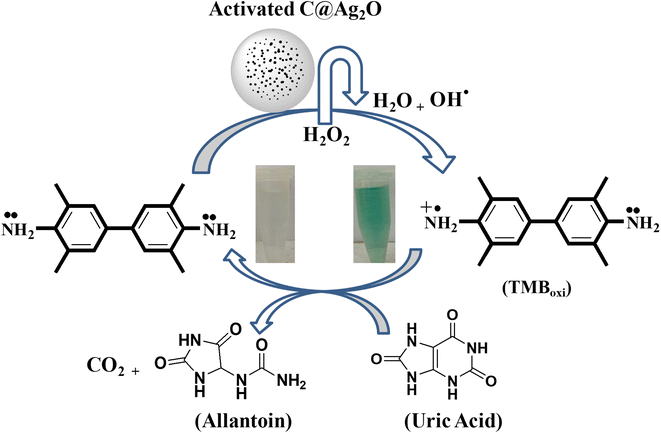
For the detection of uric acid, a simple and selective colorimetric technique based on Ag2O-doped activated carbon NPs was used. Fig. 2 depicts the optical sensing and UV-vis absorption spectra for the reaction mixture. The mimic enzyme with the assistance of hydrogen peroxide converts the colorless TMB solution to blue-green color (TMBoxi). The addition of uric acid to the reaction mixture resulted in the reduction of oxidized TMB to reduced form. This transformation was observed with the naked eye and the color of TMB solution diminished. The colorimetric change was confirmed through a UV-vis spectrophotometer as shown in the Figure.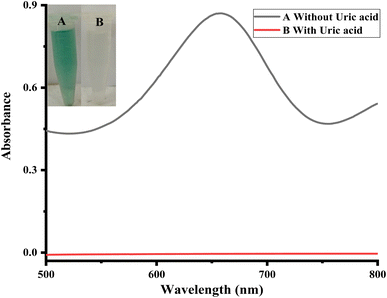 | ||
| Fig. 2 Colorimetric detection of uric acid [conditions: capping 35 μL, PBS 550 μL, TMB 200 μL (40 mM), H2O2 90 μL (25 mM), uric acid 150 μL (0.36 μM)]. | ||
3.3 Ionic liquid-capped Ag2O/activated carbon NPs based sensing of UA
In this work, we propose a simple, sensitive, and selective colorimetric approach for uric acid detection based on Ag2O-doped activated carbon NPs. Ag2O/AC NPs have intrinsic oxidase-like activity, and in the presence of hydrogen peroxide, TMB can be oxidized from colorless to blue-green oxidized TMB, generating an absorption peak at 652 nm as shown in Scheme 1. During the course of the reaction, the mimic enzyme catalyzes the production of OH free radicals from H2O2. The generated free radicals oxidize the TMB, and hence a blue-green color is produced, indicating the presence of an oxidized form of TMB. The reduction of oxidized TMB after the addition of uric acid in the presence of Ag2O/AC NPs decreased proportionally until it became completely transparent. During the reduction of TMB to its colorless form, the uric acid acts as a reducing agent. It reduces the oxidized TMB to its original, colorless form and itself oxidizes to allantoin along with the production of CO2, as shown in Scheme 1.3.4 Optimization of parameters
| S. No | Materials used | Method | Limit of detection (μM) | Linear range (μM) | References |
|---|---|---|---|---|---|
| 1 | Ag nanoprisms | Colorimetric | 0.7 | 1 to 40 | 31 |
| 2 | MIL-53(Fe) | Colorimetric | 1.3 | 4.5 to 60 | 32 |
| 3 | MoS2 nanoflakes | Colorimetric | 0.3 | 0.5–100 | 33 |
| 4 | Chitosan stabilized Au NPs | Colorimetric | 0.04 | 0.1 to 30 | 34 |
| 5 | AuNPs-GO | Colorimetric | 0.06 | 1 to 40 | 35 |
| 6 | CuS NPs | Colorimetric | 1 | 1–100 | 36 |
| 7 | PtNPs | Colorimetric | 4.2 | 1–8000 | 37 |
| 8 | μPADs modified with chitosan | Colorimetric | 37 | 130–380 | 38 |
| 9 | Fe3O4@MnO2 | Colorimetric | 0.27 | 1–70 | 39 |
| 10 | IL-Ag2O/activated carbon NPs | Colorimetric | 0.00021 | 0.001–0.36 | This work |
3.5 Selectivity study of the proposed sensor
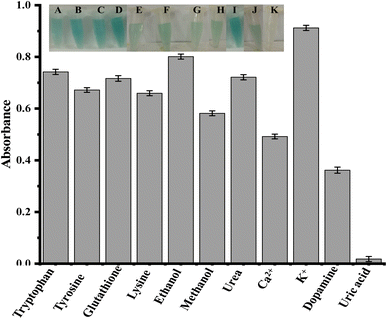
Fig. 5 shows that the selectivity of the proposed sensor was tested with potential interfering species such as tryptophan, tyrosine, glutathione, lysine, ethanol, methanol, urea, Ca2+, K+, and dopamine. Tryptophan, tyrosine, glutathione, lysine, ethanol, methanol, urea, Ca2+, K+, and dopamine have relatively high absorption values when compared to uric acid. The absorption value at 652 nm decreases when uric acid is added, as indicated in Fig. 5. As shown in Fig. 5, there was no significant decrease in absorbance when other interfering species were added. So it is concluded that, in the presence of other interfering substances, our proposed sensor can detect uric acid in the presence of other potential interfering substances.3.6 Applications of the proposed sensor
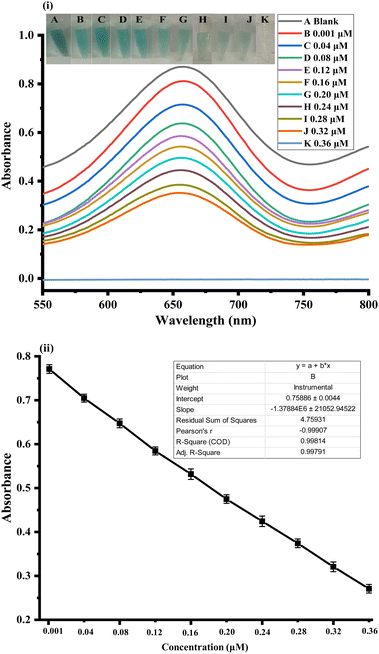
The human serum samples that were collected from the local lab were strategically diluted to bring their uric acid concentration within the linear range of the fabricated sensor. Briefly, using the previously drawn calibration plots and varying uric acid concentrations under the same experimental conditions. The concentration of uric acid in human blood serum samples was determined as shown in Fig. 6. Through this procedure, the values of uric acid in diluted serum samples were calculated to be 0.122, 0.161, and 0.203 μM.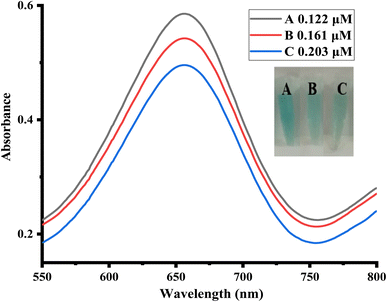 | ||
| Fig. 6 UV-vis spectra of uric acid detection in human blood serum samples (n = 3) by the dilution of the samples in line with the linear range of the fabricated sensor. | ||
4 Conclusion
In the present work, silver oxide-doped activated carbon nanoparticles were synthesized successfully by simple salt-melting. The functionalization of the synthesized material was done with an ionic liquid to achieve deagglomeration and better conductivity. The platform was successfully employed for the colorimetric detection of uric acid with exceptional sensitivity and selectivity. Comprehensive optimization experiments were performed to get the optimized conditions for the proposed sensor. The proposed sensor was applied to human serum samples for the successful detection of uric acid. The synthesized platform demonstrated intrinsic peroxidase-like activity. The utilization of silver oxide-doped activated carbon nanoparticles as peroxidase mimics for UA determination is thus considered a potential technique for bioassays and medical diagnostics.Conflicts of interest
The authors declare that there is no conflict of interests.Acknowledgements
Authors wish to thanks Researchers Supporting Project Number (RSP2024R45) at King Saud University Riyadh Saudi Arabia for financial support.References
- S.-H. Huang, Y.-C. Shih, C.-Y. Wu, C.-J. Yuan, Y.-S. Yang, Y.-K. Li and T.-K. Wu, Detection of serum uric acid using the optical polymeric enzyme biochip system, Biosens. Bioelectron., 2004, 19(12), 1627–1633 CrossRef CAS PubMed.
- X. Wang, Z. Li, J. Lai, X. Tang and P. Qiu, Sensitive and highly selective biosensor based on triangular Au nanoplates for detection of uric acid in human serum, Chem. Afr., 2018, 1(1), 29–35 CrossRef CAS.
- J. Choi, H. Lee, Y. Park, S. Kim, B. Kim, K. An, B. Kim and S. Jung, Application of silver and silver oxide nanoparticles impregnated on activated carbon to the degradation of bromate, J. Nanosci. Nanotechnol., 2016, 16(5), 4493–4497 CrossRef CAS PubMed.
- N. Dhaun, J.-L. Vachiery, R. L. Benza, R. Naeije, L.-J. Hwang, X. Liu, S. Teal and D. J. Webb, Endothelin antagonism and uric acid levels in pulmonary arterial hypertension: clinical associations, J. Heart Lung Transplant., 2014, 33(5), 521–527 CrossRef PubMed.
- Y. Jiang, A. Wang and J. Kan, Selective uricase biosensor based on polyaniline synthesized in ionic liquid, Sens. Actuators, B, 2007, 124(2), 529–534 CrossRef CAS.
- T. Zhang, X. Sun and B. Liu, Synthesis of positively charged CdTe quantum dots and detection for uric acid, Spectrochim. Acta, Part A, 2011, 79(5), 1566–1572 CrossRef CAS PubMed.
- Y. Zuo, Y. Yang, Z. Zhu, W. He and Z. Aydin, Determination of uric acid and creatinine in human urine using hydrophilic interaction chromatography, Talanta, 2011, 83(5), 1707–1710 CrossRef CAS PubMed.
- Y. Tao, X. Zhang, J. Wang, X. Wang and N. Yang, Simultaneous determination of cysteine, ascorbic acid and uric acid by capillary electrophoresis with electrochemiluminescence, J. Electroanal. Chem., 2012, 674, 65–70 CrossRef CAS.
- L. Gao, J. Zhuang, L. Nie, J. Zhang, Y. Zhang, N. Gu, T. Wang, J. Feng, D. Yang and S. Perrett, Intrinsic peroxidase-like activity of ferromagnetic nanoparticles, Nat. Nanotechnol., 2007, 2(9), 577–583 CrossRef CAS PubMed.
- Q. Wang, H. Wei, Z. Zhang, E. Wang and S. Dong, Nanozyme: An emerging alternative to natural enzyme for biosensing and immunoassay, TrAC, Trends Anal. Chem., 2018, 105, 218–224 CrossRef CAS.
- M. Sevilla and A. B. Fuertes, Direct synthesis of highly porous interconnected carbon nanosheets and their application as high-performance supercapacitors, ACS Nano, 2014, 8(5), 5069–5078 CrossRef CAS PubMed.
- Y.-W. Bao, X.-W. Hua, H.-H. Ran, J. Zeng and F.-G. Wu, Metal-doped carbon nanoparticles with intrinsic peroxidase-like activity for colorimetric detection of H2O2 and glucose, J. Mater. Chem. B, 2019, 7(2), 296–304 RSC.
- B. Deng, M. Caviness and Z. Gu, Arsenic Removal by Activated Carbon-Based Materials, ACS Publications, 2005 Search PubMed.
- P. Pandey, M. Datta and B. Malhotra, Prospects of nanomaterials in biosensors, Anal. Lett., 2008, 41(2), 159–209 CrossRef CAS.
- P. Pandey, S. P. Singh, S. K. Arya, V. Gupta, M. Datta, S. Singh and B. D. Malhotra, Application of thiolated gold nanoparticles for the enhancement of glucose oxidase activity, Langmuir, 2007, 23(6), 3333–3337 CrossRef CAS PubMed.
- A. Wei, X. W. Sun, J. Wang, Y. Lei, X. Cai, C. M. Li, Z. Dong and W. Huang, Enzymatic glucose biosensor based on ZnO nanorod array grown by hydrothermal decomposition, Appl. Phys. Lett., 2006, 89(12), 123902 CrossRef.
- J. Wang, X. W. Sun, A. Wei, Y. Lei, X. Cai, C. M. Li and Z. L. Dong, Zinc oxide nanocomb biosensor for glucose detection, Appl. Phys. Lett., 2006, 88(23), 233106 CrossRef.
- R. Al-Gaashani, D. Almasri, B. Shomar and V. Kochkodan, Preparation and properties of novel activated carbon doped with aluminum oxide and silver for water treatment, J. Alloys Compd., 2021, 858, 158372 CrossRef CAS.
- J. P. Hallett and T. Welton, Room-temperature ionic liquids: solvents for synthesis and catalysis. 2, Chem. Rev., 2011, 111(5), 3508–3576 CrossRef CAS PubMed.
- T. Li, Y. Li, Y. Zhang, C. Dong, Z. Shen and A. Wu, A colorimetric nitrite detection system with excellent selectivity and high sensitivity based on Ag@Au nanoparticles, Analyst, 2015, 140(4), 1076–1081 RSC.
- X. Liu, N. Fechler and M. Antonietti, Salt melt synthesis of ceramics, semiconductors and carbon nanostructures, Chem. Soc. Rev., 2013, 42(21), 8237–8265 RSC.
- J.-F. Ni, H.-H. Zhou, J.-T. Chen and X.-X. Zhang, Molten salt synthesis and electrochemical properties of spherical LiFePO4 particles, Mater. Lett., 2007, 61(4–5), 1260–1264 CrossRef CAS.
- U. Nishan, F. Bashir, N. Muhammad, N. Khan, A. Rahim, M. Shah, R. Nazir and M. Sayed, Ionic liquid as a moderator for improved sensing properties of TiO2 nanostructures for the detection of acetone biomarker in diabetes mellitus, J. Mol. Liq., 2019, 294, 111681 CrossRef.
- U. Nishan, U. Sabba, A. Rahim, M. Asad, M. Shah, A. Iqbal, J. Iqbal and N. Muhammad, Ionic liquid tuned titanium dioxide nanostructures as an efficient colorimetric sensing platform for dopamine detection, Mater. Chem. Phys., 2021, 262, 124289 CrossRef CAS.
- M. Asad, N. Muhammad, N. Khan, M. Shah, M. Khan, M. Khan, A. Badshah, Z. Latif and U. Nishan, Colorimetric acetone sensor based on ionic liquid functionalized drug-mediated silver nanostructures, J. Pharm. Biomed. Anal., 2022, 221, 115043 CrossRef CAS PubMed.
- S. N. Islam, S. M. A. Naqvi, S. Parveen and A. Ahmad, Application of mycogenic silver/silver oxide nanoparticles in electrochemical glucose sensing; alongside their catalytic and antimicrobial activity, 3 Biotech, 2021, 11(7), 1–11 CrossRef PubMed.
- M. Alam, A. M. Asiri, M. Uddin, M. Islam, M. R. Awual and M. M. Rahman, Detection of uric acid based on doped ZnO/Ag2O/Co3O4 nanoparticle loaded glassy carbon electrode, New J. Chem., 2019, 43(22), 8651–8659 RSC.
- M. M. Rahman, S. B. Khan, A. Jamal, M. Faisal and A. M. Asiri, Highly sensitive methanol chemical sensor based on undoped silver oxide nanoparticles prepared by a solution method, Microchim. Acta, 2012, 178(1), 99–106 CrossRef CAS.
- U. Nishan, R. Gul, N. Muhammad, M. Asad, A. Rahim, M. Shah, J. Iqbal, J. Uddin and S. Shujah, Colorimetric based sensing of dopamine using ionic liquid functionalized drug mediated silver nanostructures, Microchem. J., 2020, 159, 105382 CrossRef CAS.
- U. Nishan, W. Ullah, N. Muhammad, M. Asad, S. Afridi, M. Khan, M. Shah, N. Khan and A. Rahim, Development of a nonenzymatic colorimetric sensor for the detection of uric acid based on ionic liquid-mediated nickel nanostructures, ACS omega, 2022, 7(30), 26983–26991 CrossRef CAS PubMed.
- D. Wu, H.-F. Lu, H. Xie, J. Wu, C.-M. Wang and Q.-L. Zhang, Uricase-stimulated etching of silver nanoprisms for highly selective and sensitive colorimetric detection of uric acid in human serum, Sens. Actuators, B, 2015, 221, 1433–1440 CrossRef CAS.
- J. Lu, Y. Xiong, C. Liao and F. Ye, Colorimetric detection of uric acid in human urine and serum based on peroxidase mimetic activity of MIL-53 (Fe), Anal. Methods, 2015, 7(23), 9894–9899 RSC.
- X. Wang, Q. Yao, X. Tang, H. Zhong, P. Qiu and X. Wang, A highly selective and sensitive colorimetric detection of uric acid in human serum based on MoS2-catalyzed oxidation TMB, Anal. Bioanal. Chem., 2019, 411(4), 943–952 CrossRef CAS PubMed.
- F. Li, T. He, S. Wu, Z. Peng, P. Qiu and X. Tang, Visual and colorimetric detection of uric acid in human serum and urine using chitosan stabilized gold nanoparticles, Microchem. J., 2021, 164, 105987 CrossRef CAS.
- S. Kumar, P. Bhushan and S. Bhattacharya, Development of a paper-based analytical device for colorimetric detection of uric acid using gold nanoparticles–graphene oxide (AuNPs–GO) conjugates, Anal. Methods, 2016, 8(38), 6965–6973 RSC.
- W. Xue, T. Cheng-Ling, L. Jia-Jun, H.-Z. ZHANG and W. Jian, Ultra-small CuS nanoparticles as peroxidase mimetics for sensitive and colorimetric detection of uric acid in human serum, Chin. J. Anal. Chem., 2018, 46(5), e1825–e1831 Search PubMed.
- M. Ali, M. A. U. Khalid, I. Shah, S. W. Kim, Y. S. Kim, J. H. Lim and K. H. Choi, based selective and quantitative detection of uric acid using citrate-capped Pt nanoparticles (PtNPs) as a colorimetric sensing probe through a simple and remote-based device, New J. Chem., 2019, 43(20), 7636–7645 RSC.
- E. F. Gabriel, P. T. Garcia, T. M. Cardoso, F. M. Lopes, F. T. Martins and W. K. Coltro, Highly sensitive colorimetric detection of glucose and uric acid in biological fluids using chitosan-modified paper microfluidic devices, Analyst, 2016, 141(15), 4749–4756 RSC.
- W. Yang, J. Fei, W. Xu, H. Jiang, M. Sakran, J. Hong, W. Zhu and X. Zhou, A biosensor based on the biomimetic oxidase Fe3O4@ MnO2 for colorimetric determination of uric acid, Colloids Surf., B, 2022, 212, 112347 CrossRef CAS PubMed.
| This journal is © The Royal Society of Chemistry 2024 |

