 Open Access Article
Polydimethylsiloxane based dry adhesives produced using a replica molding technique
Hasan Talal M. Hassaniab,
Willman William Dsouzaa,
Sruthi V. Oopatha and
Avinash Baji *a
*a
aDepartment of Engineering, School of Computing, Engineering and Mathematical Sciences (SCEMS), La Trobe University, Bundoora 3086, Victoria, Australia. E-mail: a.baji@latrobe.edu.au
bJeddah Academy for Maritime Science and Security Studies, Al-Ruwais 2639-7533, Jeddah 22231, Saudi Arabia
First published on 7th May 2024
Abstract
Dry adhesives have gained considerable interest due to their applications in a wide variety of areas. This study used a replica molding technique to produce micron-sized pillars on the surface of polydimethylsiloxane (PDMS) and investigated their dry adhesion behaviour. Shear adhesion for the produced samples is measured using a tensile testing machine. For this purpose, the sample was initially brought into contact with a glass slide. Following this, the shear adhesion was determined by measuring the shear stress required to slide the sample along the glass slide. Peel adhesion of the samples was measured using an in-house designed and built peel fixture. The force required to peel the sample from the surface of the fixture was measured to determine the peel strength. The shear adhesion and peel tests were also conducted on neat PDMS to determine the effect of surface micropillars on the adhesion performance of the samples. The results show that the shear adhesion strength was 0.12 N cm−2, while the shear adhesion strength of neat PDMS was determined to be 0.02 N cm−2. Similarly, the peel strength of the samples was recorded to be 0.15 N cm−2 compared to 0.05 N cm−2 recorded for neat PDMS.
1. Introduction
In the last decade or so, materials scientists and researchers have fabricated synthetic dry adhesives by imitating the adhesive mechanisms of animals like geckos, insects, and spiders, which can cling to and climb surfaces.1–4 Geckos possess unique adhesive properties that allow them to swiftly adhere and detach from surfaces.5,6 The fibrillar structures present on the feet of these animals comprise micron-sized fibrils that further divide into hundreds of nanometre-sized structures called spatulas.5–8 This hierarchical design of the fibrillar structures induces cumulative van der Waals forces, resulting in formidable adhesion.9,10 Extensive research has been conducted to develop bioinspired dry adhesives using various materials and geometries.11–13 These synthetic dry adhesives aim to mimic the adhesive behaviour of natural materials by mimicking the hierarchical design of natural materials. Despite notable progress, replicating the complete range of gecko adhesion properties in synthetic adhesives remains an ongoing scientific challenge.A wide variety of techniques have been used to produce synthetic dry adhesives. For example, studies have used chemical vapour deposition, lithography, and micro/nano machining methods to produce synthetic dry adhesives.14,15 These studies have shown reasonable success in fabricating high aspect ratio structures. The high aspect ratio structures produced resemble the terminal units of the natural material. The produced high aspect ratio structures demonstrate remarkable adhesion, particularly on smooth surfaces such as glass. For example, studies have explored the use of high aspect ratio carbon nanotubes for dry adhesive applications. High aspect ratio carbon nanotubes (CNTs) are shown to have contacting elements that are a few nanometres in diameter. These synthetic contacting elements are 1–2 orders smaller in size compared to the natural material.16 Thus, these materials can display higher interfacial adhesion strength than the natural fibrillar structures. The contact splitting principle is attributed to the high adhesion recorded for the high aspect ratio CNTs.17 Hu et al.18 in their study proposed that hierarchical CNT arrays can display higher interfacial adhesion. Using molecular dynamics (MD) simulations, they show that hierarchical CNT structures consisting of laterally distributed CNTs on top of the vertical CNT structures display enhanced adhesion. While the CNT arrays have the potential to display high adhesion, producing CNT arrays can be challenging and cost-effective. Other studies have fabricated high aspect ratio micro and nanopillar structures based on polymer for dry adhesive applications. For example, Jeong et al.19 fabricated angled high aspect ratio polymer-based pillars and demonstrated their directional adhesive behaviour. They used an angle etching technique using a plasma etcher to produce slanted nanoholes on a polySi template. Following this, a UV-curable polyurethane acrylate is poured on the template to replicate the structures of the template on the surface of polyurethane acrylate. Although this method resulted in the nanostructures displaying high adhesion, the fabrication method adopted cannot be easily reproduced. It is reported that the adhesion of hierarchical structures can decrease after a few repeated uses as the structures tend to collapse. In addition to this, producing nanostructures and hierarchical structures are not scalable with the current manufacturing methods.
This study aims to use a simple replica molding technique to produce micron-sized pillars on the surface of polydimethylsiloxane (PDMS). Commercial templates with micron-sized structures are used in this study. Their surface topology is reproduced on PDMS using a replica molding technique. The clear advantage of using this method is that it enables us to control the dimensions of the structures by incorporating templates with desired topology during the replica molding process. The shape and dimensions of the structures produced can be easily controlled by using master templates with controlled and fine-tuned surface structures. Following this, the shear adhesion behaviour of the fabricated samples is investigated and compared with the shear adhesion behaviour of neat PDMS. Additionally, the peel strength of the samples is also investigated using an in-house designed fixture. The novelty of this article lies in the utilization of the peel test fixture to characterize the peel strength of the samples. The in-house designed peel fixture allowed for maintaining a constant peel angle during the test, ensuring that the peel adhesion measured in this study accurately represents the interfacial adhesion between the sample and the substrate. While most studies employ a T-peel test or a 180° peel test setup to determine peel strength, this method for flexible samples leads to plastic deformation of the peeling arm. The replica molding technique used can be easily extended to produce hierarchical structures. Our future studies will focus on using this method for producing high aspect ratio structures and hierarchical structures.
2. Materials and method
2.1 Materials
Polydimethylsiloxane (PDMS) and curing agent (Sylgard 184 Silicone Elastomer Kit, Dow Corning) obtained from Revolution Industrial (Victoria, Australia) were used to produce dry adhesives. A commercially available UV-curable epoxy, Norland Optical Adhesive (NOA-61) was obtained from AusOptic (Macquarie Park, NSW, Australia). The epoxy resin (Type 105 Resin) and the hardener (Type 205) were obtained from West Systems (Molendinar, QLD, Australia). 1H,1H,2H,2H-Perfluorooctyl-trichlorosilane (PTCS) used in this study was obtained from Sigma-Aldrich (North Ryde, NSW, Australia). Two different types of silicon master templates were commercially obtained and used to produce the adhesive structures. Both the templates had pillars of 5 μm in diameter on their surfaces.2.2 Fabrication
A two-step lithography method was adopted to copy the surface topology present on the commercial templates onto the surface of PDMS. Before using the commercial templates, a monolayer of silane was coated on the surface to enable easy demolding of the samples. For this purpose, the commercial templates were placed with 1–2 drops of trichloro(1H,1H,2H,2H-perfluorooctyl)silane in a vacuum chamber for 30 minutes. This process enabled the deposition of a monolayer of silane on the surface of the templates. Following the silanization, a negative imprint of the templates was produced as shown in the schematic (Fig. 1). For this purpose, epoxy resin and hardener (5![[thin space (1/6-em)]](https://www.rsc.org/images/entities/char_2009.gif) :
:![[thin space (1/6-em)]](https://www.rsc.org/images/entities/char_2009.gif) 1 wt/wt) were mixed and degassed using a vacuum oven. The epoxy mixture was then poured onto the surface of the silicon rubber stamps. Once the epoxy was fully cured, it was demolded to reveal the 5 μm diameter holes on its surface. Following this, the PDMS prepolymer was mixed with its crosslinking agent (10
1 wt/wt) were mixed and degassed using a vacuum oven. The epoxy mixture was then poured onto the surface of the silicon rubber stamps. Once the epoxy was fully cured, it was demolded to reveal the 5 μm diameter holes on its surface. Following this, the PDMS prepolymer was mixed with its crosslinking agent (10![[thin space (1/6-em)]](https://www.rsc.org/images/entities/char_2009.gif) :
:![[thin space (1/6-em)]](https://www.rsc.org/images/entities/char_2009.gif) 1) and degassed in a vacuum chamber to ensure that the PDMS was free of any bubbles. The degassed PDMS solution was then poured onto the surface of the epoxy and further cured at 50 °C for 3 hours. After the PDMS was fully cured, it was removed from the surface of the epoxy.
1) and degassed in a vacuum chamber to ensure that the PDMS was free of any bubbles. The degassed PDMS solution was then poured onto the surface of the epoxy and further cured at 50 °C for 3 hours. After the PDMS was fully cured, it was removed from the surface of the epoxy.
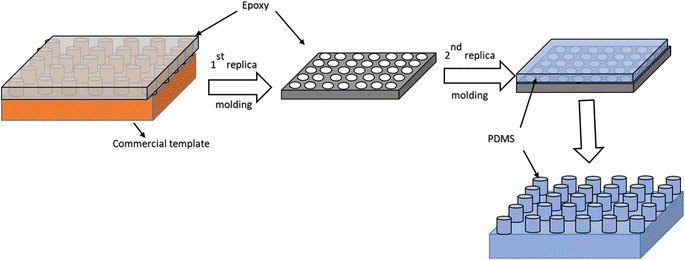 | ||
| Fig. 1 Schematic demonstrating the replica molding steps used to produce the dry adhesives. A two-step replica molding technique is used to produce micron-sized pillars on the surface of the PDMS. | ||
2.3 Microstructure
The surface topology of the fabricated samples was investigated using ultra-high resolution Schottky scanning electron microscopy (FESEM SU7000, Hitachi) at an accelerating voltage of 10 kV. The samples were sputter-coated with a thin layer of gold (18 mA, 60 s) before they were examined using SEM. The surface topology of the samples was also visualized using an atomic force microscope (AFM). The size of the structures was determined using Image J software.2.4 Contact angle
The wettability of the samples was evaluated using contact angle measurements. The contact angle made by a water droplet on the surface of the sample was measured using a contact angle goniometer. Briefly, a 3 μL water droplet was placed on the surface of the sample and the angle made by the water drop was measured.2.5 Adhesion measurement
The adhesive behaviour of the fabricated samples was determined by measuring their shear adhesion strength and peel adhesion strength using a tensile testing machine (ElectroPuls E10000, Instron Systems, Norwood, MA). The shear adhesion strength was measured by first bringing the sample in contact with a clean plastic substrate. The samples were then finger-pressed to ensure that the sample was in contact with the substrate. The pressure applied was only to initiate contact of the sample with the substrate. Care was taken to ensure that the pressure applied did not influence the adhesion measurements. Following this, the sample was pulled in shear at a rate of 0.5 mm min−1 and the shear force versus displacement was recorded. The test setup used for the shear adhesion measurement is shown in Fig. 2. A separate clean plastic substrate was used for each test.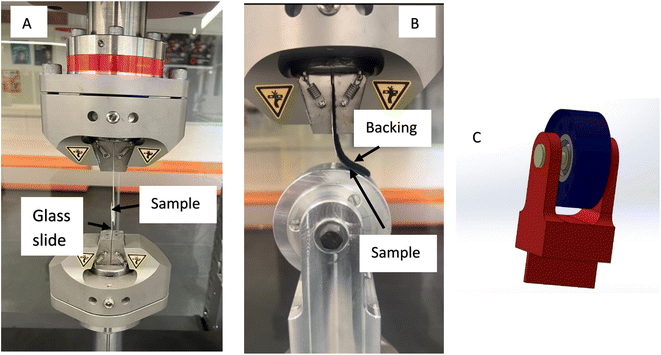 | ||
| Fig. 2 (A) Adhesion test setup used to measure shear adhesion strength and (B) peel test setup used to measure the peel strength of the samples. | ||
The peel strength of the samples was investigated using an in-house designed peel fixture as shown in Fig. 2. The peel test fixture was designed using SolidWorks software. The assembly image of the peel test fixture designed using SolidWorks software is shown in Fig. 2C. The assembly consists of the frame, disc, cover, shaft and ball bearings. All the parts were then produced using a 5-axis CNC machine and then assembled before it was used for peel adhesion measurements. The samples were finger-pressed on the disc (roller) of the peel test fixture. To ensure that the samples do not stretch, a backing layer was also pasted on the non-structured side of the sample. The designed peel fixture enabled the peeling of the samples at a constant angle.
3. Results and discussion
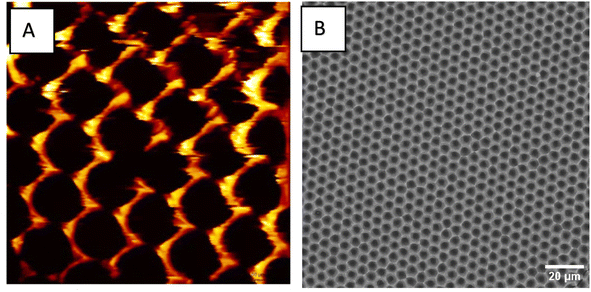
Dry adhesives have found applications in a wide variety of fields, including robotics, microgrippers and biomedical devices. In robotics, these dry adhesives are used for gripping and manipulation tasks on a variety of surfaces. They are also extensively explored for climbing robot applications. In biomedical devices, dry adhesives are actively explored for their potential in controlled drug delivery systems. It is argued that the adhesive strength of these materials can be tailored for specific applications by carefully designing and fabricating the dry adhesives. For example, adjusting the dimensions and the density of the structures can play an important role in fine-tuning the adhesion strength of the material. Among all the materials that have been used to develop dry adhesives, PDMS has proven to be a versatile material due to its innate flexibility, conformability, and capability to leverage surface interactions at the microscale. Its flexibility and elastomeric nature allow it to conform closely to the topography of the substrate. This promotes increased contact area and enables the material to display increased adhesion strength. Producing micro and nanostructures on the surface of PDMS can enable PDMS to display superior adhesion behaviour compared to other pressure-sensitive adhesives. Since the adhesion in these dry adhesives arises due to the intermolecular interactions between the surface micro and nanostructures and contact surface, the adhesion is reversible and repeatable. Currently, the researchers aim to optimize the adhesion strength of dry adhesives that are based on PDMS. It is the goal to optimize the adhesion strength under different environmental conditions and scale up the production of PDMS dry adhesives.In this study, a two-step replica molding technique is used to produce micron-sized pillars on the surface of PDMS. The first step involved the production of the negative replica of the topography found on the master templates. To facilitate easy demolding, the master templates are coated with a layer of silane. Following this, the epoxy is poured on the surface of the master templates to form a negative replica of the epoxy's surface topology. The first replica molding step resulted in the formation of micron-sized holes. These are the negative imprints of the structures found on the master template. Fig. 3 shows the representative atomic force microscope (AFM) image of the surface of epoxy obtained after the 1st replica molding step. It is clear from the image that uniform micron-sized pores are formed on the surface of epoxy. The diameter of these pores is determined to be 5 μm from the ImageJ software.
Following this, the produced epoxy with micron-sized holes is used in the second replica molding step. PDMS is poured on the surface of the epoxy and allowed to fully cure. Fig. 4 shows the SEM images of the samples fabricated using a two-step replica molding process. It is clear from Fig. 4 that the two-step replica molding process successfully copied the structures present on the master stamps onto the surface of the PDMS. Both samples, sample 1 and sample 2 are shown to have 5 μm diameter pillars on their surfaces. The spacing between the micropillars in sample 2 is seen to be higher than the spacing between the micropillars in sample 1. The spacing between the micropillars within sample 2 is determined to be 3.57 ± 0.25 μm, while the spacing between the micropillars within sample 1 is determined to be 2.1 ± 0.27 μM. This indicates that the micropillars within sample 1 are more closely packed than the micropillars present on the surface of sample 2. The height of the micropillars present in sample 2 is determined from the SEM image (Fig. 4B). The height of the micropillars of sample 1 is determined from the AFM image shown in Fig. 5. The height of the micropillars of sample 1 is determined to be 1.5 μm in length, whereas the height of the micropillars present on the surface of sample 2 is determined to be 5 μm.
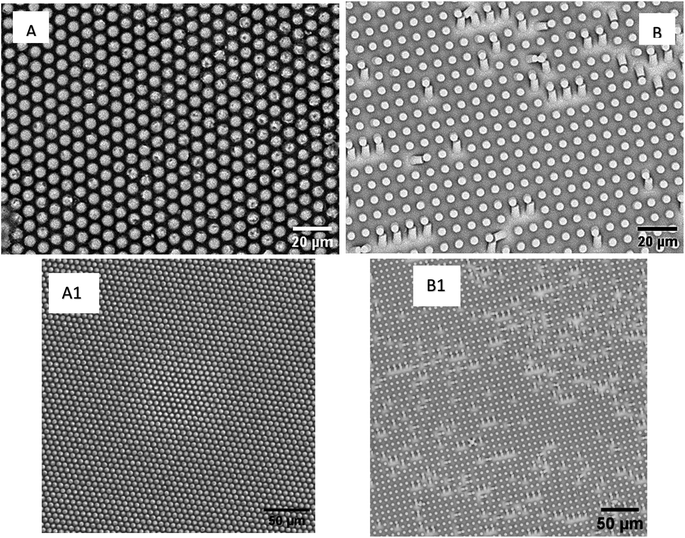 | ||
| Fig. 4 SEM images of (A) sample 1 and (B) sample 2. Their low-magnification images are shown in (A1) and (B1) respectively. | ||
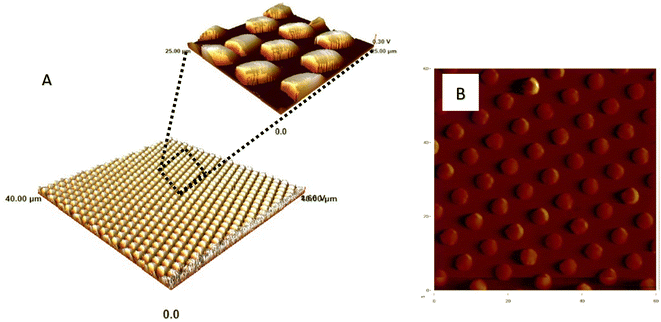 | ||
| Fig. 5 AFM image of (A) sample 1 and (B) sample 2. AFM images are used to estimate the height of pillars formed in sample 1. | ||
In the next step, the role of surface structures on the surface wettability of PDMS is investigated. The surface wettability behaviour is investigated using the static contact angle tests. PDMS film without any surface structures is prepared and used as a control sample. Fig. 6A shows the image of a water droplet on the surface of a neat PDMS film. The contact angle is measured to be ∼103° on neat PDMS film. As the contact angle measured on neat PDMS film is greater than 90°, it can be concluded that PDMS is inherently hydrophobic. Similar contact angle values are reported on neat PDMS films in literature. The hydrophobic nature of PDMS is utilized by researchers for the application of PDMS in microfluidics, biomedical devices and flexible electronics. It is accepted that the hydrophobic behaviour of PDMS can be altered by modifying its surface properties. For example, introducing surface textures on PDMS can be used to influence its surface wettability behaviour. Introducing micro and/or nanoscale features on the surface of PDMS can influence its surface topography, which can lead to an increase in the static contact angle value. Indeed, the water contact angle measured in sample 1 and sample 2 is recorded to be higher than the neat PDMS. Fig. 6B shows the image of the water drop on the surface of sample 1. The contact angle is measured to be ∼120 ± 4.6°. The contact angle on sample 2 is measured to be ∼116 ± 6.1° (not shown here), which is moderately lower than sample 1. The higher contact angle values measured on sample 1 and sample 2 indicate that both sample 1 and sample 2 are more hydrophobic compared to neat PDMS. This can be attributed to the micropillars present on their surfaces. The presence of these micropillars creates micron-sized air pockets on the surface of the samples. When a water droplet is placed on these surfaces, the water partially sits on the textured features rather than completely wetting the surface. The samples are said to exhibit the Cassie–Baxter state. In this state, the water droplet is less likely to spread across the surface and hence the contact angle is seen to be higher. Similar results are reported in the literature. For example, Lee et al.20 in their study show that neat PDMS demonstrated a contact angle of 104°. They also show that the contact angle can be improved to 155° by introducing micro/nanostructures on the surface of the PDMS. These results are useful for dry adhesion application as the material also has the potential to display self-cleaning behaviour.
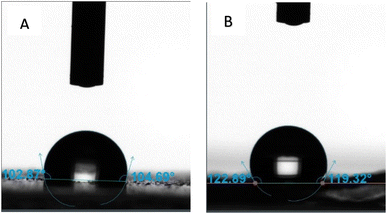 | ||
| Fig. 6 Contact angle measurements made on (A) neat PDMS surface, and (B) sample 1. The contact angle on sample 1 is much larger than the contact angle measured on neat PDMS. | ||
The adhesion performance of the samples is then quantitatively estimated by determining the total mass the sample can hold in shear before it gets delaminated from the surface. For this purpose, the samples are brought in contact with a plastic sheet that is held vertically up in its place as shown in Fig. 7. Weights are attached to the sample as shown in Fig. 7 and the total weight the sample can hold is determined. The total weight sample 1 (2 × 2 cm2) can hold in shear is seen to be around 220 g. Similarly, sample 2 (2 × 2 cm2) is seen to hold ∼180 g of total weight in shear. This shows that both sample 1 and sample 2 display adhesion. The samples are detached and tested to determine their reusability. Both the samples are tested 4–5 times, and the adhesion behaviour for them is seen to be constant.
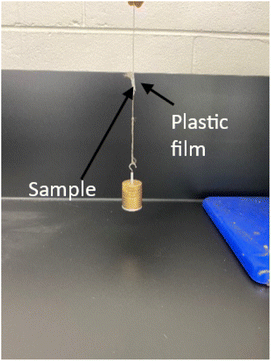 | ||
| Fig. 7 Adhesive performance of the samples is estimated by suspending weights and determining the total weight the sample can hold before it delaminates. | ||
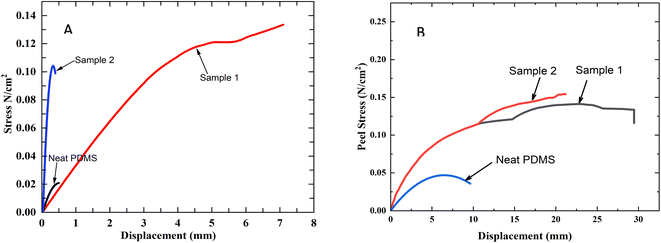
A shear test setup is then used to measure the adhesion behaviour of the samples. For comparison purposes, the shear adhesion of PDMS without any surface structures is also measured. As evident in the test setup used (see Fig. 2), the samples are adhered to a plastic substrate and pulled in shear mode. The shear adhesion behaviour of the samples is estimated from the recorded load versus displacement curves. The measured load is divided by the initial cross-sectional area that is in contact with the plastic substrate to determine the shear stress. This enabled us to plot shear stress versus displacement for the samples and enabled us to compare the adhesive performance of the samples. Fig. 8 shows the representative shear stress versus displacement curves for the samples. The shear adhesion strength of the samples is determined from shear stress versus displacement curves. The shear adhesion strength for the samples corresponds to the maximum shear stress the samples sustained before the delamination. It is clear from Fig. 8 that the neat PDMS sample exhibited the lowest adhesion strength. The shear adhesion strength of neat PDMS is determined to be ∼0.02 ± 0.007 N cm−2, while the shear adhesion strength of sample 1 and sample 2 is determined to be 0.13 ± 0.39 and 0.11 ± 0.05 N cm−2 respectively. Higher shear adhesion for sample 1 and sample 2 compared to neat PDMS can be attributed to the presence of micropillars on their surfaces. The increased contact area due to the presence of micropillars can explain the enhanced shear adhesion strength of sample 1 and sample 2. Both sample 1 and sample 2 have 5 μm diameter pillars on their surface. However, the density of the micropillars is higher on the surface of sample 1 compared to sample 2. This should explain the moderately higher value of shear adhesion strength exhibited by sample 1 in comparison to sample 2. Hensel et al.21 in their study explain that the diameter of the surface structures and the spacing between them influence the adhesion performance. Their results suggest that when the diameter of the structures is greater than the spacing between the structures, then the structures undergo small elastic deformation when they come in contact with a substrate. On the other hand, when the diameter of the structures is smaller than the spacing, the structures undergo buckling, which reduces the contact area. This results in reducing the adhesion performance of the sample. Our results agree with this finding. The diameter of the pillars in sample 1 is higher than the spacing between the micropillars. On the other hand, the diameter of the pillars in sample 2 is roughly the same size as the spacing between them. This should explain why the adhesion of sample 2 is lower than sample 1. It is also interesting to note that the slope of the stress vs. displacement recorded for sample 1 and sample 2 are drastically different. The slope of stress vs. displacement for sample 2 is higher than that of sample 1. This can be attributed to the difference in surface topography. Since sample 2 has slightly higher aspect ratio structures compared to sample 1, they can bend and deform under shear loading. This leads to a steeper initial slope. Once the maximum adhesion is achieved, the higher aspect ratio structures of sample 2, experience a higher degree of bending of pillars, leading to a rapid decrease in stress values. On the other hand, sample 1 has a smaller aspect ratio structure and hence it displays less effective adhesion initially. This explains why a slower increase in shear stress is recorded for sample 1.
In the next step, we investigated the peeling adhesion strength of the samples. For this purpose, a wheel peel fixture that is designed and fabricated in-house is used to test the peel strength of the samples. This peel fixture has a freely rotating wheel (see Fig. 2), which ensures that the peeling of the samples is kept constant at 90° throughout the test. Before the test, the samples are wrapped around the wheel and finger-pressed to bring the samples in contact with the surface of the wheel. Following this, one end of the sample is attached to the upper grip, and the sample is peeled off from the surface of the wheel. The force required to peel the sample from the surface of the wheel is measured and the peel strength is estimated. The peeling stress versus displacement recorded for the samples is shown in Fig. 8. The peel strength of the neat PDMS sample is determined to be 0.04 ± 0.01 N cm−2. The peel strength of sample 1 is determined to be 0.12 ± 0.25 N cm−2. This result clearly shows that the surface topology influences the peel strength. It is interesting to note that the peel strength of sample 2 is also determined to be 0.12 ± 0.03 N cm−2. This shows that the spacing between the micropillars did not influence the peel strength. Our future experiments will focus on varying the size of the pillars and determining the effect of pillar diameter on adhesion behaviour.
4. Conclusion
This study fabricated micropillar structures on the surface of PDMS using a replica molding technique and investigated the shear adhesion and peel adhesion behaviour of the samples. A two-step replica molding process was used to produce micron-sized pillars on the surface of PDMS. The first step of the replica molding process produced micron-sized holes on the surface of the epoxy. A second replica molding process produced micrometre-sized pillars on the surface of the PDMS. Two different master moulds were used to investigate the effect of density and aspect ratio on its adhesion behaviour. SEM images of the fabricated samples confirmed that the replica molding technique was successful in producing uniform micropillar structures on the surface of the samples. Shear adhesion strength, as well as the peel strength of the samples, were determined and compared with that of the neat PDMS. The shear adhesion strength of both samples 1 and 2 was higher than that of the neat PDMS. Shear adhesion strength recorded for sample 1 and sample 2 were 0.13 and 0.11 N cm−2 respectively. Similarly, the peel strength of sample 1 and sample 2 was higher than the neat PDMS. Peel strength for both sample 1 and sample 2 was determined to be 0.12 N cm−2.Conflicts of interest
There are no conflicts to declare.Acknowledgements
This study received support from La Trobe University Theme Investment Schemes (ABC Scheme) Grant, and the Collaboration and Research Engagement (CaRE) Grant offered by the School of Computing, Engineering and Mathematical Sciences (SEMS), La Trobe University.References
- H. E. Jeong and K. Y. Suh, Nanohairs and nanotubes: efficient structural elements for gecko-inspired artificial dry adhesives, Nano Today, 2009, 4, 335–346 CrossRef CAS
.
- W. Wang, Y. Liu and Z. W. Xie, Gecko-like dry adhesive surfaces and their applications: a review, J. Bionic Eng., 2021, 18, 1011–1044 CrossRef
.
- R. Sahay and A. Baji, Effect of pillar aspect ratio on shear adhesion strength of hierarchical electrospun fibrous structures, J. Mater. Sci., 2017, 52, 10592–10599 CrossRef CAS
.
- R. Sahay, H. Parveen, A. S. Ranganath, V. A. Ganesh and A. Baji, On the adhesion of hierarchical electrospun fibrous structures and prediction of their pull-off strength, RSC Adv., 2016, 6, 47883–47889 RSC
.
- K. Autumn, M. Sitti, Y. C. A. Liang, A. M. Peattie, W. R. Hansen, S. Sponberg, T. W. Kenny, R. Fearing, J. N. Israelachvili and R. J. Full, Evidence for van der Waals adhesion in gecko setae, Proc. Natl. Acad. Sci. U. S. A., 2002, 99, 12252–12256 CrossRef CAS
.
- A. K. Geim, S. V. Dubonos, I. V. Grigorieva, K. S. Novoselov, A. A. Zhukov and S. Y. Shapoval, Microfabricated adhesive mimicking gecko foot-hair, Nat. Mater., 2003, 2, 461–463 CrossRef CAS
.
- E. Arzt, S. Gorb and R. Spolenak, From micro to nano contacts in biological attachment devices, Proc. Natl. Acad. Sci. U. S. A., 2003, 100, 10603–10606 CrossRef CAS
.
- L. T. Qu, L. M. Dai, M. Stone, Z. H. Xia and Z. L. Wang, Carbon nanotube arrays with strong shear binding-on and easy normal lifting-off, Science, 2008, 322, 238–242 CrossRef CAS
.
- K. Autumn and A. M. Peattie, Mechanisms of adhesion in geckos, Integr. Comp. Biol., 2002, 42, 1081–1090 CrossRef
.
- H. J. Gao, X. Wang, H. M. Yao, S. Gorb and E. Arzt, Mechanics of hierarchical adhesion structures of geckos, Mech. Mater., 2005, 37, 275–285 CrossRef
.
- M. K. Kwak, C. Pang, H. E. Jeong, H. N. Kim, H. Yoon, H. S. Jung and K. Y. Suh, Towards the next level of bioinspired dry adhesives: new designs and applications, Adv. Funct. Mater., 2011, 21, 3606–3616 CrossRef CAS
.
- M. P. Murphy, S. Kim and M. Sitti, Enhanced adhesion by gecko-inspired hierarchical fibrillar adhesives, ACS Appl. Mater. Interfaces, 2009, 1, 849–855 CrossRef CAS
.
- M. Sharma, S. L. Gao, E. Mäder, H. Sharma, L. Y. Wei and J. Bijwe, Carbon fibre surfaces and composite interphases, Compos. Sci. Technol., 2014, 102, 35–50 CrossRef CAS
.
- Y. S. Li, J. Krahn and C. Menon, Bioinspired dry adhesive materials and their application in robotics: a review, J. Bionic Eng., 2016, 13, 181–199 CrossRef
.
- D. Sameoto and C. Menon, Recent advances in the fabrication and adhesion testing of biomimetic dry adhesives, Smart Mater. Struct., 2010, 19, 103001 CrossRef
.
- H. J. Gao and H. M. Yao, Shape insensitive optimal adhesion of nanoscale fibrillar structures, Proc. Natl. Acad. Sci. U. S. A., 2004, 101, 7851–7856 CrossRef CAS
.
- M. Kamperman, E. Kroner, A. del Campo, R. M. McMeeking and E. Arzt, Functional adhesive surfaces with “Gecko” effect: the concept of contact splitting, Adv. Eng. Mater., 2010, 12, 335–348 CrossRef CAS
.
- S. H. Hu, Z. H. Xia and X. S. Gao, Strong adhesion and friction coupling in hierarchical carbon nanotube arrays for dry adhesive applications, ACS Appl. Mater. Interfaces, 2012, 4, 1972–1980 CrossRef CAS
.
- H. E. Jeong, J. K. Lee, H. N. Kim, S. H. Moon and K. Y. Suh, A nontransferring dry adhesive with hierarchical polymer nanohairs, Proc. Natl. Acad. Sci. U. S. A., 2009, 106, 5639–5644 CrossRef CAS PubMed
.
- H. Lee, A. Yi, J. Choi, D. H. Ko and H. J. Kim, Texturing of polydimethylsiloxane surface for anti-reflective films with super-hydrophobicity in solar cell application, Appl. Surf. Sci., 2022, 584, 152625 CrossRef CAS
.
- R. Hensel, K. Moh and E. Arzt, Engineering micropatterned dry adhesives: from contact theory to handling applications, Adv. Funct. Mater., 2018, 28, 1800865 CrossRef
.
| This journal is © The Royal Society of Chemistry 2024 |

