 Open Access Article
Structural insights into novel therapeutic deep eutectic systems with capric acid using 1D, 2D NMR and DSC techniques with superior gut permeability†
Bayan Alkhawaja a,
Faisal Al-Akayleh
 *a,
Jehad Nasereddin
 b,
Muhammad Kamran
 c,
Tim Woodmand,
Zaid Al-Rubayea,
Nidal Qinnaa,
Mayyas Al-Remawia and
Ali R. Olaimate
aFaculty of Pharmacy and Medical Sciences, University of Petra, Amman, Jordan. E-mail: falakayleh@uop.edu.jo
bDepartment of Pharmaceutical Sciences, Faculty of Pharmacy, Zarqa University, Zarqa, 13110, Jordan
cDepartment of Chemistry, University of Bath, Claverton Down, BA2 7AY, Bath, UK
dDepartment of Life Sciences, University of Bath, Claverton Down, BA2 7AY, Bath, UK
eDrug Directorate, Jordan Food and Drug Administration, Shafa Badran, Amman, 11181, Jordan
First published on 7th May 2024
Abstract
Therapeutic deep eutectic solvents (THEDSs) are the best exemplification of green alternative formulations of active pharmaceutical ingredients (APIs) that offer superlative properties of APIs. Previously, THEDESs of risperidone, fentanyl and levofloxacin with capric acid (CA) were developed by our group. These APIs share cyclic tertiary amine nuclei. Herein, DESs of two drugs bearing cyclic tertiary amine nucleus, namely, droperidol and aripiprazole, in the presence of CA, were investigated as model drugs. Comprehensive analyses were conducted using liquid-state 1D and 2D NMR and differential scanning calorimetry (DSC) to elucidate the regiochemistry and thermodynamic mechanisms bringing about those THEDESs. Everted gut sac technique was used to study the flux of the developed THEDESs. 1D and 2D NMR techniques analyses revealed the importance of cyclic tertiary amine nuclei in forming interactions with CA. This was confirmed by the downfield shift of the protons proximal to the tertiary amine groups compared to the individual drugs. Diffusion NMR analysis (DOSY) showed a significant reduction in the diffusion coefficient of CA in the mixed system compared with CA in isolation. Thermal analysis of the two drugs revealed that the drugs have a low tendency to recrystallise upon melting but rather vitrify from a melt to form an amorphous solid. Interestingly, the superior absorption and flux of the THEDES formulation of droperidol was demonstrated using the ERIS. Collectively, this work provides a green method to attain liquid formulations of APIs with enhanced pharmacokinetic features.
1 Introduction
Deep eutectic solvents (DESs) are mixtures of hydrogen bond donors (HBDs) and hydrogen bond acceptors (HBAs) with considerably lower melting points than their individual components. DESs are generally prepared by direct mixing or mechanical grinding in solvent-free conditions, sometimes with heating of the components in specific molar ratios.1–3 DESs are a highly versatile group of low-melting systems brought about due to the increase of the system entropy.4 DESs possess attractive features, encompassing thermal and chemical stability, low vapour pressure, high viscosity, and low flammability. In addition, due to their attractive versatility, DESs could be tailored and prepared according to the deviated aims, rendering them task-specific solvents, hence offering ubiquitous applications.5,6 Globally, interest in finding safer and easier-to-handle alternatives to organic solvents has gained significant attention. Consequently, DESs could provide greener and less toxic substitutes for organic counterparts.7–10Owing to their versatility, biocompatibility, and sustainability, DESs are increasingly involved in a multitude of pharmaceutical applications.11,12 Ranging from being solvents for active pharmaceutical ingredients (APIs) to being utilised in drug delivery systems, DESs offered widespread advantages in the pharmaceutical realm. To this end, many recent reports displayed the utility of DESs in enhancing drug solubility of poorly soluble drugs,10,13–15 permeability,9 stability,16 drug delivery, as well as being involved in the synthesis and extraction of active pharmaceutical ingredients.17
More interestingly, DESs of APIs, where the API acts as a component of the DES or IL, or what is known as therapeutic DESs (THEDESs), is another direct application of enhancing the pharmaceutical characteristics in a safer and greener approach.18 Forming the so-called hydrophobic DES, fatty acid-based DESs have been applied in various potential non-aqueous administrations.18–21 Previously, DESs based on fatty acids have been formed with a multitude of APIs, such as menthol,22 fentanyl,23 propranolol,24 risperidone18 and levofloxacin.25 The most significant advantage of DES based on biocompatible fatty acids is the realisation of these properties under mild and solventless conditions.26
The common consensus within the literature is that hydrogen bond interactions are the main interactions bringing about the formation of DES.22 In-depth evaluation of the literature in the field of DESs and THEDESs has highlighted the limited understanding of the structural aspects of such systems, including predicting the propensity to form hydrogen bond interactions based on the chemical structure of APIs, thermodynamic behaviour or physical characteristics related to the lattice properties of the crystals of DES formers.
In our endeavours to generate deep understanding of DESs, we present in this work two novel THEDESs. Studying their chemical structures, some THEDEs with CA, such as fentanyl, risperidone and levofloxacin, share a cyclic tertiary amine moiety (Table 1).18,25 Therefore, we envisaged evaluating the interactions between APIs possessing similar nuclei and CA, primarily using 1D and 2D NMR and DSC techniques. The selection criteria of the drugs in this work, namely droperidol (Drp) and aripiprazole (Arp), was based on their chemical structure; hence, we anticipated similar interactions. Building upon our previous findings, the primary aim of this work is to underline the regiochemistry and thermodynamic interactions taking place in two novel THEDESs with CA. Furthermore, we sought to study the direct application of this system through the evaluation of the absorption and permeation of the THEDSs of Drp using the everted rat intestinal sac (ERIS) technique.
| API | Structure | pKa | Solubilitya | Tm (°C) | Medical uses | Ref. |
|---|---|---|---|---|---|---|
| a Aqueous solubility at 25 °C, all records were obtained from PubChem.27b Solubility at 20 °C. Tm (melting point). | ||||||
| Risperidone |  |
8.76 | 2.16 | 171 (ref. 28) | Treatment of schizophrenia, bipolar mania and psychosis | 29 |
| Fentanyl |  |
8.99 (ref. 30) | 0.2 | 83–84 | Opioid analgesic for pain management | 30 and 31 |
| Levofloxacin |  |
Basic pKa 8.12 and acidic pKa 6.1 | Sparingly soluble | 225–227 | Broad-spectrum antibacterial drug | 25, 32 and 33 |
| Droperidol (Drp) | 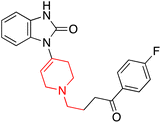 |
7.46 | 4.21 | 145–146.5 | Management of the nausea and vomiting in surgical and diagnostic procedures | 34 and 35 |
| Aripiprazole (Arp) |  |
7.6 | 0.045 | 137–140 | Treatment of many forms of mood and psychotic disorders | 36 |
| Capric acid (CA) |  |
4.9 | 0.062 | 31.5 | — | 37 |
| Methyl caprate (MC) |  |
— | 0.004b | −18.0 | — | 38 |
2 Results and discussion
2.1 1D and 2D NMR studies
The plausible interaction behind the formed DES is the hydrogen bond interaction between CA and Drp, as seen previously with DES between CA and menthol.43 To investigate this further, Drp and CA binary mixtures were prepared by increasing the molar ratio of Drp to CA by physical mixing. Amongst the prepared mixtures, D1 (0.9![[thin space (1/6-em)]](https://www.rsc.org/images/entities/char_2009.gif) :
:![[thin space (1/6-em)]](https://www.rsc.org/images/entities/char_2009.gif) 0.1), D2 (0.8
0.1), D2 (0.8![[thin space (1/6-em)]](https://www.rsc.org/images/entities/char_2009.gif) :
:![[thin space (1/6-em)]](https://www.rsc.org/images/entities/char_2009.gif) 0.2) and D3 (0.7
0.2) and D3 (0.7![[thin space (1/6-em)]](https://www.rsc.org/images/entities/char_2009.gif) :
:![[thin space (1/6-em)]](https://www.rsc.org/images/entities/char_2009.gif) 0.3) transformed into liquid form, whereas the rest of the binary mixtures transformed into a pasty form (Table 3). Initially, the binary mixtures were investigated by 1D and 2D NMR experiments.
0.3) transformed into liquid form, whereas the rest of the binary mixtures transformed into a pasty form (Table 3). Initially, the binary mixtures were investigated by 1D and 2D NMR experiments.
It is well established that hydrogen bonding interactions could cause a downfield shift (higher frequency) of the carboxylic acid protons due to the deshielding effect.44 However, our system couldn't assign the carboxylic acid protons due to their exchangeability (Fig. S1†). Hence, we focused on the change of the chemical shifts of Drp protons. To this end, comparing the chemical shifts between the different mixtures of CA and Drp, most of the protons of Drp exhibited no change in their chemical shifts with the increasing ratio of CA (Fig. S1†).
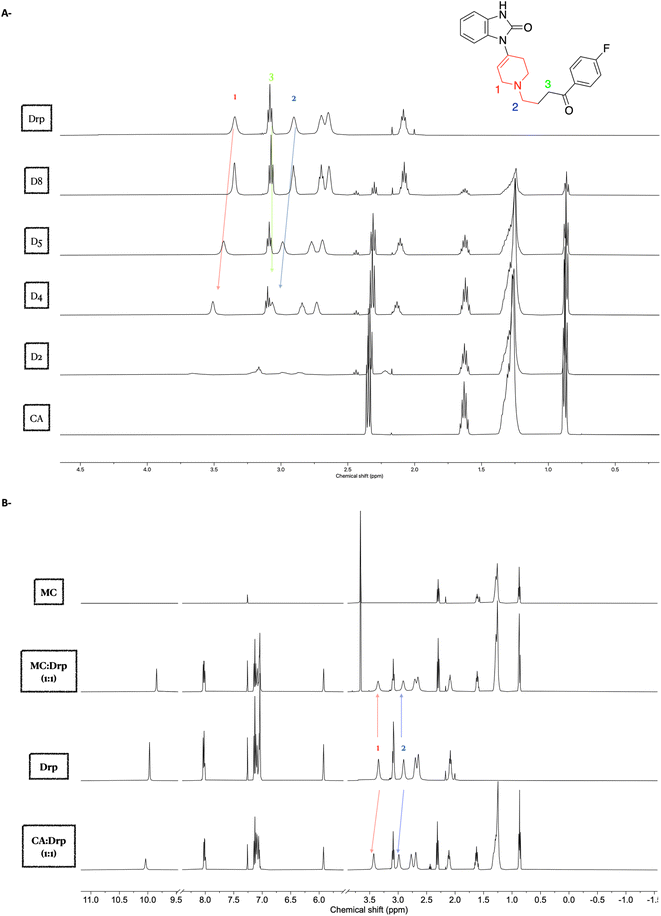
Nevertheless, a significant downfield shift was observed for the protons located at 3.35 ppm (1) and 2.90 ppm (2), assigned to the protons adjacent to the piperidine ring (Fig. 1A). The positive Δδ (chemical shift deviation) was calculated for the protons at 3.35 ppm (1) and 2.90 ppm (2) of Drp with CA and found to be 0.08 ppm and 0.09 ppm, respectively. These shifts indicate that these protons are either deshielded or the electron density is altered due to the interactions between the piperidine amine and the carboxylic acid of the CA. The observed downfield shift was also reported previously, where the proximal protons of the cyclic tertiary amine of levofloxacin.25
The tertiary amine group of the piperidine ring is expected to interact with CA by forming a hydrogen bond. Therefore, the proximal protons to the piperidine amine are anticipated to be in a new chemical environment due to this newly formed interaction. It is known that the formation of hydrogen bonding with the amine group leads to the increase in the acidity of the proximal protons, and hence, this could explain the observed downfield shift of the protons (1) and (2) (Fig. 1A).45 Their chemical shifts reflect the chemical environment of the protons, the more the electron-withdrawing effect surrounding the protons (more acidic protons), the higher the resonance frequency (higher chemical shift) will be observed. The presence of the neighbouring hydrogen has caused the downfield shift of the proximal protons, as outlined above. In contrast, distal protons to the piperidine ring, such as proton at 3.08 ppm (3), did not exhibit such change in the chemical shift (Fig. 1A).
To validate the observed 1H NMR shifts in the eutectic mixtures and to draw more comprehensive conclusions around the underlying interactions between Drp and CA, we set out to compare the interaction between the eutectic mixture of both CA and Drp with the binary mixture of methyl ester caprate (MC) and Drp. MC lacks the CA hydroxy group and hence is incapable of being a hydrogen bond donor with Drp. To this end, MC and Drp binary mixtures were prepared at equimolar ratio, and their 1H NMR spectra were compared. The positive Δδ (chemical shift deviation) of the protons at 3.35 ppm (1) and 2.90 ppm (2) of Drp with CA (0.08 ppm and 0.09 ppm, respectively) as observed earlier were not observed in the case of a binary mixture of Drp and MC (Fig. 1B). The attained results confirm the essential role of the carboxylic acid group of CA in forming the eutectic mixture with Drp.
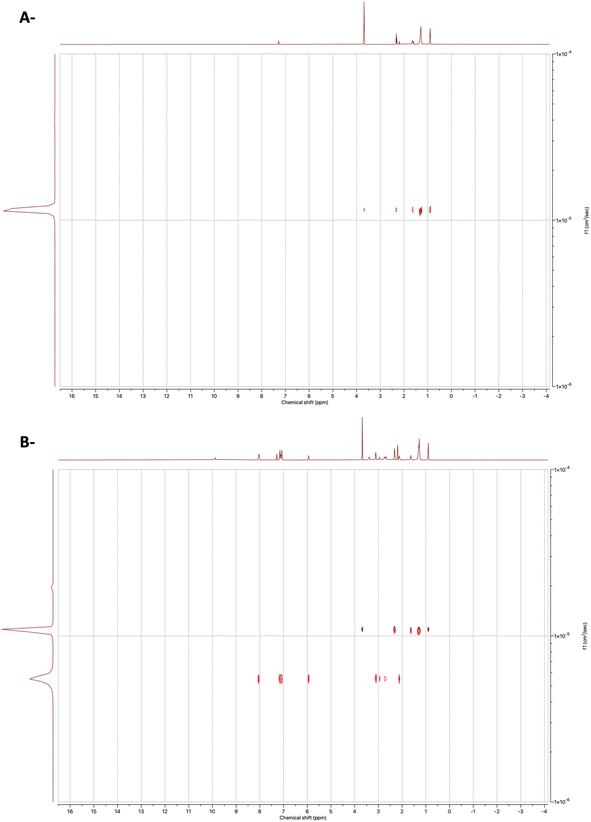
Next, we set out to study the interactions using 1H Diffusion NMR spectroscopy experiments of the binary mixtures and individual components in the CDCl3. Diffusion NMR experiments, sometimes called DOSY (Diffusion Ordered Spectroscopy), provide a means for studying the interactions between the compounds by providing a 2D spectrum in which one axis is the chemical shift while the other is the diffusion coefficient.46 The advanced data analysis module of Mestrenova was used to create two-dimensional spectra with NMR chemical shifts (X-axis) and the diffusion coefficients (Y-axis) and to calculate the diffusion coefficients (F). As shown in Fig. 2C and D, the binary mixture exhibited a related diffusion rate compared to the separate compounds (Fig. 2).
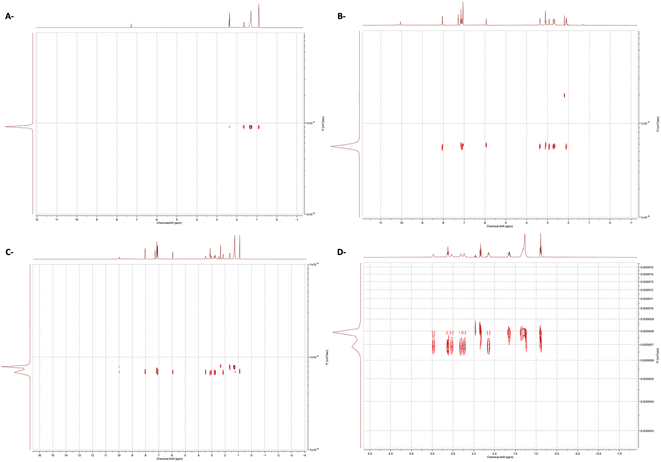 | ||
Fig. 2 DOSY 1H spectra of (A) CA, (B) Drp, (C) binary 1![[thin space (1/6-em)]](https://www.rsc.org/images/entities/char_2009.gif) : :![[thin space (1/6-em)]](https://www.rsc.org/images/entities/char_2009.gif) 1 mixture of Drp and CA and (D) binary 1 1 mixture of Drp and CA and (D) binary 1![[thin space (1/6-em)]](https://www.rsc.org/images/entities/char_2009.gif) : :![[thin space (1/6-em)]](https://www.rsc.org/images/entities/char_2009.gif) 1 mixture of Drp and CA with expansion. The solvent was CDCl3. 1 mixture of Drp and CA with expansion. The solvent was CDCl3. | ||
Previously, diffusion experiments were performed to study the strength of hydrogen bonding, where the reduction of the diffusion coefficient was directly correlated with the H-bond strength.47 Herein, following the same methodology, the change in diffusion coefficient was employed to study the strength of interactions present in our system. The change in diffusion coefficients of the binary mixture of Drp and CA was evaluated relative to the individual components in the same solvent (Table 2). A decrease in the diffusion coefficient of CA revealed the strong interactions within the eutectic mixture of the Drp and CA. Generally, diffusion NMR experiments were previously used to study the strength of intermolecular interactions.48,49 However, to the best of our knowledge, this is the first study that demonstrates the effectiveness of the diffusion NMR technique for evaluating the strength of intermolecular interactions in THEDESs.
![[thin space (1/6-em)]](https://www.rsc.org/images/entities/char_2009.gif) :
:![[thin space (1/6-em)]](https://www.rsc.org/images/entities/char_2009.gif) 1 complexes
1 complexes
| Compound | FCA | FDrp | FMC | FDrp |
|---|---|---|---|---|
| (×10−6) | (×10−6) | (×10−5) | (×10−6) | |
| Individual component | 9.03 | 5.72 | 1.15 | 5.72 |
Binary mixture (1![[thin space (1/6-em)]](https://www.rsc.org/images/entities/char_2009.gif) : :![[thin space (1/6-em)]](https://www.rsc.org/images/entities/char_2009.gif) 1) 1) |
7.82 | 6.79 | 1.06 | 5.33 |
To further validate the attained results, a diffusion experiment for the equimolar mixture of Drp and MC was also conducted (Fig. 3). The diffusion coefficients were calculated for the mixture of MC and Drp (Table 2). No significant difference was observed between the diffusion coefficients of the mixture and the individual components, proposing the absence of any interactions. Altogether, the diffusion experiment results of the MC and Drp mixture signify the presence of strong interactions in the eutectic mixture of Drp and CA, as demonstrated previously.
Binary mixtures of Arp and CA were prepared with an increasing molar ratio of Arp to CA. Amongst the prepared mixtures, A1 (0.9![[thin space (1/6-em)]](https://www.rsc.org/images/entities/char_2009.gif) :
:![[thin space (1/6-em)]](https://www.rsc.org/images/entities/char_2009.gif) 0.1) and A2 (0.8
0.1) and A2 (0.8![[thin space (1/6-em)]](https://www.rsc.org/images/entities/char_2009.gif) :
:![[thin space (1/6-em)]](https://www.rsc.org/images/entities/char_2009.gif) 0.2) were transformed into liquid form, whereas the rest of the binary mixtures were transformed into a pasty form (Table 3).
0.2) were transformed into liquid form, whereas the rest of the binary mixtures were transformed into a pasty form (Table 3).
| Eutectic binary mixtures | Ratios (mol) | Eutectic binary mixture form |
|---|---|---|
CA![[thin space (1/6-em)]](https://www.rsc.org/images/entities/char_2009.gif) : :![[thin space (1/6-em)]](https://www.rsc.org/images/entities/char_2009.gif) Drp Drp |
1![[thin space (1/6-em)]](https://www.rsc.org/images/entities/char_2009.gif) : :![[thin space (1/6-em)]](https://www.rsc.org/images/entities/char_2009.gif) 0 (CA) 0 (CA) |
— |
0.9![[thin space (1/6-em)]](https://www.rsc.org/images/entities/char_2009.gif) : :![[thin space (1/6-em)]](https://www.rsc.org/images/entities/char_2009.gif) 0.1 (D1) 0.1 (D1) |
Liquid | |
0.8![[thin space (1/6-em)]](https://www.rsc.org/images/entities/char_2009.gif) : :![[thin space (1/6-em)]](https://www.rsc.org/images/entities/char_2009.gif) 0.2 (D2) 0.2 (D2) |
Liquid | |
0.7![[thin space (1/6-em)]](https://www.rsc.org/images/entities/char_2009.gif) : :![[thin space (1/6-em)]](https://www.rsc.org/images/entities/char_2009.gif) 0.3 (D3) 0.3 (D3) |
Liquid | |
0.6![[thin space (1/6-em)]](https://www.rsc.org/images/entities/char_2009.gif) : :![[thin space (1/6-em)]](https://www.rsc.org/images/entities/char_2009.gif) 0.4 (D4) 0.4 (D4) |
Paste | |
0.5![[thin space (1/6-em)]](https://www.rsc.org/images/entities/char_2009.gif) : :![[thin space (1/6-em)]](https://www.rsc.org/images/entities/char_2009.gif) 0.5 (D5) 0.5 (D5) |
Paste | |
0.4![[thin space (1/6-em)]](https://www.rsc.org/images/entities/char_2009.gif) : :![[thin space (1/6-em)]](https://www.rsc.org/images/entities/char_2009.gif) 0.6 (D6) 0.6 (D6) |
Paste | |
0.3![[thin space (1/6-em)]](https://www.rsc.org/images/entities/char_2009.gif) : :![[thin space (1/6-em)]](https://www.rsc.org/images/entities/char_2009.gif) 0.7 (D7) 0.7 (D7) |
Paste | |
0.2![[thin space (1/6-em)]](https://www.rsc.org/images/entities/char_2009.gif) : :![[thin space (1/6-em)]](https://www.rsc.org/images/entities/char_2009.gif) 0.8 (D8) 0.8 (D8) |
Paste | |
0![[thin space (1/6-em)]](https://www.rsc.org/images/entities/char_2009.gif) : :![[thin space (1/6-em)]](https://www.rsc.org/images/entities/char_2009.gif) 1 (Drp) 1 (Drp) |
— | |
CA![[thin space (1/6-em)]](https://www.rsc.org/images/entities/char_2009.gif) : :![[thin space (1/6-em)]](https://www.rsc.org/images/entities/char_2009.gif) Arp Arp |
1![[thin space (1/6-em)]](https://www.rsc.org/images/entities/char_2009.gif) : :![[thin space (1/6-em)]](https://www.rsc.org/images/entities/char_2009.gif) 0 (CA) 0 (CA) |
— |
0.9![[thin space (1/6-em)]](https://www.rsc.org/images/entities/char_2009.gif) : :![[thin space (1/6-em)]](https://www.rsc.org/images/entities/char_2009.gif) 0.1 (A1) 0.1 (A1) |
Liquid | |
0.8![[thin space (1/6-em)]](https://www.rsc.org/images/entities/char_2009.gif) : :![[thin space (1/6-em)]](https://www.rsc.org/images/entities/char_2009.gif) 0.2 (A2) 0.2 (A2) |
Liquid | |
0.7![[thin space (1/6-em)]](https://www.rsc.org/images/entities/char_2009.gif) : :![[thin space (1/6-em)]](https://www.rsc.org/images/entities/char_2009.gif) 0.3 (A3) 0.3 (A3) |
Paste | |
0.6![[thin space (1/6-em)]](https://www.rsc.org/images/entities/char_2009.gif) : :![[thin space (1/6-em)]](https://www.rsc.org/images/entities/char_2009.gif) 0.4 (A4) 0.4 (A4) |
Paste | |
0.5![[thin space (1/6-em)]](https://www.rsc.org/images/entities/char_2009.gif) : :![[thin space (1/6-em)]](https://www.rsc.org/images/entities/char_2009.gif) 0.5 (A5) 0.5 (A5) |
Paste | |
0.3![[thin space (1/6-em)]](https://www.rsc.org/images/entities/char_2009.gif) : :![[thin space (1/6-em)]](https://www.rsc.org/images/entities/char_2009.gif) 0.7 (A7) 0.7 (A7) |
Paste | |
0.2![[thin space (1/6-em)]](https://www.rsc.org/images/entities/char_2009.gif) : :![[thin space (1/6-em)]](https://www.rsc.org/images/entities/char_2009.gif) 0.8 (A8) 0.8 (A8) |
Paste | |
0![[thin space (1/6-em)]](https://www.rsc.org/images/entities/char_2009.gif) : :![[thin space (1/6-em)]](https://www.rsc.org/images/entities/char_2009.gif) 1 (Arp) 1 (Arp) |
— |
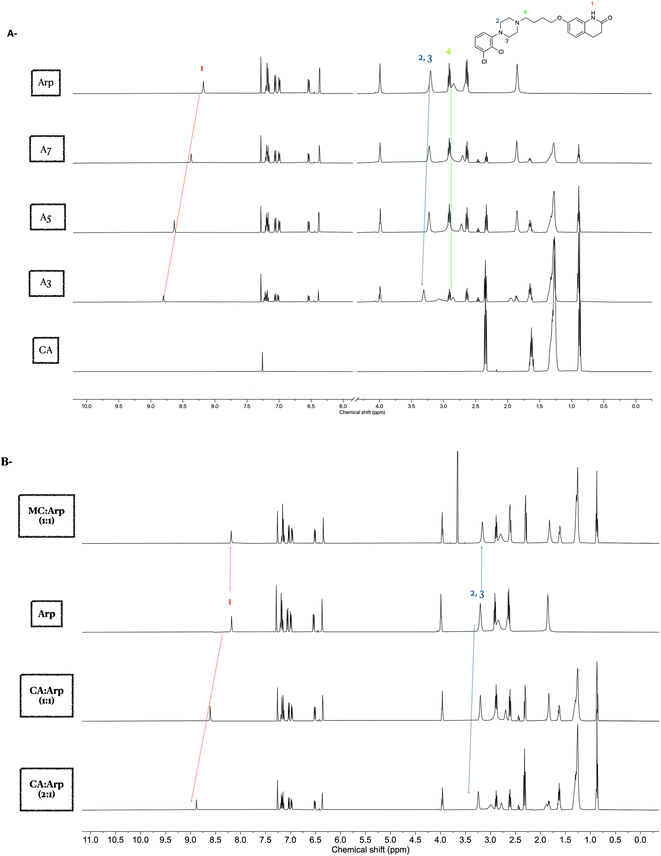
Interestingly, a 1H NMR study of the binary mixtures in CDCl3 revealed the interaction of the amide group with CA, mainly through hydrogen bonding. This was confirmed by the observed significant downfield chemical shift of the amide proton's peak at 8.18 ppm (1).
Similar to the Drp, the role of the piperazine ring in forming eutectic solvents with CA was evaluated. Interactions of the amine groups in the piperazine ring were predicted via the chemical shifts of the adjacent CH2 protons at 3.20 ppm (2,3). A significant downfield shift of these two –CH2 groups (2,3) was evident with increased concentration of CA in the mixture. As the piperazine ring possesses 2 amines, the lack of downfield shift of the (–CH2) protons at 2.91 ppm (4) confirms that the amine next to the aromatic ring of the piperazine is mainly involved in the CA interactions (Fig. 4A). The positive chemical shift deviation (Δδ), as calculated from the protons at 8.18 ppm (1) and 3.20 ppm (2,3) of the Arp with CA, were found to be 0.62 ppm and 0.1 ppm, respectively. The observed downfield shifts imply that these protons are deshielded due to the interactions with the carboxylic acid group of the CA.
Next, validation of the intermolecular interactions using MC, which is not capable of forming acid–base interactions with Arp, was explored. However, MC might be able to form hydrogen bonding with an amide peak at 8.18 ppm. The downfield chemical shifts observed in the Arp and CA eutectic mixture for protons (1–3) were not observed in the case of binary mixtures of MC and Arp (Fig. 4B). This observation demonstrates the essential role of the carboxylic acid protons in mediating the interactions with Arp.
A diffusion experiment confirmed the intermolecular interactions of Arp with CA, as the diffusion spectra of the equimolar eutectic mixture exhibited related diffusion behaviour (Fig. S2 A and B†). On the other hand, the binary mixture of Arp with MC (1![[thin space (1/6-em)]](https://www.rsc.org/images/entities/char_2009.gif) :
:![[thin space (1/6-em)]](https://www.rsc.org/images/entities/char_2009.gif) 1) was similar to the individual components, confirming unrelated diffusion (Fig. S2C†).
1) was similar to the individual components, confirming unrelated diffusion (Fig. S2C†).
2.2 Thermal analysis of the eutectic mixtures
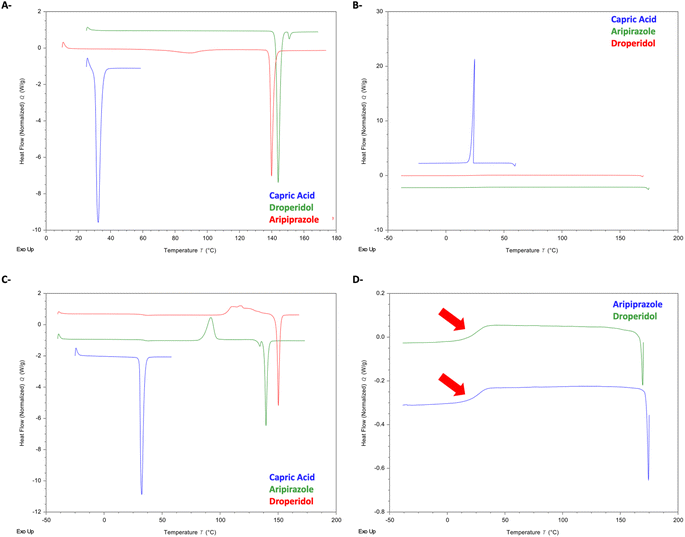 | ||
| Fig. 5 DSC of raw materials. (A) 1st heating cycle. (B) Cooling cycle. (C) 2nd heating cycle. (D) Observed glass transitions of Drp and Arp and Gef. | ||
Fig. 5B shows the DSC thermograms of the cooling cycle of the raw materials. CA was observed to recrystallise completely at 24 °C (162.12 J g−1). Arp and Drp were all observed to vitrify in the cooling cycle, with glass transitions (Tg) being visible at 25.2 °C (Arp) and 23.7 °C (Drp) (Fig. 5D).
In the second heating cycle (Fig. 5C), the melting endotherm of CA was seen at 30.61 °C. Drp and Arp were observed to recrystallise. Drp exhibited a recrystallisation exotherm at 117 °C, and the Tm of Drp was observed again at 148 °C (90.78 J g−1). Arp was observed to recrystallise at 85.3 °C, with the Tm of Arp visible at 138 °C (84.77 J g−1).
Notably, neither of the drugs recrystallised but rather exhibited vitrification during the cooling cycle. The heating/cooling rate employed during the DSC analysis was 10 °C min−1; this indicates that the drugs belong to Glass Forming Ability (GFA) Class II drugs. Drugs belonging to GFA Class I and II are notable for having weaker crystals with a higher tendency to vitrify and a general tendency to yield comparatively more stable amorphous phases than GFA Class III drugs.52
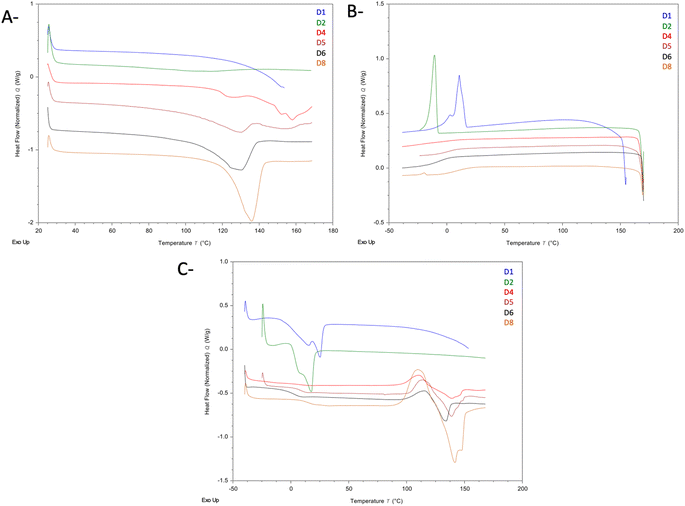 | ||
| Fig. 6 DSC of Drp–CA eutectic mixtures. (A) 1st heating cycle. (B) Cooling cycle. (C) 2nd heating cycle. | ||
In the cooling cycle of samples D4, D5, D6, and D8 (all of which were observed to be heterogenous at room temperature), the recrystallisation of CA was not seen. However, baseline changes that likely correspond to the Tg of Drp were seen in all samples. In contrast to samples D1 and D2, the second heating cycle thermograms for samples D4, D5, D6, and D8 showed the recrystallisation and melting peaks in addition to the Tg of Drp. The recrystallisation peak was seen at 96.7 °C (D4), 102.9 °C (D5), 98.8 °C (D6), and 96.7 °C (D8). The melting endotherms were seen at 117.4 °C (23.40 J g−1) for sample D5, 127.2 °C (34.91 J g−1) for sample D5, 124.7 °C (25.37 J g−1) for sample D6, and 129.0 °C (58.71 J g−1) for sample D8, which most likely corresponds to the depressed melting of Drp. Events corresponding to CA were not observed in the samples, most likely due to the loadings being below the limits of detection of DSC.
Fig. 7 shows the DSC thermograms of the Arp–CA eutectic mixtures A3, A5, and A7. In the first heating cycle (Fig. 7A), the desolvation endotherm of form H1 of Arp was visible in all three thermograms at 58.6 °C, 69.8 °C, and 74.9 °C for samples A3, A5, and A7, respectively. Furthermore, an endothermic event was visible in the thermogram of sample A3 at 18.7 °C (21.96 J g−1), which likely represents the Tm of CA. From the enthalpy values obtained from this endotherm and the Tm of the pure CA sample, we estimate the excess precipitated CA to be approximately 13.5% of the CA content of sample A3. In the cooling cycle (Fig. 7B), no events were observed in the thermogram of sample A3. Meanwhile, the Tg of Arp was clearly visible in the thermograms of samples A5 and A7. In the second heating cycle, no events were observable in the thermogram of sample A3. In the thermograms of samples A5 and A7, the Tg of Arp was again visible. Furthermore, the peritectic melting of form H1 of Arp is again visible in the thermograms of A5 and A7, followed by the phase transformation into the metastable form III polymorph, whose melting is seen at 139 °C.51,53,54
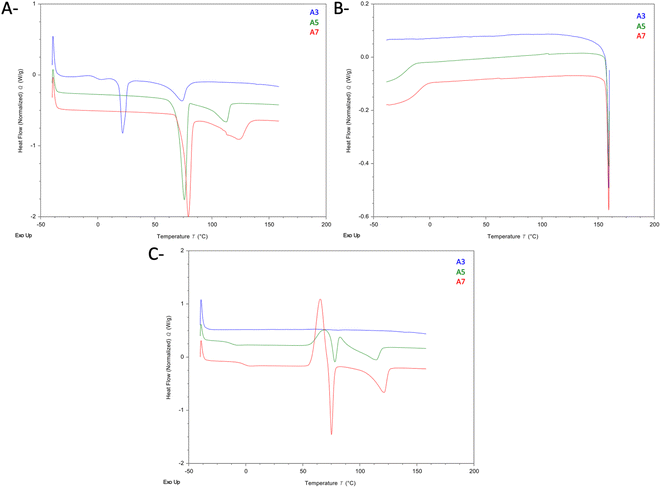 | ||
| Fig. 7 DSC of Arp–CA eutectic mixtures. (A) 1st heating cycle. (B) Cooling cycle. (C) 2nd heating cycle. | ||
In order to validate the hypothesis formulated by the results obtained from both DSC and NMR, a control sample using MC instead of CA was also studied. Drp was used as the model drug for this sample as Drp exhibited the widest concentration range along which a eutectic liquid could be obtained. Fig. S3† shows the DSC results of methyl caprate/Drp sample, along with the thermogram of pure. The Tm of pure methyl caprate was seen at −13 °C (90.25 J g−1). In the thermogram of the mixture (1st heating cycle), both the melting endotherm of methyl caprate and that of Drp were clearly visible at −13 °C (65.84 J g−1) and 140 °C (165.50 J g−1), respectively. In the 2nd heating cycle, the Tm of MC was not visible. However, both the recrystallisation exotherm and Tm of Drp were visible at 46.42 °C and 138.9 °C. The enthalpy of melting of Drp in the second cycle was 100.65 J g−1, corresponding to 61% of the initial amount observed in the first heating cycle, which agrees with the behaviour of pure Drp observed in the thermogram of the pure sample (Fig. 5). The remainder of Drp that was not seen in the thermogram of the second heating cycle is likely converted to the amorphous form of the drug as was seen in the pure sample. The results suggest that there is no interaction between MC and Drp, as the drug melted and recrystallised as independently as a pure sample of the drug was observed to behave, despite the presence of MC in the sample. These findings complement the earlier observations during NMR analyses of the MC–Drp mixture, validating the role of carboxylic acid groups in bringing about interactions necessary to form the DES.
As mentioned earlier, a notable observation was that both Drp and Arp are both GFA Class II drugs,52 as evidence by their failure to recrystallise on cooling at the cooling rate of 10 °C min−1 used throughout the DSC experiments. Similar observations have been previously reported,18,25,55 indicating some correlation between the ability of a drug to form a THEDES and its GFA class. More specifically, since the GFA class is a proxy for crystal strength,52 there seems to be a correlation between the crystal strength of a drug and its ability to form THEDES. The control experiment conducted using MC and Drp suggests that the THEDES formation may be brought about by the hydrogen bonding, as the substitution of the hydrogen bonding forming carboxyl group in CA with the methyl group in MC prevented the formation of a DES. The aforementioned data suggests that the underlying mechanism of DES formation is brought about by the co-former (CA) forming hydrogen bonds with the drug, and due to the weak crystals of the drug (as evidenced by its GFA), the co-former is able to significantly depress its melting,7 resulting in the formation n of a DES.
2.3 Polarised light microscopy of Drp and CA
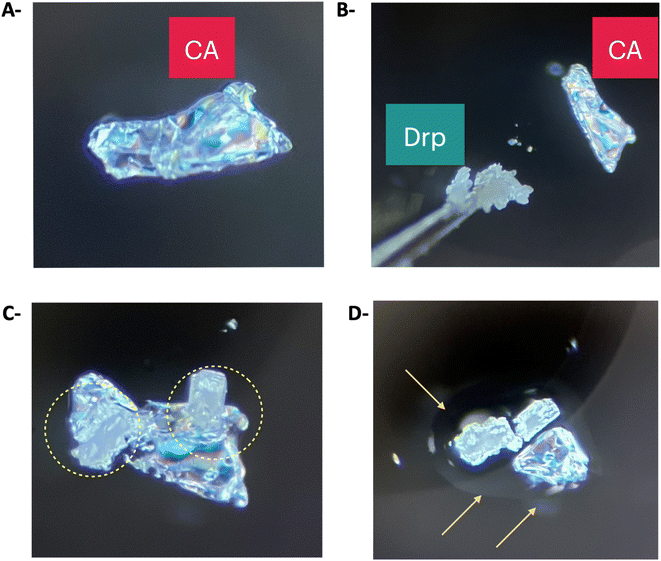
Having established comprehensive structural insights explaining the mechanism of interactions and thermal behaviour within the formed eutectic mixtures between Drp and Arp with CA. Next, we studied the time required to attain deep eutectic solvent upon physical contact between CA and Drp at ambient temperature. When a crystal of Drp was brought into contact with a crystal of CA at ambient temperature (Fig. 8A and B), they began interacting immediately, and the formation of a liquid phase was observed, marked by the circles in Fig. 8C. The morphology of the formed mixture of CA and Drp after 30 minutes differed significantly from the crystal shapes of pure CA and Drp (Fig. 8D). The rapid phase transition from the solid to the liquid state when Drp is brought into contact with CA shows that the formation of the DES is a rapid and spontaneous process. Furthermore, since the crystals formed a DES under ambient conditions without the need for heating and/or agitation, it shows that the reported system is a good candidate to be scaled up for commercial applications in the pharmaceutical industry, therefore achieving higher drug solubilization while maintaining green processing, without the need to incorporate organic solvents.2.4 Everted rat intestinal sac (ERIS)
With the developed THEDESs in our hands, we sought to study the advantages of adopting THEDESs to enhance the permeability and adoption of Drp using ERIS.ERIS is a technique widely employed in pharmaceutical research to study the systemic availability, absorption, permeation, and interactions of drugs. By using this tool, the permeation and absorption of drugs across the intestinal epithelium of rats are studied by measuring their flux.56 DESs generally have better absorption and permeation due to their ability to improve the poor water solubility and low dissolution rate of APIs.57,58
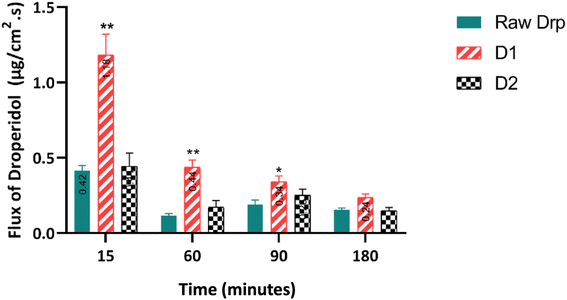
Forming hydrophobic THEDESs with CA would increase the hydrophobic features of the drugs. Nevertheless, the mixture would exhibit improved permeability and absorption. This was clearly demonstrated in the present study (Fig. 9). All the tested samples exhibited time-dependent intestinal flux that gradually decreased over time. Notably, D1 achieved the highest flux of 1.182 mg cm−2 s−1 at 15 minutes, remarkably exceeding the other formulations. While Drp and D2 showed similar profiles, D1 consistently maintained the highest flux throughout the 3 h. This superior permeation profile observed with D1 was statistically confirmed (p-value >0.05). The results demonstrated superior drug absorption when using and maintaining green processing conditions without incorporating organic solvents.
3 Conclusions
In this work, novel DESs comprising CA with two drugs, Drp and Arp, bearing a cyclic tertiary amine moiety, have been investigated. The mechanism of interactions responsible for forming these eutectic mixtures was studied in detail using liquid-state NMR analyses, DSC analysis and polarised light microscopy. 1D NMR results demonstrate the role of tertiary amine in forming eutectic mixtures with CA. In addition, we demonstrated the utility of diffusion NMR experiments in studying the intermolecular interactions in eutectic mixtures. This is the first demonstration of the use of diffusion NMR to study eutectic mixtures of APIs in solution. Thermal analysis of the two drugs revealed that they have a low tendency to recrystallise upon melting but rather vitrify into amorphous solid, which appears to play a major role in DES formation when mixed with CA. Studying the flux of Drp using an everted rat intestinal sac technique has demonstrated the superior permeability and absorption of D1 formulation compared to Drp. Collectively, this work laid the foundation for developing novel eutectic mixtures of APIs with capric acid accompanied by a demonstration of enhanced absorption and permeability.4 Experimental
4.1 Materials and general remarks
Capric acid (CA) and methyl caprate (MC) were purchased from Sigma-Aldrich. Droperidol (Drp) and Aripiprazole (Arp) were kindly provided as gifts from Jordanian Pharmaceutical Manufacturing Company (JPM), Amman, Jordan. All chemicals were used as such without further purification. Full characterisation of the drugs was performed using NMR techniques to demonstrate their purity. Deuterated solvents for NMR were purchased from Cambridge Isotope Laboratories and Sigma-Aldrich.4.2 Preparation of eutectic physical mixtures
Mixtures of Drp–CA and Arp–CA were prepared in approximately 50 mg aliquots at appropriate molar ratios. The mixtures were held shaking in a water bath 40 °C for 24 h until homogenous or/and clear liquid was attained. The details of the prepared binary mixture are shown in Table 3.4.3 NMR experiment
Nuclear magnetic resonance spectra were recorded in deuterated solvents CDCl3 using Bruker Advance III (500 MHz) spectrometers operating at 25 °C with a BBFO+ probe. Drp, Arp, or THEDESs (with equivalent amounts of APIs) samples were prepared by direct dissolving in the deuterated solvent and dissolved completely before submitting. The diffusion data were acquired using the ledbpgp2s pulse sequence, with d1 = 4 s, ns typically 4, 10 diffusion power levels ranging from 2% to 98%, D20 of 0.05 s and D21 of 0.005 s. P30 was 1 ms. The advanced data analysis module of Mestrenova was used to create two-dimensional spectra with NMR chemical shifts (X-axis) and the diffusion coefficients (Y-axis) and to calculate the diffusion coefficients (F).4.4 NMR characterisation of the individual compounds
13C NMR (126 MHz, DMSO-d6) δ 198.98, 166.31, 164.31, 153.37, 134.25, 134.23, 131.36, 131.28, 130.75, 130.33, 128.91, 123.56, 121.68, 121.06, 116.16, 115.99, 109.37, 108.76, 56.89, 51.74, 49.67, 36.16, 27.35, 22.11.
13C NMR (126 MHz, CDCl3) δ 171.62, 158.50, 138.17, 134.10, 128.71, 127.60, 127.54, 125.09, 118.82, 115.88, 108.64, 102.20, 67.64, 57.92, 53.00, 31.10, 27.03, 24.60, 22.63.
13C NMR (126 MHz, DMSO) δ 174.96, 34.12, 31.74, 29.34, 29.22, 29.12, 29.01, 24.96, 22.56, 14.40.
4.5 Polarised light microscope
The polarised light microscopy experiment was performed using an MEIJI TECHNO (EMZ-13TR) polarising optical microscope.4.6 Statistical analysis
To determine the significance between groups, a two-way ANOVA test using GraphPad Prism version 7.01. Values are expressed as mean ± standard error of the mean (SEM). Results were considered significant for p-values ≤0.05.4.7 HPLC analysis
The analysis of Drp using HPLC was conducted as described by Yeniceli et al. (2007).60 Briefly, the detection wavelengths were set at 283 nm. A 4.6 mm × 25 cm separation column packed with 5 μm L1 beads (Supelco, USA) was used as the stationary phase. The mobile phase consisted of methanol–water (30![[thin space (1/6-em)]](https://www.rsc.org/images/entities/char_2009.gif) :
:![[thin space (1/6-em)]](https://www.rsc.org/images/entities/char_2009.gif) 70, v/v) at pH 3.5. The flow rate was set to 0.8 mL min−1, and the injection volume was 5 μL. A calibration curve of Drp was constructed and found to be linear with an R2 of 0.998 over the tested range of concentrations (Fig. S4†). Spiking with Krebs buffer was carried out over the same range of concentrations as the calibration curve to ensure the compatibility of the method for the ERIS experiment.
70, v/v) at pH 3.5. The flow rate was set to 0.8 mL min−1, and the injection volume was 5 μL. A calibration curve of Drp was constructed and found to be linear with an R2 of 0.998 over the tested range of concentrations (Fig. S4†). Spiking with Krebs buffer was carried out over the same range of concentrations as the calibration curve to ensure the compatibility of the method for the ERIS experiment.
Conflicts of interest
There are no conflicts to declare.Acknowledgements
The authors would like to thank the Deanship of Scientific Research at the University of Petra for the financial support of this study. In addition, the author would like to thank Ghayda Al Dabet for her help conducting the Everted rat intestinal sac (ERIS).References
- D. Carriazo, M. C. Serrano, M. C. Gutiérrez, M. L. Ferrer and F. del Monte, Chem. Soc. Rev., 2012, 41, 4996–5014 Search PubMed.
- M. Deetlefs and K. R. Seddon, Green Chem., 2010, 12, 17–30 Search PubMed.
- F. Al-Akayleh, M. Ali, M. Ghareeb and M. Al-Remawi, Drug Delivery Sci. Technol., 2019, 53, 101159 CrossRef CAS.
- V. Renza-Diaz, M. Gonzalez-Hernández, K. D. Pantoja and R. F. D'Vries, CrystEngComm, 2021, 23, 4985–4993 RSC.
- A. P. Abbott, G. Capper, D. L. Davies, R. K. Rasheed and V. Tambyrajah, Chem. Commun., 2003, 70–71 RSC.
- N. Schaeffer, J. H. Conceição, M. A. Martins, M. C. Neves, G. Pérez-Sánchez and J. R. Gomes, Green Chem., 2020, 22(9), 2810–2820 Search PubMed.
- A. Paiva, R. Craveiro, I. Aroso, M. Martins, R. L. Reis and A. R. C. Duarte, ACS Sustain. Chem. Eng., 2014, 2, 1063–1071 CrossRef CAS.
- S. Miao, R. Atkin and G. Warr, Green Chem., 2022, 24, 7281–7304 RSC.
- A. R. C. Duarte, A. S. D. Ferreira, S. Barreiros, E. Cabrita, R. L. Reis and A. Paiva, Eur. J. Pharm. Biopharm., 2017, 114, 296–304 CrossRef CAS PubMed.
- F. Al-Akayleh, M. Al-Remawi, A. Agha and E. Abu-Nameh, Jordan J. Chem., 2023, 18, 53–76 CAS.
- J. A. Kist, H. Zhao, K. R. Mitchell-Koch and G. A. Baker, J. Mater. Chem. B, 2021, 9, 536–566 Search PubMed.
- D. K Luhaibi, H. H. M. Ali, I. Al-Ani, N. Shalan, F. Al-Akayleh, M. Al-Remawi and M. Khanfar, Molecules, 2023, 28(19), 6927 Search PubMed.
- B. Alkhawaja, F. Al-Akayleh, A. Al-Khateeb, J. Nasereddin, B. Ghanim, A. Bolhuis and N. Qinna, Molecules, 2023, 28, 2402 Search PubMed.
- A. Nakaweh, F. Al-Akayleh, M. Al-Remawi, Q. Abdallah and A. Agha, J. Pharm. Innovation, 2024, 19, 1–11 Search PubMed.
- L. Al-Mawla, F. Al-Akayleh, S. Daadoue, W. Mahyoob, B. Al-Tameemi, M. Al-Remawi and A. Agha, J. Pharm. Innovation, 2023, 18, 2196–2209 Search PubMed.
- B. Olivares, F. Martínez, L. Rivas, C. Calderón, J. M. Munita and P. R. Campodonico, Sci. Rep., 2018, 81(8), 1–12 Search PubMed.
- D. Arnodo, C. Meazzo, S. Baldino, M. Blangetti and C. Prandi, Materials, 2023, 29(36), e202300820 Search PubMed.
- F. Al-Akayleh, S. Adwan, M. Khanfer, N. Idkaidek and M. Al-Remawi, AAPS PharmSciTech, 2021, 22, 1–11 Search PubMed.
- J. Lee, D. Jung and K. Park, TrAC, Trends Anal. Chem., 2019, 118, 853–868 CrossRef CAS.
- L. Al-Mawla, F. Al-Akayleh, S. Daadoue, W. Mahyoob, B. Al-Tameemi, M. Al-Remawi, S. Adwan and A. S. A. Agha, J. Pharm. Innovation, 2023, 18(4), 2196–2209 CrossRef.
- F. Al-Akayleh, R. M. Khalid, D. Hawash, E. Al-Kaissi, I. S. I. Al-Adham, N. Al-Muhtaseb, N. Jaber, M. Al-Remawi and P. J. Collier, Lett. Appl. Microbiol., 2022, 75, 607–615 CrossRef CAS PubMed.
- J. M. Silva, C. V. Pereira, F. Mano, E. Silva, V. I. B. Castro, I. Sá-Nogueira, R. L. Reis, A. Paiva, A. A. Matias and A. R. C. Duarte, ACS Appl. Bio Mater., 2019, 2, 4346–4355 CrossRef CAS PubMed.
- R. V. Rariy, A. Fleming, J. C. Hirsh, S. Saim, R. K. Varanasi, WO2022107182A1, 2020.
- K. Bialek, Z. Wojnarowska, M. Skotnicki, B. Twamley, M. Paluch and L. Tajber, Pharmaceutics, 2021, 13, 2125 CrossRef CAS PubMed.
- B. Alkhawaja, F. Al-Akayleh, J. Nasereddin, S. A. Malek, N. Alkhawaja, M. Kamran, Z. Al-Rubaye, M. Smairat, M. Al-Remawi and W. S. Aburayyan, AAPS PharmSciTech, 2023, 24, 1–12 Search PubMed.
- M. H. Zainal-Abidin, M. Hayyan and W. F. Wong, J. Ind. Eng. Chem., 2021, 97, 142–162 Search PubMed.
- S. Kim, J. Chen, T. Cheng, A. Gindulyte, J. He, S. He, Q. Li, B. A. Shoemaker, P. A. Thiessen, B. Yu, L. Zaslavsky, J. Zhang and E. E. Bolton, Nucleic Acids Res., 2021, 49, D1388–D1395 CrossRef CAS PubMed.
- A. Turek, A. Borecka, H. Janeczek, M. Sobota and J. Kasperczyk, Int. J. Pharm., 2018, 548, 159–172 Search PubMed.
- Risperidone: Uses, Interactions, Mechanism of Action, DrugBank, Online Search PubMed.
- S. D. Roy and G. L. Flynn, Pharm. Res., 1989, 6, 147–151 Search PubMed.
- Fentanyl: Uses, Interactions, Mechanism of Action, DrugBank, Online Search PubMed.
- DrugBank, Online, Levofloxacin: Uses, Interactions, Mechanism of Action Search PubMed.
- The National Center for Biotechnology Information (NCBI), Levofloxacin|C18H20FN3O4|CID 149096 – PubChem Search PubMed.
- Droperidol|C22H22FN3O2 – PubChem.
- Droperidol: Uses, Interactions, Mechanism of Action, DrugBank, Online Search PubMed.
- Aripiprazole: Uses, Interactions, Mechanism of Action, DrugBank, Online Search PubMed.
- Decanoic acid|C10H20O2 – PubChem.
- Methyl decanoate|C11H22O2 – PubChem.
- L. K. Foo, S. B. Duffull, L. Calver, J. Schneider and G. K. Isbister, Br. J. Clin. Pharmacol., 2016, 82, 1550 CrossRef CAS PubMed.
- T. Y. Wu, N. Tien, C. L. Lin, Y. C. Cheah, C. Y. Hsu, F. J. Tsai and Y. P. Lim, Front. Biomed., 2023, 10, 1137977 Search PubMed.
- D. Cisewski, B. Long and M. Gottlieb, Am. J. Emerg. Med., 2022, 53, 180–184 CrossRef PubMed.
- H. Saluja, A. Mehanna, R. Panicucci and E. Atef, Molecules, 2016, 21, 719 CrossRef PubMed.
- H. Ali, M. Ghareeb, M. Al-Remawi and F. Al-Akayleh, Trop. J. Pharm. Res., 2020, 19, 361–369 CrossRef CAS.
- H. Wang, J. Cui, H. Li, Y. Zhao and J. Wang, J. Mol. Struct., 2019, 1179, 57–64 CrossRef CAS.
- J. Ho, C. J. Easton and M. L. Coote, J. Am. Chem. Soc., 2010, 132, 5515–5521 Search PubMed.
- T. D. A. Senra, A. Khoukh and J. Desbrières, Carbohydr. Polym., 2017, 156, 182–192 Search PubMed.
- Y. Cohen, L. Avram and L. Frish, Angew. Chem., Int. Ed., 2005, 44, 520–554 Search PubMed.
- S. R. Chaudhari and N. Suryaprakash, J. Mol. Struct., 2012, 1016, 163–168 Search PubMed.
- Y. Cohen, L. Avram and L. Frish, Angew. Chem., Int. Ed., 2005, 44, 520–554 CrossRef CAS PubMed.
- A. Preda and B. B. Shapiro, Expert Opin. Drug Saf., 2020, 19, 1529–1538 Search PubMed.
- D. E. Braun, T. Gelbrich, V. Kahlenberg, R. Tessadri, J. Wieser and U. J. Griesser, Cryst. Growth Des., 2009, 9, 1054–1065 CrossRef CAS.
- P. Panini, M. Rampazzo, A. Singh, F. Vanhoutte and G. Van den Mooter, Pharmaceutics, 2019, 11(10), 529 Search PubMed.
- A. P. Ayala, S. B. Honorato, J. M. Filho, D. Grillo, M. Quintero, F. Gilles and G. Polla, Vib. Spectrosc., 2010, 54, 169–173 CrossRef CAS.
- D. E. Braun, T. Gelbrich, V. Kahlenberg, R. Tessadri, J. Wieser and U. J. Griesser, J. Pharm. Sci., 2009, 98, 2010–2026 Search PubMed.
- S. Daadoue, M. Al-Remawi, L. Al-Mawla, N. Idkaidek, R. M. Khalid and F. Al-Akayleh, J. Mol. Liq., 2022, 345, 117347 Search PubMed.
- M. A. Alam, F. I. Al-Jenoobi and A. M. Al-Mohizea, J. Pharm. Pharmacol., 2012, 64, 326–336 Search PubMed.
- S. Trombino, C. Siciliano, D. Procopio, F. Curcio, A. S. Laganà, M. L. Di Gioia and C. Roberta, Pharmaceutics, 2022, 14, 333 CrossRef CAS PubMed.
- S. Chakraborty, R. Y. Sathe, J. H. Chormale, A. Dangi, P. V. Bharatam and A. K. Bansal, Pharmaceutics, 2023, 15(9), 2351 CrossRef CAS PubMed.
- N. A. Qinna, M. H. Shubbar, K. Z. Matalka, N. Al-Jbour, M. A. Ghattas and A. A. Badwan, J. Pharm. Sci., 2015, 104, 257–265 Search PubMed.
- D. Yeniceli, D. Dogrukol-Ak and M. Tuncel, Chromatographia, 2007, 66, 37–43 CrossRef.
Footnote |
| † Electronic supplementary information (ESI) available. See DOI: https://doi.org/10.1039/d4ra01469c |
| This journal is © The Royal Society of Chemistry 2024 |

