 Open Access Article
Metamagnetism and canted antiferromagnetic ordering in two monomeric CoII complexes with 1-(2-pyrimidyl)piperazine. Hirshfeld surface analysis and theoretical studies†
Anissa Hannachi*a,
Youness El Bakri *b,
Kandasamy Saravananc,
Carlos J. Gómez-García
 d,
Hatem A. Abuelizz
 e,
Rashad Al-Salahi
 e and
Wajda Smirania
aLaboratory of Material Chemistry, Faculty of Sciences of Bizerte, University of Carthage, 7021 Zarzouna, Bizerte, Tunisia. E-mail: hannachianissa@gmail.com
bDepartment of Theoretical and Applied Chemistry, South Ural State University, Lenin Prospect 76, Chelyabinsk, 454080, Russian Federation. E-mail: yns.elbakri@gmail.com
cFaculty of Chemistry, University of Warsaw, Poland
dDepartamento de Química Inorgánica, Universidad de Valencia, C/Dr Moliner 50, 46100 Burjasot, Valencia, Spain
eDepartment of Pharmaceutical Chemistry, College of Pharmacy, King Saud University, Riyadh 11451, Saudi Arabia
First published on 10th April 2024
Abstract
Here we present the magnetic properties of two cobalt complexes formulated as: [Co(SCN)2(L)2] (1) and (H2L)2[Co(SCN)4]·H2O (2) (L = 1-(2-pyrimidyl)piperazine). The two compounds contain isolated tetrahedral CoII complexes with important intermolecular interactions that lead to the presence of a canted antiferromagnetic order below 11.5 and 10.0 K, with coercive fields at 2 K of 38 and 68 mT, respectively. Theoretical calculations have been used to explain this behaviour. Hirshfeld surface analysis shows the presence of strong intermolecular interactions in both compounds. The crystal geometries were used for geometry optimization using the DFT method. From the topological properties, electrostatic potential maps and molecular orbital analysis, information about the noncovalent interaction and chemical reactivity was obtained.
1 Introduction
Magnetic materials constitute a focus of interest of a large number of researchers in recent decades due to their particular applications in molecular sensing, switching, electronic devices and information storage and transfer.1–5 The synthesis of compounds presenting long-range magnetic ordering represents one of the main challenges in this area6 since these compounds require strong interactions between spin carriers in two or three-dimensional spin frameworks.7Structure–function relationship studies of magnetic materials have shown that the self-assembling of transition metals and organic ligands with appropriate donor groups may be a convenient strategy to obtain extended lattices with ferromagnetic coupling and long-range ordering.4,8,9 In contrast, when magnetic materials are formed by discrete molecules, paramagnetic behaviour with weak antiferromagnetic coupling is commonly observed. Only in a few cases, the weak ferromagnetic coupling in these molecule-base materials can give rise to long-range ferromagnetic ordering, although always at very low temperatures.5,8,10 In these few cases, the most common mechanism is the presence of a spin canting in the antiferromagnetic phase, that leads to a weak ferromagnetic ordering with spontaneous magnetization.11,12
It has been theoretically suggested, and experimentally confirmed, that intermolecular interactions may have a key effect on the magnetic properties1,11,13–16 leading to interesting magnetic materials with magnetic interactions by promoting magnetic coupling pathways.17 Thus, intermolecular interactions, such as hydrogen bonding, π–π interactions, van der Waals interactions, sulfur–sulfur interactions and even metallophilic interactions, have a considerable effect on the formation of a magnetic structure.1,13
To design crystals with interesting magnetic properties, the study of the relationship between packing effects and magnetic coupling is of paramount importance.17 Thus, magnetic properties as metamagnetism and canted antiferromagnetism strongly dependent on the crystal packing and intermolecular, interchain or interlayer interactions. These cooperative magnetic properties can be found in some transition metal-based compounds with structures that vary from 0D to 3D. Metamagnetism is due to the presence of a weak antiferromagnetic interaction that can be cancelled by the application of a DC magnetic field, leading to a parallel alignment of the spins that may result in a long range order. This is the case in some transition metals compounds with 0D to 2D structures,18–20 including cobalt(II) compounds.21,22 Spin canting is due to a slightly tilted antiparallel alignment of the spins that leads to a net (although small) magnetic moment in the direction perpendicular to the spin direction.10 The presence of a hysteresis cycle and a very low initial saturation value constitute characteristics features of the spin canting phenomenon. This phenomenon has been observed in compounds with different dimensionalities and metallic centres.23–26
Here we report the magnetic properties of two CoII complexes: [Co(SCN)2(C8H12N4)2] (1) and (C8H14N4)[Co(SCN)4]·H2O (2) (C8H12N4 = 1-(2-pyrimidyl)piperazine and C8H14N42+ = 1-(2-pyrimidyl)piperazinium dication), whose structures have been recently reported by some of us.27 Compound 1 contains neutral CoII monomers formulated as [Co(SCN)2(C8H12N4)2] whereas compound 2 contains anionic [Co(SCN)4]2− tetrahedral complexes that crystallize with (C8H14N4)2+ dications. In both cases there are important intermolecular interactions that give rise to long-range canted antiferromagnetic orderings at low temperatures. These complexes illustrate the important role of intermolecular interactions in the magnetic properties of monomeric complexes.28 We have used quantum chemical calculations coupled with the quantum theory of atoms in molecules (QTAIM) to explain the magnetic properties observed in both complexes.29
2 Material and methods
2.1. Magnetic properties
Magnetic susceptibility measurements were carried out in the temperature range 2–300 K with different applied magnetic fields, on ground polycrystalline samples of compounds 1 and 2 (with masses of 15.752 and 30.380 mg, respectively) with a Quantum Design MPMS-XL-5 SQUID susceptometer. Zero-Field Cooled (ZFC) and field cooled (FC) measurements were performed by cooling the samples with a zero field and then measuring a heating and cooling scan after applying a magnetic field of 10 mT. Isothermal magnetization measurements were performed at 2 K with magnetic fields in the range of −5 to 5 T. AC susceptibility measurements were performed on the same samples, in the temperature range of 2–15 K, with an alternating field of 0.395 mT oscillating in the frequency range 1–997 Hz in the SQUID susceptometer and with an alternating field of 0.8 mT oscillating a frequency of 1 kHz in a Quantum Design PPMS equipment. The susceptibility data were corrected for the sample holder previously measured using the same conditions and for the diamagnetic contributions of the salt as deduced by using Pascal's constant tables.302.2. Computational details
The crystallographic information files (CIF) of both metal complexes were directly used as structural inputs for Hirshfeld surface analysis using Crystal Explorer 21.5 software.31 As we know that the terms de and di denote the Hirshfeld surface distance from the nearest nucleus outside and inside the surface; therefore, the dnorm allows us to visualize the normalized contact distance. Also, the VMoPro program was used to calculate the enrichment contact ratio (E) with the help of the CIF files.32The Cartesian coordinates of both metal complexes obtained from the CIF files were used as an input for geometries for the gas phase calculation using Gaussian 09 software.33 To get the optimized geometries of both metal complexes, the B3LYP hybrid functional with LanL2DZ basis set was used.34 The natural bond orbital (NBO) calculations were performed at the same level of theory to understand the second-order interactions between the filled and vacant orbitals of two different subsystems. The obtained checkpoint and cube files from Gaussian calculation were used to generate ESP and HOMO–LUMO maps. The calculated molecular structure, molecular orbital analysis, electrostatic potential and natural bond orbital analysis were studied with the Gauss view 6.0 (ref. 35) and WinXPRO software packages.36 The optimized geometries of both metal complexes were used to compute the wave function that allows evaluating the noncovalent interactions by the quantum theory of atoms in molecules (QTAIM) analysis.37,38
3 Results and discussion
3.1. Magnetic properties of [Co(SCN)2(C8H12N4)2] (1) and (C8H14N4)[Co(SCN)4]·H2O (2)
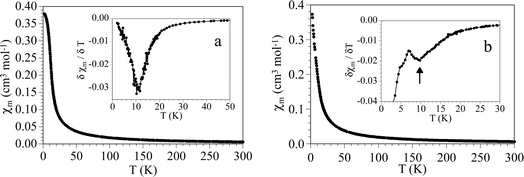
Magnetic measurements performed with an applied magnetic field of 500 mT show similar magnetic behaviours in both compounds. Thus, the χmT product of 1 and 2 at 300 K is ca. 1.9 cm3 K per mol per CoII ion for both compounds, close to the expected value for a tetrahedral isolated CoII ion.39 When the temperature is lowered, χmT remains constant down to around 30 K and shows a progressive increase at lower temperatures to reach a maximum value of ca. 2.8 cm3 K mol−1 at 10 K for 1 and ca. 2.1 cm3 K mol−1 at ca. 12 K for 2 (Fig. 1a and b). Below this temperature χmT sharply decreases to reach ca. 0.75 cm3 K mol−1 for 1 and ca. 1.0 cm3 K mol−1 for 2, at 2 K. This progressive increase at low temperatures suggests the presence of ferromagnetic interactions in both compounds. The magnetic susceptibility (χm, Fig. 2a and b) shows an abrupt increase with a maximum slope at ca. 11 K as can be seen in the thermal variation of the derivative of χm with temperature (inset in Fig. 2a and b). This behaviour suggests the presence of a long-range magnetic ordering below ca. 11 K in 1 and ca. 10 K in 2.40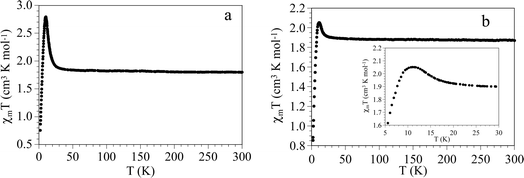 | ||
| Fig. 1 (a) Thermal variation of the χmT product per CoII atom in compound 1. (b) Thermal variation of the χmT product per CoII atom in compound 2. Insets show the low-temperature region. | ||
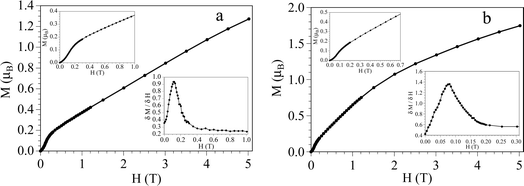
To confirm this possible ordering we have performed hysteresis measurements of the magnetization at 2 K for both compounds. These measurements show two interesting facts. On one hand, the first field sweep of the isothermal magnetization shows a sigmoidal shape with a linear increase at low fields and a change in the slope at ca. 120 mT in 1 and 80 mT in 2 and reaches a very low initial saturation step at a value of ca. 0.2μB at low fields in both compounds (upper insets in Fig. 3). For fields above ca. 200 mT the magnetization shows a linear increase with no saturation and reaches values of ca. 1.3μB in 1 and 1.7μB in 2 at 5 T (Fig. 3). This behaviour indicates that both compounds behave as metamagnets with critical fields of ca. 120 and 80 mT at 2 K in 1 and 2, respectively (i.e., they behave as antiferromagnet/ferromagnets for fields below/above ca. 120 and 80 mT, respectively). The derivative of the magnetization with the magnetic field shows a clear maximum at ca. 120 mT in 1 and 80 mT in 2 (lower insets Fig. 3), confirming the metamagnetic behaviour with critical fields of 120 and 80 mT at 2 K for 1 and 2, respectively.
A further confirmation of the metamagnetic behaviour for both compounds is provided by the magnetic susceptibility measurements at low temperatures with different applied DC fields (Fig. 4). These measurements show the presence of a maximum at low temperatures in the χm vs. temperature plot only for DC fields below 120 mT in 1 and 80 mT in 2. These results further support the metamagnetic behaviour and indicate that both compounds present a (canted) antiferromagnetic order only when the applied DC fields are below the critical ones.
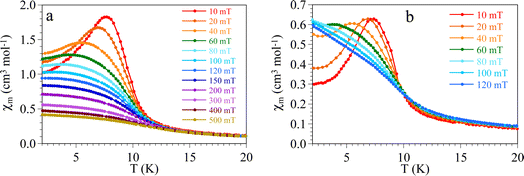 | ||
| Fig. 4 Thermal variation of χm per CoII atom in compounds (a) 1 and (b) 2 with different applied DC fields. | ||
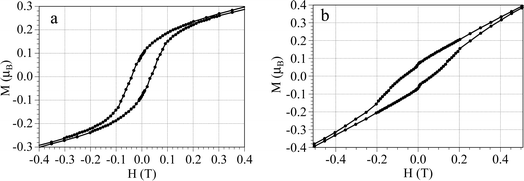
The second important result shown by the magnetization measurements is the presence of a hysteresis cycle with coercive fields at 2 K of ca. 38 mT for 1 and 68 mT for 2 (Fig. 5). These hysteresis cycles and the low initial saturation values (MR ≈ 0.2μB) indicate the presence of a spin canting in the ordered antiferromagnetic phase.40 From this initial MR value and the expected one (MS ≈ 2.15),23 we can estimate a canting angle (γ) from the relation: sin![[thin space (1/6-em)]](https://www.rsc.org/images/entities/char_2009.gif) γ = MR/MS as γ = 5.3° in both compounds.10
γ = MR/MS as γ = 5.3° in both compounds.10
An additional proof of the long range order at low temperatures is provided by the zero field-cooled (ZFC) and field-cooled (FC) magnetic susceptibility of both compounds (Fig. 6) that show a maximum at low temperatures in the ZFC and a divergence between both plots at around 11 K in 1 and 10 K in 2, in agreement with the DC susceptibility data in both compounds (Fig. 2).
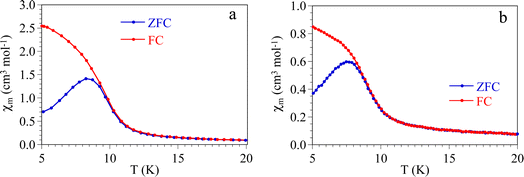 | ||
| Fig. 6 Zero field-cooled (ZFC) and field-cooled (FC) magnetic susceptibility for compounds (a) 1 and (b) 2. | ||
In order to further confirm the presence of this weak antiferromagnetic ordering at low temperatures, we have performed AC susceptibility measurements with different applied DC fields (Fig. 7 and 8). These measurements show a slightly frequency dependent peak in both, the in-phase  and out-of-phase
  AC susceptibilities at ca. 11 K for 1 and ca. 10 K for 2 when no DC field is applied. The ordering temperature, measured as the moment when the
  signal becomes non zero is ca. 11.0 K in 1 and 10.0 K in 2 (Fig. 7), in agreement with the values observed in the DC susceptibility measurements (Fig. 2). Note that the slight dependence of
  and
and  with the frequency can be attributed to the domain wall movement.23
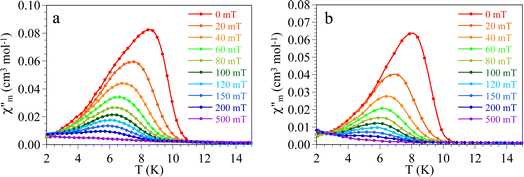 | ||
Fig. 8 Thermal variation of the out-of-phase  AC susceptibilities for compounds (a) 1 and (b) 2 at a frequency of 1000 Hz with different applied DC fields. AC susceptibilities for compounds (a) 1 and (b) 2 at a frequency of 1000 Hz with different applied DC fields. | ||
As expected, when the AC measurements are performed under increasing DC fields, the out of phase signal shifts to lower temperatures and its intensity decreases to disappear for DC fields above the critical field (Fig. 8), further confirming the metamagnetic behaviour of both compounds and their critical fields.
The presence of the canted antiferromagnetic ordering at low temperatures strongly suggests the presence of weak intermolecular interactions in both compounds. To study these interactions, we have performed a detailed Hirshfeld surface analysis.
3.2. Hirshfeld surface analysis
Hirshfeld surface analysis helps to understand the molecular surface in the crystal system by dividing the electron density into molecular pieces. Also, to define the different types of intermolecular contacts in the crystal, crystal Explorer software allows to visualisation di, de, dnorm, shaped index, and curvedness maps in the different colouring methods, and 2D fingerprint plots can be drawn for nearest contacts in the crystal phase. The 3D dnorm surfaces were drawn at a high resolution using a fixed colour scale ranging from −0.1823 (red) to 1.3509 (blue) for molecule I and −0.4004 (red) to 1.3849 (blue) for molecule II. The transparent dnorm and shaped index surfaces allow the visualization of the target metal–organic complexes (Fig. 9), where the red, blue and white colour indicates short (close contacts like H-bonding), long (contacts like van der Waals), and no contacts, respectively. The strong and shiny red and blue surfaces over the sulphur, nitrogen and oxygen atoms correspond to the donor and acceptor character, respectively. The detailed intermolecular interactions obtained from the crystal structure of both complexes have been used to investigate the contribution of non-covalent interactions. The strong red spots on the sulphur atom on the dnorm map are due to the S⋯H–N and S⋯H–O interactions; whereas, other light red spots are due to weaker interactions (N⋯H–C and S⋯N).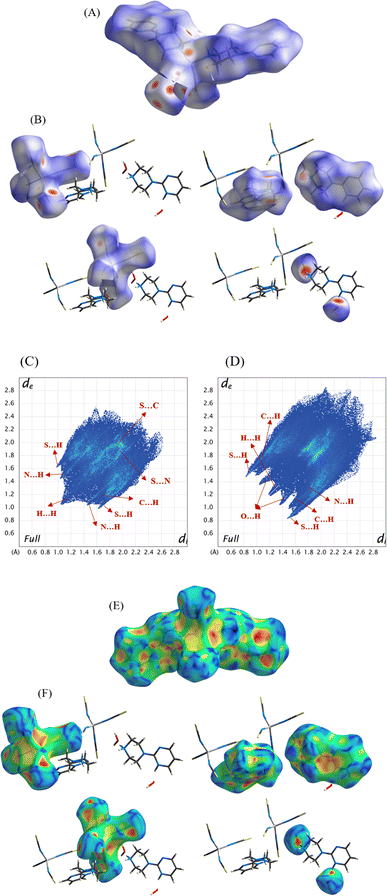 | ||
| Fig. 9 Hirshfeld surface analysis of Co-metal complexes, (A (1), B (2)) shows the dnorm surface map and (C and D) shows their fingerprint plots, and (E and F) shows the shape-index of both complexes. | ||
Similarly, the presence of red, yellow, and blue surfaces over all the atoms in the molecules on the shaped index corresponds to the π–π stacking. Here, both blue and red triangles are close to each other, which confirms the π–π interactions in both metal complexes.
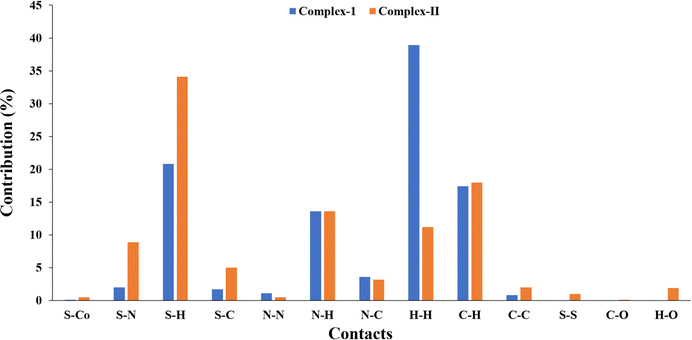
The calculated 2D fingerprint plots help to study the intermolecular interactions involved within the structures; in which, the decomposed fingerprint plots (Fig. S1†) allow us to understand the contribution of one interaction from different contact types. In compounds 1 and 2, the highest contributions correspond to the S⋯H, N⋯H, C⋯H, and H⋯H interactions, with values of 20.8/34.1, 13.6/13.6, 17.4/18.0 and 38.9/11.2% for 1 and 2, respectively (Fig. 10).
The S⋯Co contact is much weaker in both compounds (only 0.1 in 1 and 0.5% in 2) due to the coordination with the nitrogen atom. Furthermore, since the C⋯H and N⋯H contacts are very similar in both complexes, it can be assumed that they are due to C–H⋯π stacking and N⋯C–H interactions. The large differences observed in the S⋯N, S⋯H and H⋯H interactions are due to the presence of coordinated thiocyanate groups in both compounds. Additionally, the enrichment contact ratio was calculated to find the interactions in the unit cell. Table S1† shows the enrichment contact ratio for both compounds. The S⋯H contact in 1 is greater than in 2. The C–H⋯O contacts in 2 are due to the water molecules. The enrichment contacts ratio of Co![[thin space (1/6-em)]](https://www.rsc.org/images/entities/char_2009.gif) :
:![[thin space (1/6-em)]](https://www.rsc.org/images/entities/char_2009.gif) S is found to be higher than 1. Here, an enrichment ratio (EAB) greater than 1 indicates that the pair of involved atoms exhibit a high tendency to form interactions in the crystal phase whereas the enrichment ratio EAB < 1 indicates a low tendency. The exact nature of the crystal packing is predicated on minute chemical and structural alterations to the molecules, and the appearance of the intermolecular interaction is associated with the 3D arrangement of the clusters in the crystal phase. Therefore, the magnetic characteristics of the compounds are ultimately controlled by microscopic chemical modifications.
S is found to be higher than 1. Here, an enrichment ratio (EAB) greater than 1 indicates that the pair of involved atoms exhibit a high tendency to form interactions in the crystal phase whereas the enrichment ratio EAB < 1 indicates a low tendency. The exact nature of the crystal packing is predicated on minute chemical and structural alterations to the molecules, and the appearance of the intermolecular interaction is associated with the 3D arrangement of the clusters in the crystal phase. Therefore, the magnetic characteristics of the compounds are ultimately controlled by microscopic chemical modifications.
3.3. Electrostatic potential map
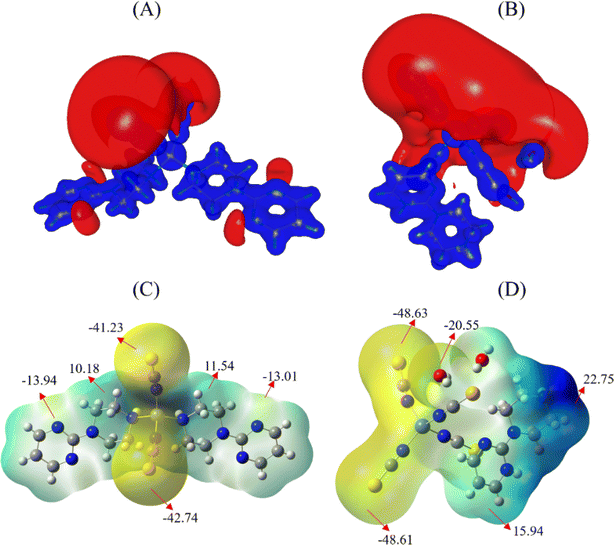
To get detailed information about the electrostatic potential by charge distribution around the molecule, a molecular electrostatic potential map (MESP) was drawn. The reactivity of the chemical system can be studied from the nucleophilic and electrophilic characteristics. Also, the electrostatic fields of the chemical system allow insight into the structure and function, biological recognition, and noncovalent interactions in and around the macromolecular system. The blue region represents the most positive and the red one denotes the electronegative electrostatic potential in the chemical system. In our target metal complexes, the blue colour is present on all the atoms indicative of nucleophilic region (Fig. 11). This positive area of the hydrogen atom favours nucleophilic attack due to electron deficiency.The vicinity of the small electronegative region around the nitrogen atoms in compound 1 favours the electrophilic contact with the nearest molecule in the unit cell. A large electronegative region is observed around the sulphur atoms in both molecules. The oxygen atom of a water molecule in compound 2 also carries a high electronegative surface due to the strong S⋯H–O type of interaction. The highest electronegative surface in both metal complexes confirms the strong interactions in the crystal phase. Furthermore, we have computed the electrostatic potential energy (in kcal mol−1) for the metal complexes. These calculations show that the thiocyanate group carries the highest electronegative potential energy in both complexes. In compound 1, the Co atom is coordinated by two thiocyanate groups and two 1-(2-pyrimidyl)piperazine rings, with both organic rings and thiocyanate groups exhibiting almost similar electronegative energy values. In contrast, the organic ring in compound 2 carries a high positive energy value.
3.4. Molecular orbital analysis
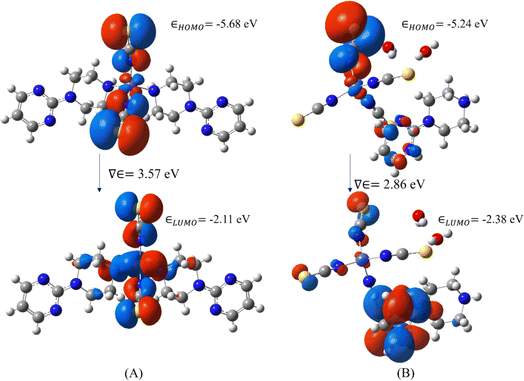
To characterize the electron-donating and withdrawing ability of the target system, molecular orbital analysis has been performed, i.e., the HOMO (Highest Orbital Molecular Orbital) and LUMO (Lowest Unoccupied Molecular Orbital) play a vital role in the electrical, optical, chemical and biological properties.41–46 The molecular orbital analysis of both metal complexes was obtained from their optimized geometries which are shown in Fig. 12. The HOMO is highly located on the thiocyanate groups in both complexes and slightly extends to the metal atoms. The LUMO is spread over the carbon atom in 1 and over the 1-(2-pyrimidyl)piperazine ring in 2. The energies of the molecular orbitals, band gaps and other global reactivity descriptors are listed in Table 1. The energy gap between HOMO and LUMO allows the prediction of the kinetic stability and reactivity of the compound.41–46 The molecule with a smaller energy gap can be considered as a soft molecule whereas a higher energy gap leads to a hard molecule. In our case, complex 2 is found to be a softer molecule than complex 1. This may be due to the crystallization of water molecule in 2 that forms strong hydrogen bonds in the crystal packing. Furthermore, the electrophilicity index is also another important quantum chemical descriptor in terms of molecular reactivity. All the quantum chemical descriptors can be calculated using Koopman's theorem. Moreover, the calculated ionization potential, electron affinity and electronegativity of both complexes show that the electronegativity and electron affinity are lower than the ionization potential. From the molecular orbital analysis, both Co-metal complexes are almost similar and they may act as intra-ligand charge transfer metal complexes.27,47,48| Global reactivity descriptors | DFT energy (eV) | |
|---|---|---|
| Complex-1 | Complex-2 | |
| Band gap | 3.57 | 2.86 |
| HOMO energy | −5.68 | −5.24 |
| LUMO energy | −2.11 | −2.38 |
| Ionization potential (I = −EHOMO) | 5.68 | 5.24 |
| Electron affinity (A = −ELUMO) | 2.11 | 2.38 |
| Global hardness (η = (I − A)/2) | 1.78 | 1.43 |
| Electronegativity (χ = (I + A)/2) | 3.89 | 3.81 |
| Electrophilicity (ω = μ2/2η, μ = −χ) | 4.25 | 5.08 |
3.5. Quantum theory of atoms in molecules (QTAIM) analysis
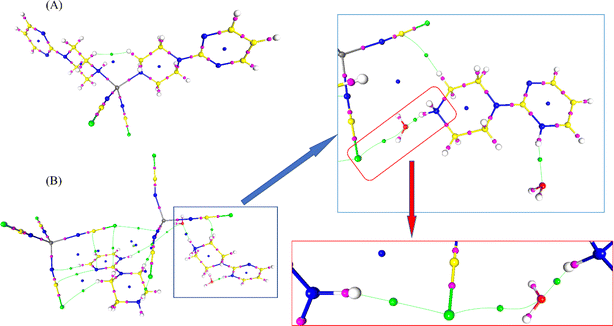
Modern computational methods allow the prediction of many chemical and biological properties without the need to use experimental methods. The QTAIM analysis is also one of the major methods that characterize the contribution of interactions, not only hydrogen bonding but also revealing noncovalent interactions in real space. Therefore, in the present study, the data of the two Co-metal complexes obtained from X-ray diffraction were studied by QTAIM analysis to get insight into the electronic level. This analysis examines the electron density ρ(r) in the bond critical point (bcp), Laplacian of electron density (second derivative of electron density, ∇2ρ(r)), ellipticity and energy densities (Vr, Gr, Hr). All these values are shown in Table S2.† A (3, −1)-type critical point can be observed between two interacting atoms, resulting in the existence of hydrogen bonding and other noncovalent interactions in both metal complexes. The critical point map (Fig. 13) shows the bond critical points (in magenta), ring critical points (in blue) and critical points between noncovalent interactions (in green) in both metal complexes.In complex 1, the cobalt atom coordinates with two nitrogen atoms of the thiocyanate group and two nitrogen atoms of the 1-(2-pyrimidyl)piperazine ring. There are no strong hydrogen bonding interactions; however, the small electron density and positive Laplacian of electron density between Co and nitrogen atoms confirmed the strong coordination bonds. The average ρ(r) and ∇2ρ(r) of the Co–N bond in complex 1 are 0.537 eÅ−3 and 8.572 eÅ−5; whereas, the same for the bond in complex 2 are 0.575 eÅ−3 and 9.375 eÅ−5, respectively. In complex 2, the (3, −1)-type critical point search shows the bcp between S⋯N, S⋯C, S⋯O, C–H⋯S, N–H⋯O and N–H⋯S interactions. Among them, the N–H⋯S interaction seems to be stronger than the other interactions in the metal complex. The ρ(r) and ∇2ρ(r) of the N1–H1A⋯S2A and N12–H12⋯S3A interactions are 0.144/0.174 eÅ−3 and 1.149/1.354 eÅ−5 in 1 and 2, respectively. Notably, the bridging interaction is characterized by the presence of several critical bonds connecting the thiocyanate group and water molecules and 1-(2-pyrimidyl)piperazine rings observed in complex 2 with the order: (ligand)N–H⋯S(thiocyanate)⋯O(water)⋯H–N(ligand). This confirms the strength of the two complexes (two thiocyanate groups, two water molecules, and two pyrimidylpiperazine rings) in the asymmetric unit (Fig. 14). The presence of a critical point implies interaction and a positive sign of the Laplacian confirms the closed-shell nature of the interaction.
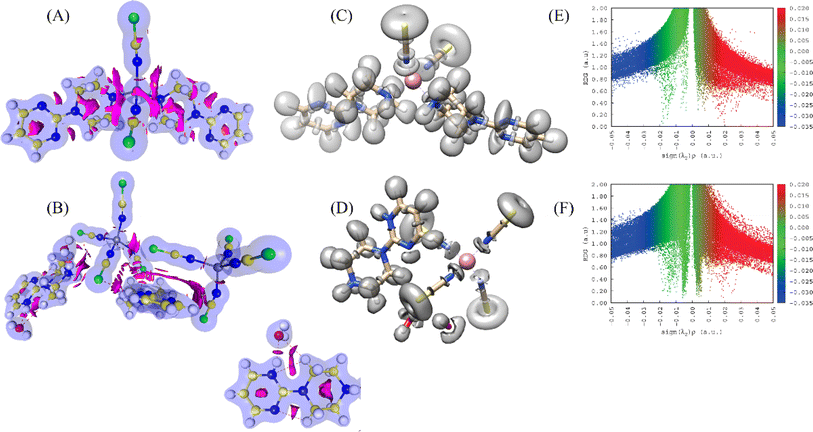 | ||
| Fig. 14 (A and B) The NCI iso-surface map, (C and D) ELF surface, and (E and F) RDG plot of both complexes. | ||
All the interactions are further characterized by NCI-RDG (noncovalent interaction – reduced density gradient) plots to corroborate the existence of different types of interactions.47,48 The NCI isosurface map of both complexes shows the strength of the interactions. Here, the size and mode of the surface between two interacting atoms reveal their stability (Fig. 14a and b). The pink colour surface between two atoms/two molecules in the NCI isosurface map confirms the existence of the interaction. In particular, the “L” shaped NCI isosurface observed between the thiocyanate group and the 1-(2-pyrimidyl)piperazine ring in complex 2, suggests the presence of stacking interactions. On the other hand, the triangle-shaped intra- and intermolecular interactions observed between the 1-(2-pyrimidyl)piperazine ring and the water molecule in complex 2, indicate the presence of a strong hydrogen bonding. The RDG plot was drawn in opposition to the electron density sign (λ2)ρ. The repulsive and attractive interactions can be identified from sign (λ2)ρ > 0 and sign (λ2)ρ > 0, respectively in the coloured RDG plot (Fig. 14e and f). The strong interactions are shown in blue, weak van der Waals interactions are displayed in green and the strong repulsion forces are in red. Furthermore, the ELF analysis of both metal complexes shows the localization region in the structures revealing a more detailed insight into the bonding situation (Fig. 14c and d). In general, the ELF surface in-plane is called σ-bond and the out-of-plane is π-bond contribution. The electron delocalization with π-bond contribution can be confirmed from the pyrimidylpiperazine ring. The arrangement of ELF electron-pairing basins in both complexes is very similar. Thus, the ELF basins are observed in between the Co-metal and the nitrogen atoms of the ligands, confirming the coordination bond. The ELF surface around the sulphur atom in the thiocyanate groups of both complexes shows the σ-hole nature.
We have also computed the electrostatic interaction energy (using Buckingham approximation) and the total interaction energy (using the kernel energy method) for both complexes after separating the binary complex (shown in Fig. 15). Here, the electrostatic interaction energy of complex 1 shows the same values with both sides of the 1-(2-pyrimidyl)piperazine ring as well as with the thiocyanate groups. This higher electrostatic interaction energy confirms the strong bonds. Whereas in complex 2, the 1-(2-pyrimidyl)piperazine ring and the thiocyanate groups are formed by noncovalent interactions, and also asymmetric unit contains two complexes. Therefore, we decided to compute the electrostatic interaction energy and kernel-based interaction energy, the average EIE and Ekernel values of 1-(2-pyrimidyl)piperazine ring-thiocyanate groups are −13.91 and −19.99 kcal mol−1, respectively. The interaction energy between two thiocyanate groups is −6.49 and −10.74 kcal mol−1, and the EIE and Ekernel values for 1-(2-pyrimidyl)piperazine ring with water molecule are −22.27 and −17.35 kcal mol−1, respectively. Both interaction energies are deemed to be at higher values, which indicates the strength of noncovalent interactions and leads to the stabilization of the molecular assembly in the solid-state phase.
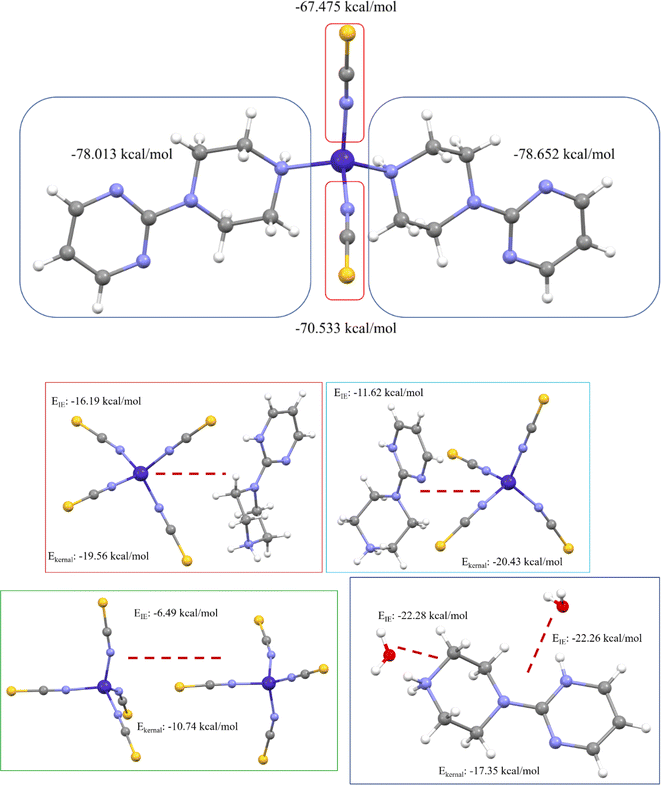 | ||
| Fig. 15 Electrostatic interaction energy and kernel-based interaction energy of both metal complexes. | ||
3.6. Natural bond orbital (NBO) analysis
The quantum chemical calculation has been used as a powerful method to characterize the NBO of target compounds. NBO is also one of the potential techniques to examine the intra-, intermolecular, metal bonding and charge transfer in the chemical system. In general, NBO analysis allows us to consider all possible interactions between occupied and unoccupied orbitals, it leads to estimating their energy by second-order perturbation theory. The stabilization energy can be determined using the following eqn (1):
 | (1) |
Therefore, in this present work, both complexes were subjected to NBO analysis by B3LYP/6-311G** and LanL2DZ level of the DFT method (Table 2). The obtained stabilization energy for bonds between nitrogen and cobalt atoms is higher. Also, the stabilization energy of all four Co–N bonds is not similar. In particular, the Co1–N13(SCN) bond has a much higher stabilization energy than the other three Co–N bonds in compound 1: one Co–N(SCN) and two Co–N(L) bonds. This kind of variation is not observed in compound 2, where all the Co–N bonds are similar (Table 3). This higher stabilization energy of hyper conjugative interaction confirms their elongation of metal bonds. Furthermore, the sulphur atom of the thiocyanate group forms strong interactions with water molecules in the complex, this can be confirmed by the stabilization energy of the LP → BD* type interaction, which shows a high stabilization energy between S3 and O–H groups.49–51 This NBO result of a particular bond (Co–N) is reinforced with QTAIM analysis. Although, the higher stabilization energy was noticed from ligand to metal due to the charge transfer mechanism of metal–organic complexes.
| Complex-1 | Complex-2 | Urea/KDP | |
|---|---|---|---|
| μx | 4.9506 | 29.9513 | |
| μy | −8.0694 | −33.8061 | |
| μz | −11.846 | 10.0197 | |
| μtotal | 15.1641 | 46.264 | 1.3197/6.03 |
| αxx | 9.684 × 10⁻²⁴ | 9.678 × 10⁻²⁴ | |
| αxy | −6.834 × 10⁻²⁵ | −5.385 × 10⁻²⁴ | |
| αyy | 9.736 × 10⁻²⁴ | 1.081 × 10⁻²³ | |
| αxz | 8.811 × 10⁻²⁵ | 2.376 × 10⁻²⁴ | |
| αzz | 6.936 × 10⁻²⁴ | 1.489 × 10⁻²³ | |
| αyz | 1.276 × 10⁻²⁴ | −1.408 × 10⁻²⁴ | |
| αtotal | 8.785 × 10⁻²⁴ | 1.179 × 10⁻²³ | |
| Δα | 2.774 × 10⁻²⁴ | 4.752 × 10⁻²⁴ | |
| βxxx | −4.747 × 10⁻³⁰ | 4.677 × 10⁻³¹ | |
| βxxy | 1.825 × 10⁻³¹ | −4.989 × 10⁻³¹ | |
| βxyy | −2.082 × 10⁻³² | 6.238 × 10⁻³¹ | |
| βyyy | −1.404 × 10⁻³¹ | −6.064 × 10⁻³¹ | |
| βxxz | −8.876 × 10⁻³¹ | 3.650 × 10⁻³¹ | |
| βxyz | −8.991 × 10⁻³¹ | −6.077 × 10⁻³² | |
| βyyz | 7.898 × 10⁻³¹ | −9.210 × 10⁻³² | |
| βxzz | −1.560 × 10⁻³¹ | 2.247 × 10⁻³⁰ | |
| βyzz | −8.172 × 10⁻³² | −2.463 × 10⁻³⁰ | |
| βzzz | 4.012 × 10⁻³¹ | −3.438 × 10⁻³⁰ | |
| βtotal | 4.935 × 10⁻³⁰ | 5.822 × 10⁻³⁰ | 0.1947/0.732 × 10−30 |
| Donor–acceptor | E(2) (kcal mol−1) |
|---|---|
| Complex-1 | |
| LP(1) N13–LP*(5) Co1 | 40.17 |
| LP(1) N15–LP*(5) Co1 | 18.80 |
| LP(1) N1–LP*(6) Co1 | 20.19 |
| LP(1) N1A–LP*(6) Co1 | 17.56 |
![[thin space (1/6-em)]](https://www.rsc.org/images/entities/char_2009.gif) |
|
| Complex-2 | |
| LP(1) N13A–LP*(7) Co1A | 25.25 |
| LP(1) N15A–LP*(5) Co1A | 23.64 |
| LP(1) N17A–LP*(5) Co1A | 22.87 |
| LP(1) N19A–LP*(8) Co1A | 26.20 |
| LP(2) S3–BD*(1) O1–H2O | 2.21 |
| LP(3) S3–BD*(1) O2–H2O | 2.17 |
4 Conclusion
In conclusion, we have found that the cobalt(II)-containing compounds 1 and 2, based on 1-(2-pyrimidyl)piperazine, present a metamagnetic behaviour with critical fields of ca. 120 and 80 mT, in 1 and 2, respectively, and a canted antiferromagnetic ordering below ca. 11 K and 10 K for 1 and 2, respectively in the antiferromagnetic region, below the corresponding critical fields. This behaviour is due to the presence of moderate intermolecular interactions. The Hirshfeld surface and void analysis of both compounds show the presence of intermolecular interactions as π–π interactions, as also observed in other related complexes.52,53 The study of the electrostatic potential by charge distribution around the molecules shows an important electronegative surface in both metal complexes, further confirming the presence of interactions in the crystal phase. The molecular orbital analysis reveals that the HOMO is highly located in the thiocyanate groups and that both cobalt complexes are almost similar, as confirmed by the magnetic measurements.Conflicts of interest
There are no conflicts to declare.Acknowledgements
The authors extend their appreciation to the Researchers Supporting Project, King Saud University, Riyadh, Saudi Arabia, for funding this work through grant No. RSP2024R353. This study forms part of the Advanced Materials program and was supported by the Spanish MCIN with funding from European Union NextGeneration EU (PRTR-C17.I1) and the Generalitat Valenciana (project MFA-2022-057). We also thank the Grant PID2021-125907NB-I00 funded by MCIN/AEI/10.13039/501100011033 and by “ERDF A way of making Europe” and project CIPROM-2022-060 from the Generalitat Valenciana, for financial support.References
- J. Tao, R.-J. Wei, R.-B. Huang and L.-S. Zheng, Chem. Soc. Rev., 2012, 41, 703–737 RSC.
- S. Luo, X. Sun, B. Zeng and P. Zheng, Polyhedron, 2021, 194, 114955 CrossRef CAS.
- V. Laget, C. Hornick, P. Rabu, M. Drillon and R. Ziessel, Coord. Chem. Rev., 1998, 178, 1533–1553 CrossRef.
- C. Bellitto, G. Righini, C. J. Gómez-García, R. Caminiti, M. Carbone, R. Matassa and E. M. Bauer, Inorg. Chem., 2012, 51, 7332–7339 CrossRef CAS PubMed.
- R. Lebrun, A. Ross, S. Bender, A. Qaiumzadeh, L. Baldrati, J. Cramer, A. Brataas, R. Duine and M. Kläui, Nature, 2018, 561, 222–225 CrossRef CAS.
- J. M. D. Coey, J. Alloys Compd., 2001, 326, 2–6 CrossRef CAS.
- C. Boskovic, R. Bircher, P. L. Tregenna-Piggott, H. U. Güdel, C. Paulsen, W. Wernsdorfer, A.-L. Barra, E. Khatsko, A. Neels and H. Stoeckli-Evans, J. Am. Chem. Soc., 2003, 125, 14046–14058 CrossRef CAS.
- C. Gandolfi, G. G. Morgan and M. Albrecht, Dalton Trans., 2012, 41, 3726–3730 RSC.
- S. Naiya, S. Biswas, M. G. Drew, C. J. Gomez-Garcia and A. Ghosh, Inorg. Chem., 2012, 51, 5332–5341 CrossRef CAS PubMed.
- D.-F. Weng, Z.-M. Wang and S. Gao, Chem. Soc. Rev., 2011, 40, 3157–3181 RSC.
- C. Song, Y. You, X. Chen, X. Zhou, Y. Wang and F. Pan, Nanotechnology, 2018, 29, 112001 CrossRef.
- F.-P. Huang, J.-L. Tian, D.-D. Li, G.-J. Chen, W. Gu, S.-P. Yan, X. Liu, D.-Z. Liao and P. Cheng, Inorg. Chem., 2010, 49, 2525–2529 CrossRef CAS PubMed.
- S. Hayami, M. R. Karim and Y. H. Lee, Eur. J. Inorg. Chem., 2013, 2013, 683–696 CrossRef CAS.
- W. Phonsri, P. Harding, K. S. Murray, B. Moubaraki and D. J. Harding, New J. Chem., 2017, 41, 13747–13753 RSC.
- J. A. Real, A. B. Gaspar, V. Niel and M. C. Muñoz, Coord. Chem. Rev., 2003, 236, 121–141 CrossRef CAS.
- S. Giri and S. K. Saha, J. Phys. Chem. Lett., 2011, 2, 1567–1571 CrossRef CAS.
- S. Eusterwiemann, C. Doerenkamp, T. Dresselhaus, O. Janka, C. G. Daniliuc, R. Pöttgen, A. Studer, H. Eckert and J. Neugebauer, Phys. Chem. Chem. Phys., 2018, 20, 22902–22908 RSC.
- S. Goswami, S. Singha, I. Saha, A. Chatterjee, S. K. Dey, C. J. Gomez Garcia, A. Frontera, S. Kumar and R. Saha, Inorg. Chem., 2020, 59, 8487–8497 CrossRef CAS PubMed.
- P. Ghorai, A. Dey, P. Brandão, S. Benmansour, C. J. Gómez García, P. P. Ray and A. Saha, Inorg. Chem., 2020, 59, 8749–8761 CrossRef CAS PubMed.
- N. Maldonado, J. Perles, J. I. Martínez, C. J. Gomez-Garcia, M.-L. Marcos and P. Amo-Ochoa, Cryst. Growth Des., 2020, 20, 5097–5107 CrossRef CAS.
- Z. Setifi, F. Setifi, S. Benmansour, X. Liu, J. T. Mague, C. J. Gómez-García, P. Konieczny and J. Reedijk, Dalton Trans., 2022, 51, 5617–5623 RSC.
- J. Werner, Z. Tomkowicz, M. Rams, S. G. Ebbinghaus, T. Neumann and C. Näther, Dalton Trans., 2015, 44, 14149–14158 RSC.
- T. Liu, S.-M. Gao, L.-Y. Xu, J.-P. Zhao, F.-C. Liu, H.-L. Hu and Z.-H. Kang, Inorg. Chem., 2014, 53, 13042–13048 CrossRef CAS.
- Z.-Y. Li, X.-J. Li, X. Gao, F.-L. Zhang, C. Zhang and B. Zhai, Cryst. Growth Des., 2020, 20, 1103–1109 CrossRef CAS.
- S. K. Dubey, M. Patra, K. Gupta, S. Bhattacharjee, R. Saha and C. J. Gómez-García, Magnetochemistry, 2023, 9, 55 CrossRef CAS.
- I. Bhowmick, E. A. Hillard, P. Dechambenoit, C. Coulon, T. D. Harris and R. Clerac, Chem. Commun., 2012, 48, 9717–9719 RSC.
- A. Hannachi, A. Valkonen, M. Rzaigui and W. Smirani, Polyhedron, 2019, 161, 222–230 CrossRef CAS.
- B. Čobeljić, I. Turel, A. Pevec, Z. Jagličić, D. Radanović, K. Anđelković and M. R. Milenković, Polyhedron, 2018, 155, 425–432 CrossRef.
- M. Y. Volkov, E. Frolova, L. Mingalieva, L. Gafiyatullin, O. Turanova, E. Milordova, I. Ovchinnikov and A. Turanov, Polyhedron, 2018, 154, 407–410 CrossRef CAS.
- G. A. Bain and J. F. Berry, J. Chem. Educ., 2008, 85, 532 CrossRef CAS.
- S. Wolff, D. Grimwood, J. McKinnon, M. Turner, D. Jayatilaka and M. Spackman, CrystalExplorer, version 3.1, University of Western Australia, Crawley, Australia, 2012 Search PubMed.
- C. Jelsch, K. Ejsmont and L. Huder, IUCrJ, 2014, 1, 119–128 CrossRef CAS PubMed.
- M. J. Frisch, G. W. Trucks, H. B. Schlegel, G. E. Scuseria, M. A. Robb, J. R. Cheeseman, G. Scalmani, V. Barone, G. A. Petersson and H. Nakatsuji, Gaussian 16, Gaussian, Inc., Wallingford, CT, 2016 Search PubMed.
- E. R. Davidson and D. Feller, Chem. Rev., 1986, 86, 681–696 CrossRef CAS.
- R. Dennington, T. A. Keith and J. M. Millam, GaussView 6.0.16, Semichem Inc, Shawnee Mission, KS, USA, 2016 Search PubMed.
- A. I. Stash and V. G. Tsirelson, J. Appl. Crystallogr., 2014, 47, 2086–2089 CrossRef CAS.
- R. F. Bader and T. Nguyen-Dang, in Advances in Quantum Chemistry, Elsevier, 1981, vol. 14, pp. 63–124 Search PubMed.
- R. Bader, Atoms in Molecules: A Quantum Theory (International Series of Monographs on Chemistry), Clarendon Press, Oxford, UK, 1994 Search PubMed.
- S. Vaidya, A. Upadhyay, S. K. Singh, T. Gupta, S. Tewary, S. K. Langley, J. P. Walsh, K. S. Murray, G. Rajaraman and M. Shanmugam, Chem. Commun., 2015, 51, 3739–3742 RSC.
- S. Gouasmia and K. Bendib, Optimisation par variation des différentes grandeurs physiques sur un matériau magnétique (application sur le fer), PhD thesis, 2018.
- K. Fukui, Science, 1982, 218, 747–754 CrossRef CAS PubMed.
- P. Geerlings, F. De Proft and W. Langenaeker, Chem. Rev., 2003, 103, 1793–1874 CrossRef CAS PubMed.
- J. K. Labanowski and J. W. Andzelm, Density Functional Methods in Chemistry, Springer Science & Business Media, 2012 Search PubMed.
- R. G. Parr and R. G. Pearson, J. Am. Chem. Soc., 1983, 105, 7512–7516 CrossRef CAS.
- R. Parr, L. Szentpaly and S. Liu, J. Am. Chem. Soc., 1999, 121, 1922 CrossRef CAS.
- R. G. Parr and W. Yang, Density functional theory of atoms and molecules, Oxford University Press, 1989, vol. 1 Search PubMed.
- K. Müller-Dethlefs and P. Hobza, Chem. Rev., 2000, 100, 143–168 CrossRef PubMed.
- E. R. Johnson, S. Keinan, P. Mori-Sánchez, J. Contreras-García, A. J. Cohen and W. Yang, J. Am. Chem. Soc., 2010, 132, 6498–6506 CrossRef CAS PubMed.
- C. Adant, M. Dupuis and J. Bredas, Int. J. Quantum Chem., 1995, 56, 497–507 CrossRef.
- R. K. Askerov, Y. El Bakri, V. K. Osmanov, S. Ahmad, K. Saravanan, G. N. Borisova, R. H. oglu Nazarov, E. V. Baranov, G. K. Fukin and D. G. Fukina, J. Inorg. Biochem., 2022, 231, 111791 CrossRef CAS PubMed.
- J. Makhlouf, Y. El Bakri, A. Valkonen, K. Saravanan, S. Ahmad and W. Smirani, Polyhedron, 2022, 115937 CrossRef CAS.
- A. Hannachi, C. J. G. García, A. Valkonen and W. Smirani, J. Mol. Struct., 2022, 1267, 133569 CrossRef CAS.
- A. Hannachi, A. Valkonen, C. J. G. García, M. Rzaigui and W. Smirani, Polyhedron, 2019, 173, 114122 CrossRef CAS.
Footnote |
| † Electronic supplementary information (ESI) available. CCDC 1872733 and 1872737. For ESI and crystallographic data in CIF or other electronic format see DOI: https://doi.org/10.1039/d4ra00716f |
| This journal is © The Royal Society of Chemistry 2024 |

