 Open Access Article
Improvement of catalysis performance of pepsin and lipase enzymes by double enzyme immobilization method
Fatma Han and
Nursen Sari
 *
*
Department of Chemistry, Faculty of Science, Gazi University, 06500, Ankara, Turkey. E-mail: nursens@gazi.edu.tr; nrnsari@gmail.com
First published on 8th April 2024
Abstract
Ferrocene-coupled chitosan (CS-Fc) support polymer was synthesized for the immobilization of double enzymes and single enzymes. The immobilization study was carried out after a detailed characterization study. The binding of pepsin and lipase enzymes to the polymer was supported by the shift of peaks in the FTIR spectra of free enzymes. The particle sizes of chitosan (CS) and CS-Fc were evaluated using zeta potential measurement. The optimum conditions of the enzymes in the double enzyme system did not affect each other and each showed their activity. In the presence of double enzyme immobilization, the optimum pH remained the same with free enzyme, while the optimum temperature increased differently with an increase of 10 °C. Vmax values were 0.0020 and 0.0038 for free pepsin and lipase enzyme, respectively. However, due to double enzyme immobilization, the Vmax value increased 1.75 fold for pepsin and 3.94 fold for lipase enzyme. In the double enzyme immobilization, the substrate affinity of pepsin increased by 0.4-fold, while the substrate affinity of lipase increased by about 0.3-fold. In the 5th reuse of pepsin and lipase enzymes in the presence of double enzymes (Cs-Fc-Pep) + (Cs-Fc-Lip), it was determined as 18.21% for pepsin enzyme and 90.81% for lipase enzyme.
1 Introduction
Environmentally friendly enzymes are important tools to reduce energy consumption, solution utilization and by-product formation.1 Enzymes have optimal properties when they produce maximum yield with their substrates. In many cases, the properties of enzymes must be tailored to the target substrates to prepare a biocatalyst suitable for use in industry. However, most industrial processes require working under high temperature and pH conditions where enzymes denature and lead to loss of enzymatic activity.Today, studies on the immobilization of multiple enzymes have gained importance due to allowing the occurrence of subsequent reactions in shorter periods. Moreover, the immobilization of multiple enzymes allows producing lower amounts of waste and using lower amounts of solutions and chemicals.
Yanwei et al. achieved the immobilization of the double enzyme by immobilizing alcalase and trypsin on modified chitosan (Cs). In their study, the researchers determined the optimum conditions for the free enzymes and immobilized double enzyme and compared their Km and Vmax values.2 The same researchers achieved the immobilization of the double enzyme on the magnetic Fe3O4-chitosan support and determined the kinetic parameters.3 In one of the double enzyme studies, the optimum conditions of aldolase and pyruvate oxidase were investigated using a sensor prepared with a multi-carbon nanotube and chitosan.4 The researchers explained their choice to use chitosan by its non-toxicity, biocompatibility, and controlled biodegradability. Double enzyme studies on both immobilization and sensor design are quite rare.
Chitosan forms inter-molecular and intra-molecular hydrogen bonds depending on the amine and hydroxyl groups and, thus, have a hard crystal structure. Therefore, Cs is regarded as an important agent for use in the paper and textile industries.5,6
It is known that instead of direct binding of metal ions to chitosan, binding of Schiff base coordinated metals provides a better effect.7,8 When ferrocene (which is an organometallic compound) is bound to chitosan by forming a Schiff base, it has been determined that it can be used in different application areas.
Ferrocene is an amphiphilic compound and converts from hydrophobicity to hydrophilicity or hydrophilicity to hydrophobicity through the electron transformation between Fe(II) and Fe(III).9 Therefore, Fc is used in the design of both hydrophobic and redox-sensitive systems.10 Pepsin is an important enzyme in the health industry and helps protein analyses11 while lipase has attracted attention due to its use in the food industry and the growing interest in natural products.12,13 However, both enzymes are high-cost. Another limitation to their use in the industry is their low resistance, activity, and selectivity.
Therefore, in recent years, such valuable enzymes have been subject to certain chemical and physical processes to improve their catalytic properties. Immobilization is one of these processes. Thus, it is possible to recover the free enzyme without losing its activity.14 Preparation of support for immobilization from biopolymers is important for human and environment. Because biopolymers are not toxic. They can decompose and disappear in nature. Biopolymers are preferred in the medical field as well as in the industrial environment. The most preferred natural biopolymers are materials such as cellulose, chitosan, carrageenan, and alginate.
Glutaraldehyde is commonly used as an adhesive in the immobilization of enzymes on chitosan, a natural polymer.15,16 On the other hand, immobilization of enzymes without using an adhesive is more cost-friendly. Furthermore, electron transfer is known to be important in enzyme reactions producing the product by interacting with substrates. In other words, electron transfers are important in the formation of the reaction between the enzyme and the substrate.17 In the double enzyme environment, steric effects may increase. This state may affect the electron transfers required for the enzyme–substrate interaction.
To contribute to the electron transfer between enzyme and substrate, compounds with reversible oxidation can be used. Ferrocene is an ideal organometallic compound that exhibits reversible oxidation.18 In the presented study, we considered attaching ferrocene to the biopolymer to aid in electron transfer between enzyme and substrate.
Ferrocene has been used in some enzyme studies.19 This study is a dual enzyme immobilisation study. In our study, we performed a detailed characterisation and compared the advantages and differences of dual enzyme (pepsin + lipase) immobilisation with immobilisation performed separately. Before all the immobilization studies, solid NMR, FT-IR, SEM-EDX, elemental analysis, deacetyl degree determination, conductivity and particle size analyses of the support material were performed.
2 Experimental
2.1. Chemicals and the degree of deacetylation (DD) of chitosan
All materials were reagent grade (Sigma-Aldrich Company). Elemental analyses were carried out with a LECO, CHNS-932 instrument. Metal contents were determined by using a PerkinElmer Analyst 400 atomic absorption instrument. Solid-13C-NMR spectra of the studied polymers were recorded with a Bruker Spectrospin Avance DPX-400 instrument using TMS as internal standard and CDCl3 as solvent. IR spectra were recorded on a Mattson-5000 FT-IR instrument in KBr pellets. TGA and DSC of the chitosan and its Schiff bases were recorded by Setaram-simultaneous model thermal analyzer under nitrogen atmosphere between 25 °C and 800 °C at a heating rate of 10 °C min−1. Scanning electron microscopy of the Au–Pd-coated compounds was done by using a JEOL JEM 100 CX II scanning electron microscope (JEOL, Peabody, MA) equipped with a link analytical system. The electron energy used was 20 keV. The particle size analyses of the Cs dissolved in the Tris–HCl buffer with a pH value of 10 and CS-Fc were carried out using Zetasizer NS. The conductivities of the studied polymers were measured at room temperature using a four-probe technique on pressed pellets.| NaOH + HCl → NaCl + H2O first equivalent point |
| 〉CH–NH3+ + NaOH → 〉CH–NH2 + H2O second equivalent point |
The DD value was found 82.2 ± 2.3% from the formula below.
2.2. Synthesis of chitosan attached ferrocene
Chitosan attached ferrocene were prepared by reacting of poly-(1,4-β-D-glucopranosamin) (chitosan, low molecular weight, Sigma-Aldrich) (2 g) in hot C2H5OH (60 mL) with ferrocene aldehyde (2.14 × 10² mol) in C2H5OH (15 mL) (Fig. 1B).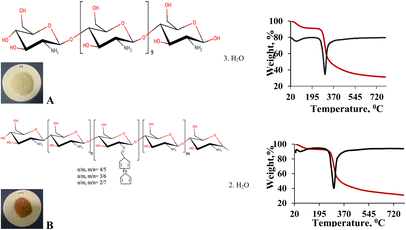 | ||
| Fig. 1 Suggestion structures of chitosan (Cs), (A); chitosan attached ferrocene (Cs-Fc), (B) and TGA and DSC curves. | ||
Aldehyde solution was slowly added by the dropwise on chitosan solution while stirring through 30 min. Then the reaction mixture was boiled and stirred under a reflux condenser ca. 6 h, at 60 °C.
After the mixture cooling to room temperature, chitosan attached ferrocene precipitated and washed by adding acetone. The resulting clear yellow product was filtered and dried in the oven at 80 °C.
2.3. Preparation solutions (tampon, pepsin, hemoglobin and substrate) for immobilization studies
The pH 1 (C2H5NO2/HCl) buffer: 0.3753 g (0.05 M) C2H5NO2 (glycine) and 0.05 M HCl were dissolved in 100 mL water. Drops of the 1 M HCl solution were added to the mixture until reaching a pH = 1. The pH 2 (KCl/HCl) buffer: 0.7456 g (0.1 M) KCl and 0.1 M HCl were dissolved in 100 mL water. Drops of the 1 M HCl solution were added to the mixture until reaching a pH value of 2. The pH 3–4 (C6H5Na3O7·2H2O) buffer: 2.941 g (0.1 M) C6H5Na3O7·2H2O (sodium citrate dihydrate) 100 mL water. For pH 3 and pH 4; 1 M HCl solution were added dropwise until reaching both pH = 3 and pH 4. The pH 6–8 (Na2HPO4/NaH2PO4) buffer: 3.5814 g (0.1 M) Na2HPO4 (di-sodium hydrogen phosphate) 100 mL water. For pH 6/pH 7; 1 M HCl solution were added dropwise until reaching both pH = 6 and pH 7. For pH 8; drops of the 1 M NaOH solution were added to the mixture until reaching pH 8. The pH 9–10 (Na2B4O7/HCl) buffer: 2.0122 g (0.1 M) Na2B4O7/(di-sodium tetraborate phosphate) 100 mL water. For pH 9/pH 10; 1 M NaOH solution were added dropwise until reaching both pH = 9 and pH 10. The pepsin solution: 100 mg of the enzyme was dissolved in 0.01 M 100 mL HCl. The solution was kept in a refrigerator at −20 °C. Hemoglobin solution: 2.5 g of the hemoglobin was dissolved in 0.01 M 100 mL HCl. The solution was also kept in a refrigerator at −20 °C. The p-nitrophenyl palmitate (p-NPP) substrate solution for lipase enzyme: 0.1 g of gum arabic, 0.4 g Triton X-100, and 0.0377 g p-NPP were dissolved in 10 mL isopropyl alcohol and brought to 100 mL volume using a 100 mM phosphate buffer (pH = 7).2.4. Immobilization of pepsin and of lipase on (Cs-Fc); general method
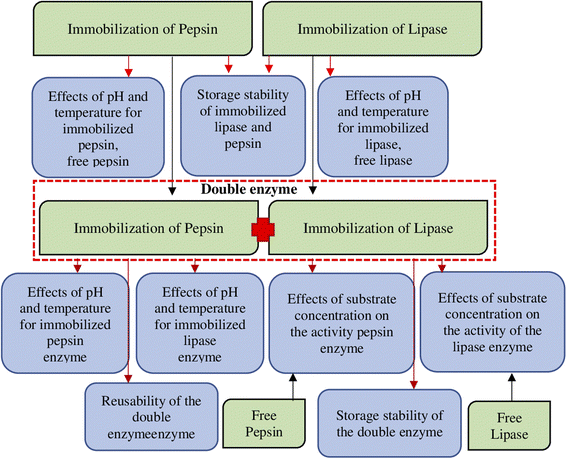
The (Cs-Fc) (1.0 g) were placed in a 20 mL water solution of 2.5 mg of enzyme (pepsin or lipase) at room temperature (22 °C) in a shaking water bath for 24 h. The immobilized (Cs-Fc) were separated and the free enzyme was removed by washing with buffer (pH: 7.0, 15 mL). The immobilized enzymes were freshly used and then stored at +4 °C. Methods related to immobilization experiments are shown in Fig. 2.For desorption, the relative activity of 2.5 mg pepsin and lipase enzymes at optimum pH before and after immobilisation were compared. According to the formula below, the relative activity of non-immobilized enzymes was determined as 16.8% for pepsin and 12.4% for lipase.
| Aabs(desorption enzyme) = Aabs(free enzyme, 2.5 mg) − Aabs(immobilized enzyme, 2.5 mg) |
The effect of pH on the activity of free pepsin was examined to compare the optimum pH values of the free enzyme and immobilized enzyme. For this purpose, 0.5 ml of the free pepsin enzyme solution that was prepared as described above (beginning of section) was transferred into six flasks and the same procedure for the immobilized enzyme was repeated.
For effects of temperature, 5 mg of immobilized pepsin (CS-Fc-Pep) was transferred to 7 flasks. To the flasks, 2.5 mL of the buffer solution at an optimum pH and 0.5 ml of the substrate solution (hemoglobin) were added. To this solution, 5 mL TCA was added, and the mixture was stirred in an ultrasonic water bath for 60 min. This process was repeated in the range of 20–70 °C with increments of 10 °C. Then, the values were plotted to determine the optimum temperature values.
In order to compare the optimum temperature values of free pepsin and immobilized enzyme, 1 ml of the free pepsin solution prepared as described above (section 2.4.1) was transferred to seven flasks and the same procedure was repeated for the free enzyme.
To determine the effect of temperature on free lipase and immobilized lipase, 5 mg of immobilized lipase (CS-Fc-Lip) was transferred to each of 7 flasks. 4 mL of the buffer solution at optimum pH and 1 mL of the substrate solution (p-NPP) were added to the flasks. Upon the completion of stirring, the clear portions of the centrifuged solutions were collected and the changes in absorbance at 405 nm were measured using UV-GB spectrophotometry. This process was repeated in the range of 20–70 °C with increments of 10 °C. Again, in order to compare the optimum temperature values of free enzyme and immobilized enzyme, 1 ml of the free enzyme solution was transferred to seven flasks and the experimental procedure described above was repeated for the free enzyme.
2.5. Preparation of the double enzyme (immobilized pepsin (Cs-Fc-Pep) + immobilized lipase (Cs-Fc-Lip))
5 mg samples from (Cs-Fc-Pep) and (Cs-Fc-Lip) that were prepared as described in above (page 8) were collected and transferred to a flask to determine the optimum conditions. 5 mg of both the (Cs-Fc-Pep) and (Cs-Fc-Lip) supports were collected and transferred to 20 flasks. 10 of the 20 flasks were used for the optimum pH of immobilized lipase in double enzyme medium and the other 10 for the optimum pH of immobilized pepsin.5 mg of both the (Cs-Fc-Pep) and (Cs-Fc-Lip) immobilized enzymes were collected and transferred to 12 flasks to determine the effects of temperature on the activities of double enzyme. 6 of the 12 flasks were used for the optimum temperature of immobilized lipase in double enzyme medium and the other 6 for the optimum temperature of immobilized pepsin.
To determine the effect of the p-NPP substrate on the activity of [(Cs-Fc-Pep) + (Cs-Fc-Lip)], 5 mg of the (Cs-Fc-Pep) and (Cs-Fc-Lip) immobilized enzymes were collected and transferred to 9 flasks. To the flasks, varying volumes (5.00–0.2 mL) of the stock p-NPP solution were added. The total volumes of the flasks were brought to 5 mL using the buffer solution at optimum pH and the flasks were brought to the optimum temperature and stirred in an ultrasonic water bath for 60 min. The changes in the absorbance values of the substrate solutions in the flasks with different concentrations (1.00–0.04 mM) were monitored at 405 nm using UV-GB spectrophotometry by collecting the clear portion of the centrifuged solution after stirring.
The effects of substrate concentration on the activities of free lipase and free pepsin were also examined to compare the kinetic parameters of the free enzymes and the double enzyme [(Cs-Fc-Pep) + (Cs-Fc-Lip)]. For this purpose, the conditions prepared for the double enzyme were re-applied using the same procedure as the one used for the double enzyme. The plot of the absorbance values against the residual substrate concentrations was drawn. The Km and Vmax values were determined using the Lineweaver–Burk calibration plot.20
To examine the reusability of the immobilized pepsin in the double [(Cs-Fc-Pep) + (Cs-Fc-Lip)] enzyme, 5 mg of both (Cs-Fc-Pep) and (Cs-Fc-Lip) were transferred to a flask. To the (Cs-Fc-Pep) + (Cs-Fc-Lip) enzyme, 2.5 ml of the buffer solution at optimum pH and 0.5 ml of the substrate (hemoglobin) solution were added and the mixture was stirred in an ultrasonic water bath at 60 °C for 30 min. After stirring, 5 mL TCA was added and the mixture was stirred for another 30 min.
3 Results
Physical characterization, microanalytical and solid-conductivity data of the Cs, Fc and (Cs-Fc) are given in Table 1. As seen in Table 1, the conductivity of the investigated materials was in the range of 10−7 to 100 S cm−1.21| Sample | Suggested unit (Mw) | Found (calcd) % | Pellets | Conductivity (S cm−1) | ||||
|---|---|---|---|---|---|---|---|---|
| Image | Thickness (mm) | |||||||
| C | H | N | Fe | |||||
| a According to elemental analysis. | ||||||||
| (Cs) | (C70H103N11O46)n | 43.88 | 6.81 | 8.53 | — |  |
0.44 | 5.45 × 10⁻⁵ |
| aMw = 1887 | (44.52) | (5.78) | (8.16) | |||||
| (Fc) | C11H10FeO | 61.68 | 4.67 | — | 26.16 |  |
0.28 | 9.08 × 10⁻⁵ |
| Mw = 214 | (61.11) | (4.82) | — | (24.93) | ||||
| (Cs-Fc) | (C89H119N10O54Fe)n | 46.04 | 6.56 | 7.77 | (2.59) |  |
0.44 | 5.62 × 10⁻⁵ |
| aMw = 2191 | (48.74) | (5.43) | (6.39) | 2.56 | ||||
The greater conductivity of Fc is attributable to its high redox activity. The increase in conductivity with the attachment of ferrocene to chitosan is attributable to the partial charge transfer by the Fe(II)/Fe(III) ions. The conductivities of Cs and (Cs-Fc) were 5.45 × 10⁻⁵ and 5.62 × 10⁻⁵, respectively. The increase in the conductivity of chitosan can be regarded as evidence for the attachment of Fc to chitosan.
3.1. Particle size measurement using a zeta potential measurement device
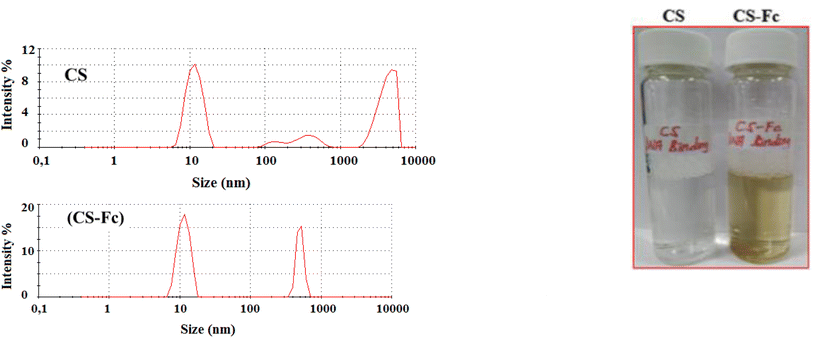
The particle size analyses of chitosan and ferrocene-attached chitosan using Zetasizer analysis showed that the materials were nano-sized and for Cs, the particles showed three distributions in the range of 11.70 nm and 4205 nm, with 11.70 nm being the most common size with a ratio of 44.2% (Table 2). For Cs-Fc, the particles had two sizes comprising 11.48 nm and 503.4 nm, with 11.48 nm being the most common size with a ratio of 64.7%. The results indicated that the diversity of the particle sizes was reduced with the attachment of ferrocene to chitosan and polymer chain length got more simplified and had a size of about 10 nm.The comparison of the plots showed that light sent to Cs-Fc scattered more than light sent to Cs. The scattered light ratio of the Cs particle was around 10% while the scattered light ratio of the Cs-Fc particle was above 15%. This is related to the particle size as the smaller size of the Cs-Fc particle increased the ratio of scattered light.
3.2. Solid 13C-NMR and FT-IR
The solid NMR spectra of both chitosan and ferrocene were used to interpret the solid NMR spectrum of the support polymer coded Cs-Fc (Fig. 3 and Table 3). The bands of the ring carbons of chitosan (Cs) were broader due to the polymeric structure. The structure of N-acetylated and N-deacetylated chitosan is seen from the solid NMR spectrum. The signal at 22.106 ppm corresponds to the carbon peaks of N-acetyl glucosamine. The C1 peak of glucosamine was observed at 172.191 ppm. The carbon peaks of chitosan and ferrocene emerged as expected. The solid NMR spectrum of the synthesized (Cs-Fc) revealed broader peaks due to the polymeric structure, as was the case in chitosan.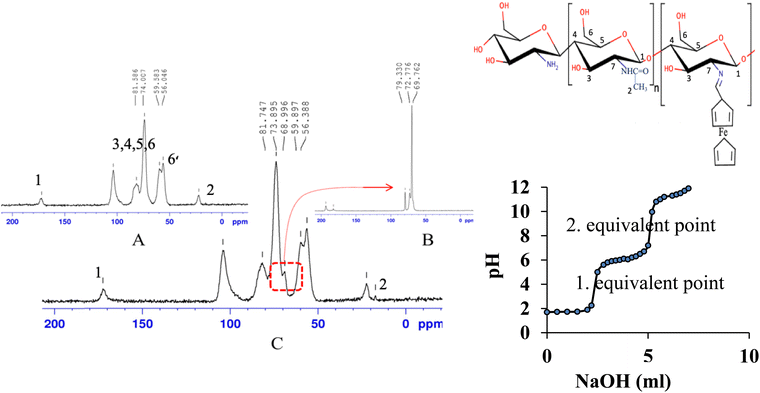 | ||
| Fig. 3 Solid-13C NMR for Cs (A), Fc (B) ve Cs-Fc (C) and pH-metric titration curve of studied for determining deacetylation degree (DD) of chitosan. | ||
| Symbol | C1 | C2 | C3 | C4 | C5 | C6,6′ | C7 | C8/9 | C10/C11 |
|---|---|---|---|---|---|---|---|---|---|
| Cs | 172.192 | 22.106 | 103.682 | 81.586 | 74.007 | 59.583 | — | — | — |
| 56.046 | |||||||||
| Fc | — | — | — | — | — | — | 193.303 | 72.736/79.330 | 69.762 |
| Cs-Fc | 172.515 | 22.420 | 104.223 | 81.747 | 73.895 | 59.897 | — | C4–C5 overlap | 68.996/17.296 |
| 56.388 |
The attachment of the ferrocene group shifted the peak of the carbon (C2) from 22.106 ppm to 22.420 ppm and a new peak emerged at 17.296 ppm. The emergence of this peak (C11) was attributed to the formation of the Fc–C![[double bond, length as m-dash]](https://www.rsc.org/images/entities/char_e001.gif) N/Fc–C–N imine bond due to the addition of aldehyde.22 The carbon peaks of chitosan shifted due to the addition of ferrocene carboxaldehyde to chitosan. The double carbon peak (C6) at 56.046 ppm and 59.583 ppm, which is attributed to the –CH2OH group, shifted to 56.388 ppm and 59.897 ppm and a new peak emerged due to the addition of ferrocene carboxaldehyde to chitosan.
N/Fc–C–N imine bond due to the addition of aldehyde.22 The carbon peaks of chitosan shifted due to the addition of ferrocene carboxaldehyde to chitosan. The double carbon peak (C6) at 56.046 ppm and 59.583 ppm, which is attributed to the –CH2OH group, shifted to 56.388 ppm and 59.897 ppm and a new peak emerged due to the addition of ferrocene carboxaldehyde to chitosan.
The FT-IR spectra of chitosan (Cs), ferrocene carboxaldehyde (Fc), ferrocene attached chitosan (Cs-Fc), lipase, pepsin, Cs-Fc-Lip, and Cs-Fc-Pep were individually and carefully examined. In the FT-IR spectrum of chitosan, the peaks at 3357 cm−1 and 3286 cm−1 were attributed to the amine groups and the broad peak at 3428 cm−1 was attributed to the hydroxyl group. The aliphatic νC–H vibration was observed at 2870 cm−1 and the amide I and amide II bands were observed at 1655 and 1591 cm−1, respectively.
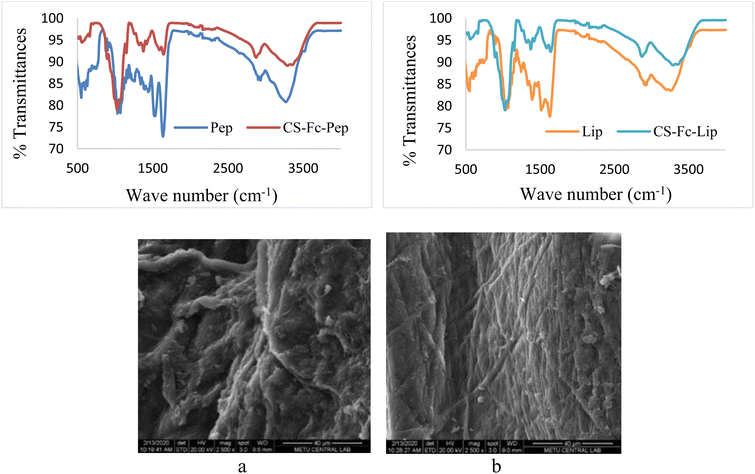
In the FT-IR spectrum of Fc, the characteristic carbonyl peak of the aldehyde group at 1680 cm−1 was observed and the peaks at 1455 cm−1, 1412 cm−1, and 1369 cm−1 belonged to the CH peaks of the Fc ring. The peaks corresponding to the vibration frequencies at 488 cm−1 and 842 cm−1 were observed to be the characteristic peaks of the Fe (Cp) ring. The FT-IR spectrum of Cs-Fc showed that the peaks of Fc at 1455 cm−1, 1412 cm−1, and 1369 cm−1 shifted to 1422 cm−1, 1372 cm−1, and 1319 cm−1 due to the changing chemical environment.23 The comparison of the peaks of δ (CH)cp observed in the spectra of Fc and Cs-Fc revealed that the peaks of Fc at 488 cm−1 and 842 cm−1 shifted to 485 cm−1 and 821 cm−1, indicating that the reaction took place. FT-IR spectra of the immobilized (Cs-Fc-Lip and Cs-Fc-Pep) and free (Lip and Pep) enzymes with respect to the regions of 3370–3250 cm−1, 1650–1200 cm−1 and 700–550 cm−1 (Fig. 4).
The co-evaluation of the FT-IR spectra of Cs-Fc-Pep and pepsin showed that the peaks of pepsin at 707 cm−1, 1203 cm−1, and 1260 cm−1 shifted to 711 cm−1, 1201 cm−1, and 1257 cm−1 in Cs-Fc-Pep. The interaction with Cs-Fc resulted in the shifting of the triple-peak of pepsin at 631 cm−1/601 cm−1/551 cm−1 to 634 cm−1 to 555 cm−1 as a broad peak. The comparison of all vibration frequencies revealed that the vibration frequencies of pepsin were also observed in Cs-Fc-Pep, leading to its interpretation as evidence for the successful attachment of pepsin to Cs-Fc. The co-evaluation of the FT-IR spectra of Cs-Fc-Lip and lipase showed that the peak of lipase at 709 cm−1 shifted to a peak at 713 cm−1 in Cs-Fc-Lip and the peak at 1246 cm−1 shifted to a peak at 1257 cm−1. A more detailed evaluation could not be made due to the formation of broad peaks.
3.3. TGA and SEM analysis
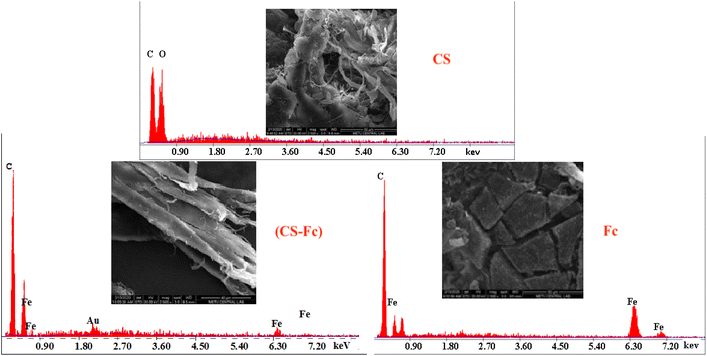
On the TGA curve, the weight losses corresponding to 95 °C were 6.6% for Cs (3 mol H2O) and 5.3% for Cs-Fc (2 mol H2O). Moreover, the examination of the DSC curves for both Cs and Cs-Fc led to the conclusion that the endothermic peak under 100 °C was due to the loss of crystal water.24 The one-step denaturation temperature for Cs started at 278 °C while it started at 272 °C for (Cs-Fc). The TGA curves revealed that denaturation occurred in a single step both for Cs and (Cs-Fc) and heating up to 800 °C resulted in weight losses of 68.7% and 69.1%, respectively. The Tg temperature was 264 °C for CS and 257 °C for (Cs-Fc). The TGA and DSC curves of Cs and (Cs-Fc) are given in Fig. 1.The SEM images showed that all compounds had different surface morphologies. The SEM images of chitosan at magnitudes of 2500 were compared to those of (Cs-Fc). The comparison of both magnitudes showed that the addition of ferrocene carboxaldehyde to chitosan caused certain changes in surface morphology and the addition of Fc caused the Cs polymer to adopt planar orientations. This is attributable to the magnetic properties of ferrocene. Furthermore, the EDAX spectra clearly showed the peaks of the isotopes of Fc, indicating the addition of Fc. For a more efficient comparison of the EDAX spectra of the Cs and (Cs-Fc) polymers, the EDAX spectrum of ferrocene carboxaldehyde was taken. According to the EDAX spectrum of ferrocene carboxaldehyde, the peaks of the Fe isotopes were intensely observed in the 6.30 keV region, dual isotopes of Fe were observed in the region between 0.45 and 0.9 keV, and low-intensity Fe isotopes were observed in the 6.75 keV region. The peaks of the Fe isotopes that were observed in the EDAX spectrum of ferrocene carboxaldehyde were also observed in the EDAX spectrum of (Cs-Fc). The EDAX spectrum of (Cs-Fc) showed the peaks of Fe isotopes in, again, the 6.30 keV region and the peaks of low-intensity Fe isotopes in the 0.45 keV region and 6.30 keV-region.
The EDAX spectra of the immobilized supports allowed us to attribute the peaks of the iron isotopes of ferrocene in the immobilized support to its remaining in the structure due to immobilization (Fig. 5). SEM imaging of (Cs-Fc-Pep) (a) and (Cs-Fc-Lip) are given in Fig. 3. The SEM-EDAX analyses were performed to observe the morphological changes on the surface of (Cs-Fc) due to enzyme immobilization. The immobilizations of both pepsin and lipase caused changes on the surface of (Cs-Fc) with the addition of the enzymes. The morphological change of (Cs-Fc-Pep) led to a vein-/rhizoid-like appearance while (Cs-Fc-Lip) had a web-like appearance. Furthermore, Fe was detected in the EDAX images of (Cs-Fc-Pep) and (Cs-Fc-Lip) and the images revealed that the structure contained ferrocene due to immobilization.
3.4. Effects of pH and temperature on the activities of free enzyme and immobilized enzyme
The effects of pH and temperature on the activities of free pepsin, lipase and immobilized pepsin, lipase on the Cs-Fc polymer were examined using the methods described in page 4 and page 6, respectively, and the plots in Fig. 6 was obtained.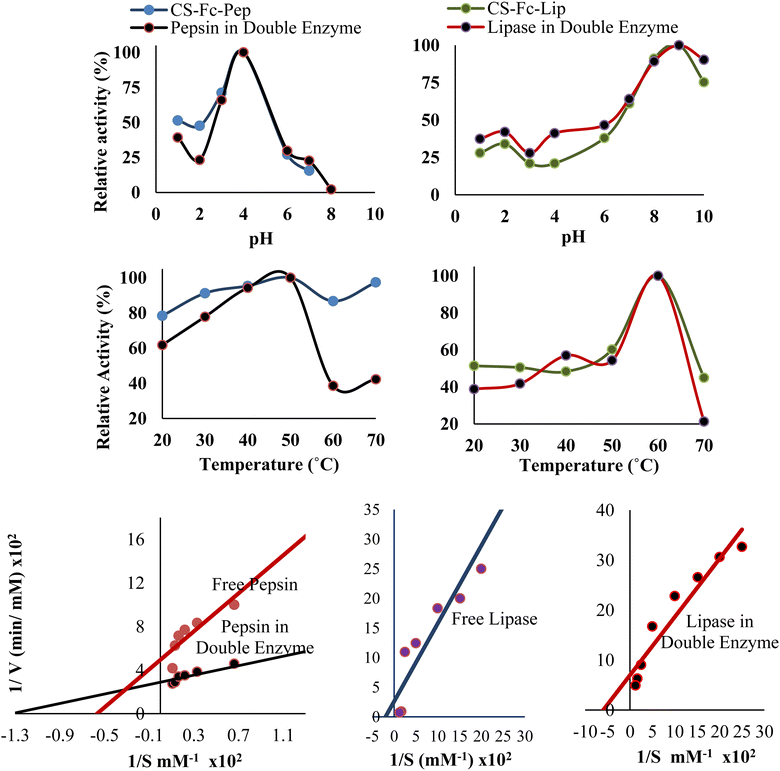 | ||
| Fig. 6 Optimum pH, temperature activities and Lineweaver–Burk plots of immobilized pepsin and immobilized lipase in the immobilization of the double enzyme. | ||
The optimum pH values of free pepsin and lipase were 2 and 8, respectively (Table 4), and the optimum pH values of the immobilized enzymes (Cs-Fc-Pep) and (Cs-Fc-Lip) were 4 and 9, respectively. The difference is attributable to the changes in the chemical environment due to the immobilization of the enzymes.25 The results for the optimum temperatures revealed that the optimum temperatures of immobilized pepsin and lipase on (Cs-Fc) were the same as those of free pepsin and lipase.
| Conditions | Free pepsin | Cs-Fc-Pep | Pepsine in [(Cs-Fc-Pep) + (Cs-Fc-Lip)] | Free lipase | Cs-Fc-Lip | Lipase in [(Cs-Fc-Pep) + (Cs-Fc-Lip)] |
|---|---|---|---|---|---|---|
| pHoptimum | 2 | 4 | 4 | 8 | 9 | 9 |
| Temperatureoptimum (°C) | 60 | 60 | 60 | 50 | 50 | 50 |
| Km (mM) | 0.0177 | — | 0.0075 | 0.5310 | — | 0.1770 |
| Vmax (mM dk−1) | 0.0020 | — | 0.0035 | 0.0038 | — | 0.0150 |
3.5. Effects of pH and temperature on the activity of the double enzyme
The method described in page 8, 9 was used to determine the effects of pH and temperature on the activities of pepsin and lipase in the presence of the double immobilized enzyme [(Cs-Fc-Pep) + (Cs-Fc-Lip)] and the plots in Fig. 5 was drawn. The optimum pH of pepsin in the presence of the double immobilized enzyme [(Cs-Fc-Pep) + (Cs-Fc-Lip)] was 4 while lipase had an optimum pH value of 9. This indicated that the pepsin in the presence of the double enzyme did not change compared to free pepsin while the lipase in the presence of the double immobilized enzyme changed compared to free lipase. The optimum temperatures of pepsin and lipase in the presence of the double immobilized enzyme [(Cs-Fc-Pep) + (Cs-Fc-Lip)] were 60 °C and 50 °C, respectively. This indicated that both pepsin and lipase did not change in the presence of the double immobilized enzyme compared to free pepsin and free lipase.3.6. Storage stability and reusability of immobilized pepsin (Cs-Fc-Pep)/[(Cs-Fc-Pep) + (Cs-Fc-Lip)] and immobilized lipase (Cs-Fc-Lip)/[(Cs-Fc-Pep) + (Cs-Fc-Lip)]
Storage stability analyses were carried out to monitor the storage and how long the activities of immobilized pepsin and immobilized lipase were maintained at room temperature. Taking the absorbance values at 280 nm for immobilized pepsin and 404 nm for immobilized lipase into account, relative activity (%) plots against time were drawn. The measurements for immobilized pepsin and immobilized lipase continued every four days. The results revealed that immobilized pepsin [(Cs-Fc-Pep)] maintained 47.02% of its activity while immobilized lipase [(Cs-Fc-Lip)] maintained 61.81% of its activity.Storage stability was examined to monitor the storage of pepsin and lipase that were immobilized on the double support at room temperature and for how long they maintained their activities. Relative activity plots against time were analyzed using absorbance values at 280 nm and 405 nm in UV-GB spectra. The measurements taken at four-day intervals showed that pepsin in double immobilized enzyme and lipase in double immobilized enzyme maintained 32.58% and 46.22% of their relative activities, respectively. In the reusability of the double enzyme; the reusability of pepsin and lipase in the presence of the double enzyme (Cs-Fc-Pep) + (Cs-Fc-Lip) showed that pepsin had reusability of 4 runs and maintained 20.42% of its activity while lipase had reusability of 10 runs and maintained 89.42% of its activity. When five times reuse of pepsin and lipase enzymes in the presence of double enzyme (Cs-Fc-Pep) + (Cs-Fc-Lip) was compared, it was determined as 18.21% for pepsin enzyme and 90.81% for lipase enzyme.
3.7. Effect of substrate concentration on the activity of the double enzyme
The method described in section 2 was used to examine the effects of the concentrations of hemoglobin, which was as the substrate for the activity of pepsin, and p-NPP, which was used as the substrate for the activity of lipase, on the double enzyme [(Cs-Fc-Pep) + (Cs-Fc-Lip)]. The Km and Vmax values were obtained by drawing the Lineweaver–Burk plots. As seen in Fig. 6, in the presence of the double enzyme [(Cs-Fc-Pep) + (Cs-Fc-Lip)], operation conditions at pH 4 and T 60 °C for pepsin and pH 9 and T 50 °C for lipase were used and the 1/V against 1/[S] plot was obtained through the calculations that were made using the absorbance values. The Km value was calculated using the point at which the line intersects the x-axis while the Vmax value was calculated using the point at which the line intersects the y-axis. The effects of the substrates on free pepsin and free lipase were also examined to compare the Km and Vmax values of the free enzymes and the double enzyme (Fig. 6).The kinetic parameters of immobilized pepsin and immobilized lipase in the immobilization of the double enzyme (Km = 0.0075, Vmax = 0.0035; Km = 0.1770, Vmax = 0.0150) were lower than those of free pepsin and lipase (Km = 0.0177, Vmax = 0.0020; Km = 0.1770, Vmax = 0.0150). This indicated that the immobilized pepsin and immobilized lipase in double enzyme [(Cs-Fc-Pep) + (Cs-Fc-Lip)] had a higher substrate affinity. Moreover, the (Vmax/Km) of immobilized pepsin in double enzyme [(Cs-Fc-Pep) + (Cs-Fc-Lip)] and (Vmax/Km) of immobilized lipase in double enzyme [(Cs-Fc-Pep) + (Cs-Fc-Lip)] ratio (0.4666; 0.0847) showed that the pepsin in the immobilization of the double enzyme had a good value than that in the free pepsin and lipase ratio (0.1129; 0.0071).
When kcat and kcat/Km values of free enzymes and double enzyme were determined, larger values were obtained for immobilized pepsin and immobilized lipase enzymes in the double enzyme. For the immobilized pepsin and immobilized lipase enzymes, the kcat was 0.27 min−1 and 0.095 min−1, respectively, and the kcat/Km values were 15.07 min−1 M−1 and 0.1789 min−1 M−1, respectively.
The kcat/Km (62.67 min−1 M−1) of immobilized pepsin in double enzyme [(Cs-Fc-Pep) + (Cs-Fc-Lip)] and kcat/Km (2.12 min−1 M−1) of immobilized lipase in double enzyme [(Cs-Fc-Pep) + (Cs-Fc-Lip)] showed that had a good value than that in the free pepsin and lipase data. In other words, the kcat/Km value of immobilized pepsin in the double enzyme increased approximately 4-fold and the kcat/Km value of immobilized lipase in the double enzyme increased 12-fold compared to free enzyme.
4 Conclusions
The differences in FTIR and solid-state NMR spectra indicate that ferrocene doped chitosan was synthesized. In our study, the optimum conditions of the enzymes in the dual enzyme system did not affect each other and each showed its own activity. While the optimum pH values increased in the immobilization of the enzymes, the optimum temperatures remained the same. On the other hand, in the presence of double enzyme immobilization, the optimum pH remained the same, while the optimum temperature increased differently in 10 °C increments.In the case of double enzyme immobilization, the substrate affinity of pepsin increased by 0.4-fold, while the substrate affinity of lipase increased by about 0.3-fold. The reusability of lipase activity was 2.5 times higher than that of pepsin. Compared to the free enzyme, the kcat/Km value of immobilized pepsin in the double enzyme increased approximately 4 times and the kcat/Km value of immobilized lipase in the double enzyme increased 12 times.
Author contributions
N. Sarı thought about the research topic, the methods and characterizations to be applied and did the writing and editing of the manuscript. Experiments were conducted by F. Han under the supervision of N. Sari. F. Han contributed to the drafting of the manuscript.Conflicts of interest
There are no conflicts to declare between the authors.Acknowledgements
This study is the master's thesis of Fatma Han, supported by Gazi University Institute of Science, Faculty of Science, Inorganic Chemistry and Physical Chemistry Research Laboratories, Scientific Research Project Coordination Unit (05/2019-05).References
- R. A. Sheldon, Chem. Soc. Rev., 2012, 41, 1437–1451 RSC.
- Y. Wang, H. Chen, J. Wang and L. Xing, Process Biochem., 2014, 49, 1682–1690 CrossRef.
- Z. Chen, X. Wang, Y. Chen, Z. Xue, Q. Guo, Q. Ma and H. Chen, Colloids Surf., B, 2018, 169, 280–288 CrossRef CAS PubMed.
- A. Fatoni, A. Numnuam, P. Kanatharana, W. Limbut and P. Thavarungkul, Electrochim. Acta, 2014, 130, 296–304 CrossRef CAS.
- K. Khwaldia, A. H. Basta, H. Aloui and H. El-Saied, Carbohydr. Polym., 2014, 99, 508–516 CrossRef CAS PubMed.
- S. Ul-Islam, M. Shahid and F. Mohammad, Ind. Eng. Chem. Res., 2013, 52(15), 5245–5260 CrossRef.
- T. Baran, A. Mentes and H. Arslan, Int. J. Biol. Macromol., 2015, 72, 94–103 CrossRef CAS PubMed.
- S. Ahmed and S. Ikram, Achiev. Life Sci., 2016, 10(1), 27–37 Search PubMed.
- L. Zhu, Y. Shangguan, Y. Sun, J. Ji and Q. Zheng, Soft Matter, 2010, 6, 5541–5546 RSC.
- S. Top, A. Vessieres, C. Cabestaing, I. Laios, G. Leclercq, C. Provot and G. Jaouen, J. Organomet. Chem., 2001, 637–639, 500–506 CrossRef CAS.
- J. B. Cooper, G. Khan, G. Taylor, I. J. Tickle and T. L. Blundell, J. Mol. Biol., 1990, 214, 199–222 CrossRef CAS PubMed.
- C. M. Romero, L. M. Pera, F. Loto, C. Vallejos, G. Castro and M. D. Baigori, Biocatal. Agric. Biotechnol., 2012, 1, 25–31 CrossRef CAS.
- G. Sargazi, D. Afzali and A. Mostafavi, J. Porous Mater., 2018, 25, 1723–1741 CrossRef CAS.
- F. Rafiee and M. Rezaee, Int. J. Biol. Macromol., 2021, 179, 170–195 CrossRef CAS PubMed.
- G. D. Altun and S. A. Cetinus, Food Chem., 2007, 100(3), 964–971 CrossRef CAS.
- W. Han, M. Yamauchi, U. Hasegawa, M. Noda, K. Fukui, A. J. van der Vlies, S. Uchiyama and H. Uyama, J. Biosci. Bioeng., 2015, 119(5), 505–510 CrossRef CAS PubMed.
- U. Guzik, K. H-Kocurek and D. Wojcieszyńska, Molecules, 2014, 19, 8995–9018 CrossRef PubMed.
- P. Garra, D. Brunel, G. Noirbent, B. Graff, F. M-Savary, C. Dietlin, V. F. Sidorkin, F. Dumur, D. Duché, D. Gigmes, J.-P. Fouassier and J. Lalevée, Polym. Chem., 2019, 10(12), 1431–1441 RSC.
- D. Elieh-Ali-Komi and M. R. Hamblin, Int. J. Adv. Res., 2016, 4(3), 411–427 CAS.
- R. Jayakumar, M. Prabaharan, P. Sudheesh, T. Kumar, S. V. Nair and H. Tamura, Biotechnol. Adv., 2011, 29(3), 322–337 CrossRef CAS PubMed.
- B. Sarı, A. Gök and D. Şahin, J. Appl. Polym. Sci., 2006, 101(1), 241–249 CrossRef.
- E. Bozkır, N. Sarı and H. Öğütcü, J. Inorg. Organomet. Polym. Mater., 2012, 22(5), 1146–1155 CrossRef.
- N. Yetim, E. H. Özkan and N. Sarı, Gazi Univ. J. Sci., 2017, 30, 114–122 Search PubMed.
- N. Sarı and S. Özcan, Chin. J. Polym. Sci., 2009, 27(5), 675–683 CrossRef.
- E. H. Özkan, N. K. Yetim, M. Gümüş, N. Sarı and A. Dişli, Maced. J. Chem. Chem. Eng., 2017, 36(1), 119–128 Search PubMed.
| This journal is © The Royal Society of Chemistry 2024 |


