 Open Access Article
A lost piece of the puzzle of the alkane cracking mechanism: a carbanion pathway on a solid base catalyst†
Zhixuan Zuo‡
,
Yuchen Sha‡,
Ruoyu Wang‡ ,
Lixin Wang,
Haitao Song,
Peng Wang
 * and
Zhijian Da*
Sinopec Research Institute of Petroleum Processing Co., Ltd., No. 18 Xueyuan Road, Haidian District, Beijing, 100083, P. R. China. E-mail: wangpeng.ripp@sinopec.com; dazhijian.ripp@sinopec.com; Tel: +86-10-82368547 Tel: +86-10-82368390
First published on 8th May 2024
Abstract
The alkane cracking mechanism has been a subject of intense scrutiny, with carbonium and free radical mechanisms being two well-established pathways which correlate to solid acid catalysis and thermal cracking, respectively. However, despite an understanding of these two mechanisms, certain intricacies remain unexplored, especially when it comes to alternative reaction routes over solid base materials. This gap in the knowledge hinders optimization of the desired product selectivity of alkane cracking processes. In this work, solid superbases were first prepared by impregnation of NaNO3 on MgO. The Na/MgO catalysts were characterized by XRD, BET, XPS and CO2-TPD techniques. To investigate the role of solid base materials, propane cracking was conducted over MgO and Na/MgO. SiO2 was chosen as a representative of thermal cracking. Na/MgO showed better selectivity for light olefins than MgO or SiO2. Ethylene and light olefin selectivity could reach about 65.8% and 91.7%, respectively. Meanwhile, in terms of Na/MgO, the ratio of ethylene selectivity and propylene selectivity is greater than 2, exhibiting the advantage of selectivity for ethylene, which is obviously different from MgO and SiO2. Propane cracking over Na/MgO with different loading amounts of NaNO3 was investigated further. The conversion rates of the samples presented a “volcano curve” with increasing Na content. Furthermore, DFT calculation showed that the base-catalyzed process of the propane cracking reaction follows a carbanion mechanism. The better product distribution and stronger surface base sites can be ascribed to charge transfer arising from the loading of NaNO3.
1. Introduction
Light olefins such as ethylene and propylene are important chemical building blocks, which are honored as the keystones of modern industry. The production capacity of ethylene and propylene is one of the most significant emblems of the economic strength and industrialization level of a country.1 At present, there are various technologies for the production of light olefins, such as steam cracking, catalytic cracking, propane dehydrogenation, methanol to olefins, and ethanol to olefins, among which steam cracking has been the major route for the production of light olefins, accounting for more than 90% and 50% of the yield of ethylene and propylene, respectively.1–3 However, the reaction temperature of steam cracking usually exceeds 800 °C, with higher CO2 emission and less desired product distribution. In particular, ethane is frequently used as feedstock in some new steam cracking units, where propylene is typically co-produced in a limited yield as a by-product with the production of ethylene.4,5 Compared with the traditional steam cracking process for hydrocarbons, catalytic cracking offers a lower operating pressure and temperature. Moreover, investment in a catalytic cracking unit is lower as well.6–8 Besides reducing the reaction temperature and energy consumption, the process is adaptable to a variety of feedstocks, and the product distribution can be flexibly regulated at the same time.9–12 Zeolite, a typical solid acid material, is usually used as the most important component in a catalytic cracking catalyst. In the past several decades, numerous studies have proven that the hydrocarbon molecules are converted into light olefins in a carbonium ion mechanism over the zeolite catalyst. However, these catalysts are usually recognized to be sensitive to S, N, and heavy metals, e.g. Fe, Ni and V. In addition, coke formation on the zeolite via an excessive hydrogen transfer reaction over the acid site could also impede the cracking selectivity.13,14Over the past several decades, a great deal of prior work has been focused on the development and application of acid catalysts in the catalytic cracking process, while the development of basic catalysts has been virtually ignored due to their more complicated and expensive preparation process compared with that of solid acid catalysts, smaller specific surface area, poor structural strength, weak hydrothermal stability, and the fact that both CO2 and H2O in the air are easily adsorbed on the active sites of the solid base, leading to passivation of the solid base.15–22 Moreover, the reaction temperature, C/O (catalyst to oil) ratio and atmosphere could also have significant impacts on product selectivity. For instance, in terms of Li/MgO, the oxygen concentration had a considerable influence on hexane conversion and selectivity for products, especially COx.23–26
In recent years, the hydrocarbon cracking process for light olefin production via base-catalysis has drawn much attention due to its general anti-coking performance and good stability of the solid base-catalysis compared to liquid base catalysis.27 Solid base catalysts like N–Co/γ-Al2O3 and Li/MgO were investigated for the production of light olefins via oxidative cracking of hydrocarbons. The conversion of n-butane of 82 wt% could be achieved by the utilization of N–Co/γ-Al2O3 under an oxygen atmosphere at 600 °C, with the yields of ethylene and propylene reaching 31 wt% and 13 wt%, respectively.28 Li/MgO prepared by the sol–gel method was shown to be a good catalyst with 28 mol% hexane conversion and 60 mol% light olefin selectivity at a lower reaction temperature of 575 °C.23 KVO3/Al2O3 prepared by impregnation was used as a catalyst in the catalytic pyrolysis reaction of naphtha, in which the KVO3 component showed better anti-carbon-deposition ability. The yields of ethylene and propylene at a reaction temperature of 800 °C were increased by 10% and 5%, respectively, compared with thermal cracking.29 Recently, calcium aluminate (CaAl) solid base catalysts were applied in the catalytic cracking of heavy oils. Niwamanya et al. presumed that the strong basicity of calcium aluminate could promote the dehydrogenation of hydrocarbon molecules, thereby raising the yield of light olefins, compared to silica sand.30 In addition, Tian et al. further studied the performance of a calcium aluminate (CaAl) catalyst in catalytic cracking reactions. It was suggested that the catalyst promoted the generation of free radicals by hydrogen abstraction of the reactants and thus improved the yield of light olefins.31–34 Recently, Wu et al. claimed a base-catalyzed technology named DPC (direct petroleum cut to chemicals and materials) for the catalytic cracking of heavy oil. It was proposed that the conversion of the heavy oil over the DPC base catalyst followed a carbanion reaction mechanism, but no evidence was provided to prove such a conjecture.35 Moreover, the physical and chemical properties of the basic catalysts and the structure–activity relationships during the catalytic reaction were barely determined in the above cases, and the catalytic mechanism for the base-catalytic process has not been explained in detail.
Currently, many metal oxides and basic components have been used in the synthesis and studies of the catalytic performance of solid base catalysts, such as Al2O3, MgO and Na2O. Among them, Al2O3 has been studied more due to its amphiphilic properties, and the OH groups on its surface provide weakly basic sites with a Hammett index of <7.2.36 Although most current Al2O3-based catalysts are valued for their acidic sites, the involvement of basic sites in the catalytic process is unavoidable.37 Magnesium oxide is a typical solid base catalyst and has been more widely and intensively studied among metal oxides due to its easier preparation by heat treatment and the easier availability of well-structured samples. The basic sites of magnesium oxide are usually considered to be defects in the lattice and lattice oxygen of magnesium oxide, and their basic strength varies with pretreatment conditions, with treatments at 450 °C in a vacuum giving basic strengths with Hammett indexes ranging from 18.4 to 26.5.38 It has been found that the loading of Na species on MgO provides stronger base sites with Hammett indexes of 26.5–35.0, and this improvement has also attracted more attention.39
Herein, in order to investigate the mechanism of base-catalyzed cracking over solid base materials with different basic strengths, MgO, and a series of Na/MgO samples prepared by NaNO3 impregnation with different loading amounts were prepared to represent regular solid base and solid superbase (base strength H− of at least +26), respectively. Then, propane, as a model compound due to its structural simplicity, was chosen to evaluate the differences in catalytic activity and selectivity of the above catalysts. In order to discriminate the difference between base-catalyzed and thermal cracking, an SiO2 sample was investigated as well. Moreover, with the aim of gaining an insight into the catalytic mechanism of a base-catalyzed process, DFT calculation was further conducted to explain the catalytic performances of the base catalysts.
2. Experimental section
2.1 Catalyst preparation
2.2 Characterization
Several characterization techniques were used to investigate the properties of the samples examined in this article.Elemental analysis of the prepared samples was carried out with X-ray fluorescence (XRF) using a 3271E X-ray fluorescence spectrometer (Rigaku Corporation, Japan) with the following test conditions: Rh target, excitation voltage 54 kV, excitation current 50 mA.
X-ray diffraction (XRD) patterns were recorded on a D5005D XRD instrument (Siemens, Germany) with Cu Kα radiation at 40 kV and 40 mA and a scanning speed of 10° min−1 for shape and phase investigation.
The textural properties of the catalysts were determined on a Micromeritics ASAP 2420 instrument with the aid of nitrogen adsorption at 77 K after outgassing the samples for 4 h under 10−2 Pa.
The pretreatment temperature required for the prepared samples and the effect of high-temperature calcination on the catalyst were determined by thermogravimetry-mass spectrometry (TG-MS). The TG-MS instrument performed simultaneously using a thermogravimeter (Labsys Evo STA, France) and a quadrupole mass spectrometer (Pfeiffer Vacuum QMS 422, France) and the signals were recorded for m/z 32, 44, and 30, which were considered to be molecular weight ions of O2, CO2, and NO, respectively.
The base property of the catalysts was determined by CO2-temperature-programmed desorption (CO2-TPD) technique of CO2-preadsorption using an Autochem II 2950 unit equipped with a thermal conductivity detector. Typically, a sample of 300 mg was thermally treated in the presence of helium gas at 850 °C for 2 h, and then the temperature of the sample was cooled to 100 °C and subsequently the gas flow was switched from helium to CO2/He gas (10 vol% CO2, 50 mL min−1) for 30 min. Then the sample was flushed with helium gas for 1 h to remove the physically adsorbed CO2 molecules. Finally, the responses from the thermal conductivity detector were recorded at a ramp of 10 °C min−1 from 100 °C to 850 °C under helium gas flow to obtain the CO2-TPD patterns of the samples.
The crystal size, morphology, and microanalysis of the elements (EDS-mapping) were examined with a HITACHI S-4800 scanning electron microscope (SEM).
The basic strength of the samples was determined by the Hammett index method, whereby the basic catalysts were measured by probe molecules with specific acidic strengths, and the basic strength was evaluated by a color reaction. H− is the base strength determined from the pKa value of an adsorbed indicator according to H− = pKa + log(B−)/(BH), where pKa is the negative logarithm of the dissociation constant of the indicator, BH is the concentration of the acidic form of the indicator, and B− is the concentration of the basic form. The (B−)/(BH) ratio is considered to be 1. In this experiment, bromothymol blue, 4-chloro-2-nitroaniline, 4-nitroaniline, 4-chloroaniline, and diphenylmethane were used as indicators for measuring basicity, and the specific color-changing reactions, data, and information about the indicators are listed in Table S1.† First, a calculated amount of the indicator was placed in a small glass vial and a calculated amount of fully dehydrated pure benzene was added to formulate a 1% solution of the indicator, which was closed completely with a seal to avoid the effects of carbon dioxide and water in the air. Another clean vial was taken and 2 mL of completely dehydrated pure benzene liquid was added; 0.1 g of solid base catalyst powder that had been roasted and dried in preparation was weighed and added to the vial, which was quickly and completely sealed with a sealing sticker and lightly shaken. An appropriate amount of indicator solution was extracted with a syringe and added into the above vials, and left for 12 h for observation. When one vial shows acid color and the other vial shows base color, the base strength of the solid base catalyst will be between the two values.
2.3 Evaluation of catalytic performance
The evaluation method used was pyrolysis gas chromatography (PY-GC) which can make the feedstock vaporize and react with the catalysts quickly; the products directly enter the gas chromatography analysis system for separation and analysis. Catalytic cracking of propane over the prepared samples was carried out in a multi-functional pyrolysis analysis system, which consisted of a gas chromatograph (Agilent 8890, United States) and a single micro-furnace rapid reactor (Frontier Lab Rx-3050SR, Japan) fitted directly onto the aforementioned gas chromatograph. The catalysts were initially pressed, crushed, and sorted into grains of 40 to 60 mesh before the experiment. A sample of 0.1 g was loaded into a quartz reaction tube and fixed at both ends with porous quartz paper. The device was connected after placing the quartz reaction tube into the reactor and then pretreated in situ at 500 °C for 1 h in the reactor mentioned above. Subsequently, the propane gas (≥99%) quantified at 0.25 mL through a quantitative loop was passed through the reactor to interact with 0.1 g of catalyst at a desired temperature. The cracking products were carried by the carrier gas (high-purity nitrogen) directly into the vaporization chamber of the gas chromatograph through a specially made connecting needle under the micro-furnace reactor, and then into the gas chromatographic analysis system equipped with FID and TCD detectors for on-line qualitative and quantitative analysis of the products. A more detailed scheme of the experimental device for catalytic performance testing of the catalysts is shown in Fig. S1.† Eventually, the areas of all product peaks were summed to obtain the total absolute peak area (TAPA). The relative content of each component was calculated according to the area-normalization method. Thus, the conversion of propane and the selectivity of the products were calculated according to the following equations.2.4 Computational details
Density functional theory (DFT) calculations were performed using Materials Studio 8.0 from BIOVIA. The optimizations performed on the compounds and the search for reactive transition states were carried out mainly using the Dmol3 model. The functional was M06-L, DNP base cluster. The inner electrons were processed using the all-electron approach. After optimization on the structures of the reactants and products, the transition states for each elementary reaction were searched with the LST/QST method. The adaptive convergence thresholds for energy, gradient and shift amounted to 1.0 × 10⁻⁵ Ha, 0.002 Ha·Å−1 and 0.005 nm, respectively. The surface adsorption energy (ΔEads) was calculated with the following equation: ΔEads = Esurface-sub − Esurface − Esub, where Esurface-sub, Esurface, and Esub are the adsorption energy of propane in the substrate, the energy of the bare substrate, and the energy of the adsorbate, respectively.3. Results and discussion
3.1 Textural characterization of the catalysts
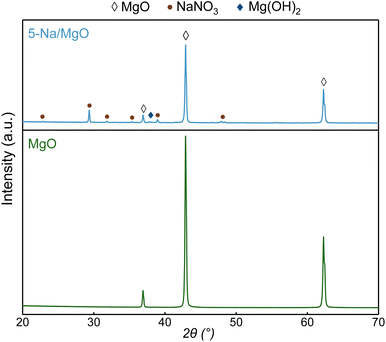
The powder X-ray diffraction patterns of bare MgO and sodium-nitrate-modified MgO are shown in Fig. 1. The major diffraction peaks at 2θ = 36.9°, 42.9°, and 62.3° in both MgO and 5-Na/MgO samples can be assigned to the (1,1,1), (2,0,0), and (2,2,0) facets of MgO in the periclase crystalline phase. Both the peak positions and the peak widths at half height are almost identical, indicating that the structure of MgO remained intact during the preparation of the 5-Na/MgO catalyst. By comparing the XRD patterns of the MgO and 5-Na/MgO samples, it is found that the intensity of the diffraction peaks corresponding to MgO decreases slightly, indicating that the introduction of Na only decreases the content of MgO. The appearance of new diffraction peaks indicates the introduction of new crystal phases. The smaller diffraction peak at 2θ = 37.9° corresponds to the (1,0,1) facet of Mg(OH)2 in the brucite crystalline phase, suggesting the presence of a small amount of Mg(OH)2 on the surface of 5-Na/MgO. The Mg(OH)2 structure is assumed to be formed during preparation due to the high calcination temperature and moisture derived from the impregnation method.15 Moreover, the 5-Na/MgO sample presents five further diffraction peaks of NaNO3, at 2θ = 29.4°, 31.9°, 35.4°, and 38.9° corresponding to the (1,0,4), (0,0,6), (1,1,0), and (1,1,3) facets of NaNO3 in the nitratine crystalline phase, respectively. This indicates that NaNO3 remained well crystallized on the surface of MgO during this preparation. Through his research, E. S. Freeman proposed that NaNO3 could be completely decomposed at a high temperature of about 600 °C in an inert atmosphere, while the decomposition reaction of NaNO3 in the air atmosphere would reach a certain equilibrium.40 Our study proves that the remaining sodium nitrate could result from the complex reactions during the calcination (vide infra).The as-prepared MgO and 5-Na/MgO samples were further investigated using the thermogravimetric-mass spectrometer in order to study their surface condition and stability. The thermogravimetric curves of the catalysts are shown in Fig. 2(a). In terms of MgO, no significant weight loss is observed even if the heating temperature reaches 800 °C, while there is about 4% weight loss detected in 5-Na/MgO, indicating that 5-Na/MgO has relatively weak thermal stability at high temperature compared with MgO.
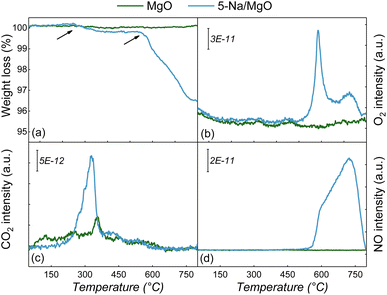 | ||
| Fig. 2 TG-MS curves of MgO and 5-Na/MgO: (a) thermogravimetry, (b) O2 detection signals, (c) CO2 detection signals, (d) NO detection signals. | ||
During the heating-up process, several molecular fractions with molecular weights m = 32, 44, and 30 were selected by mass spectrometry to denote the detection signals of O2, CO2, and NO, respectively. The corresponding test results are shown in Fig. 2(b–d). It can be seen that the weight loss of 5-Na/MgO is mainly attributed to the decomposition of substances associated with these three gas molecules. As shown in Fig. 2(b), 5-Na/MgO showed two signal peaks of O2 in the temperature range of 500–780 °C, which can be attributed to the decomposition of NaNO3 and NaNO2, respectively. According to previous research, NaNO3 could undergo decomposition to produce O2 at this temperature in the inert atmosphere following reaction eqn (1), while the NaNO2 generated according to reaction eqn (1) would further decompose to produce O2 following reaction eqn (2).40,41 As shown in Fig. 2(c), the CO2 signals detected in both MgO and 5-Na/MgO samples at a temperature of 200–400 °C could be attributed to the CO2 adsorbed from the air by the basic sites during storage of these catalysts. Meanwhile, both catalysts showed smaller CO2 signal peaks at a temperature of 450–650 °C. Since basic substances tend to capture CO2 from the air and generate the corresponding carbonate, it is hypothesized that the carbonate decomposed at this temperature.15 As shown in Fig. 2(d), a large NO signal peak appeared in the temperature range of 550–800 °C for 5-Na/MgO. The formation of NO follows reaction eqn (3) and (4) and is largely attributed to the decomposition of NaNO2. It is noteworthy that the NO2 produced by reaction eqn (3) would continue to react with NaNO2 to form NaNO3.42 The results of further XPS studies on the Na/MgO samples are shown in Fig. S2,† where it was found that the Na1s peak maximum corresponding to a binding energy at 1071.4 eV shifted to the lower binding energy region with an increase in the NaNO3 loading amount, while the peak of binding energy at 1071.4 eV corresponded to the Na atoms in NaNO3, which indicated that the Na atoms had undergone an increase in electron density.43 The Na1s spectrum of the Na atom of Na2O corresponds to a binding energy of 1072.5 eV, and the corresponding Na1s peaks do not appear at the position of this binding energy, suggesting that the Na species are largely in the form of NaNO3, but only a small amount of Na2O is present on the surface of the series of samples.44 Then, as shown in Fig. S3,† the presence of a large amount of NaNO3 was supported by further XRD studies, where the presence of NaNO3 was detected on all Na/MgO samples with different loading amounts, but the diffraction peak corresponding to Na2O could not be found.
A comprehensive analysis of Fig. 2 and the above reaction equations revealed that NaNO2, as one of the products of NaNO3 decomposition, could be partially converted into NaNO3 again during the next step of the reaction, which confirms the above hypothesis that the presence of Na on the surface of Na/MgO is mainly in the form of NaNO3.
| NaNO3 = NaNO2 + 1/2O2 | (1) |
| 2NaNO2 = Na2O + N2 + 3/2O2 | (2) |
| 2NaNO2 = Na2O + NO2 + NO | (3) |
| NaNO2 + NO2 = NaNO3 + NO | (4) |
![[thin space (1/6-em)]](https://www.rsc.org/images/entities/char_2009.gif) :
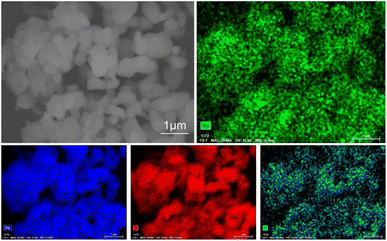
:![[thin space (1/6-em)]](https://www.rsc.org/images/entities/char_2009.gif) 1.69 and that there is a lot of NaNO3 available on the surface of MgO.
1.69 and that there is a lot of NaNO3 available on the surface of MgO.
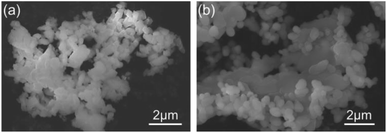
SEM images of MgO and 5-Na/MgO are given in Fig. 4. As shown in Fig. 4(a), fresh MgO is in a homogeneous granular state and has a smooth surface, with particle diameters ranging from 0.5 to 2 μm. As shown in Fig. 4(b), the loading of NaNO3 resulted in a slight agglomeration of NaNO3 on the surface of 5-Na/MgO with minor encapsulation of NaNO3. At the same time, the MgO support experienced partial agglomeration, resulting in larger catalyst particles with a size of 3–4 μm. The encapsulation would lead to the blockage of some of the pores when the surface of MgO is covered, resulting in a certain degree of reduction in the specific surface area and pore volume of the catalyst.
N2-adsorption and desorption isotherms were performed for the series of catalysts in order to further characterize the pore structure properties. The nitrogen adsorption–desorption isotherms and pore size distribution of the samples are shown in Fig. 5. SiO2 showed a type-IV isotherm with partial mesopores.45 The pores on SiO2 consist predominantly of mesopores (2–50 nm) with a smaller number of other pores, while MgO contains mainly macropores. After NaNO3 loading on MgO, the numbers of pores of different pore sizes were reduced to different degrees, indicating that the loading of NaNO3 differentially blocked these pores. The specific surface area and microporous/remaining pore volume data of the series catalysts are shown in Table 1. It is noteworthy that NaNO3 covered a large amount of the MgO surface, resulting in the specific surface area of 5-Na/MgO being even lower than that of SiO2. The total pore volumes of other pores on 5-Na/MgO decreased dramatically, suggesting that the introduction of NaNO3 by the impregnation method could cause NaNO3 to mainly block the mesopores and macropores on MgO. These findings further confirm the previous hypotheses.
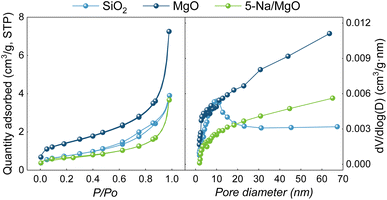 | ||
| Fig. 5 N2 absorption–desorption isotherm curves (left) and pore size distributions (right) of MgO and 5-Na/MgO. | ||
| Sample | Specific surface areab (m2 g−1) | Vmicroab (cm3 g−1) | Vmeso+macroab (cm3 g−1) | H−c | Na2Od (wt%) | MgOd (wt%) |
|---|---|---|---|---|---|---|
| a Vmicro stands for microporous volume per unit mass of catalyst. Vmeso+macro stands for mesoporous and macroporous volume per unit mass of catalyst.b Specific surface area was determined by the BET method. Vmicro was calculated by the t-plot method. Vtotal stands for total pore volume of pores. Vmeso+macro was calculated using “Vtotal − Vmicro”. Results taken from the N2 adsorbed at P/P0 = 0.98.c Determined by the Hammett function method from Ref. Bull. Chem. Soc. Jpn. 1993, 66, 2016–2032. As described in the experimental section of this work.d Determined by X-ray fluorescence spectrometer. | ||||||
| SiO2 | 2.6 | <0.001 | 0.006 | — | 0 | 0 |
| MgO | 5.0 | <0.001 | 0.011 | >18.4 | 0 | 100 |
| 5-Na/MgO | 2.4 | <0.001 | 0.005 | >26.5 | 1.41 | 98.59 |
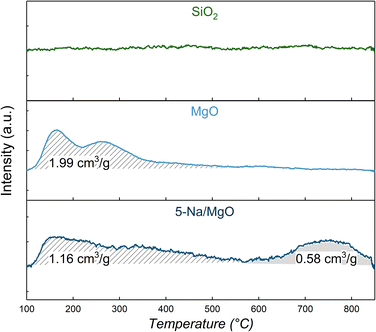
In order to study the changes in basic properties of the base catalysts and to clarify the variation in their basic strength and the quantity of basic sites, the Hammett basicity index method and CO2-TPD technology were used for further characterization and analysis, and the results are displayed in Table 1 and Fig. 6, respectively.46 In 1989, Tanabe et al. defined a solid base with Hammett basicity index H− > 26 as a solid superbase, based on the calculation and definition of the acidity index H0 of a solid superacid.47 A study also showed that the addition of Na species to MgO could provide stronger base sites with Hammett indices of 26.5–35.0.39 Haznan et al. prepared MgO–CeO2 catalysts by loading CeO2 on MgO and showed the basic strength H− to be >18.4.48 Wei et al. examined the basic strength of MgO/SBA-15 material using Hammett's indicator, and its H− of 22.5 was comparable to that of bulk magnesium oxide.49 The solid base catalyst prepared by loading NaNO3 onto SBA-15 had an H− of only about 9.3 due to its structural collapse.50 From the basicity index data in Table 1, it can be seen that the Hammett index of the MgO samples is greater than 18.4, which is similar to the basic strength of MgO, with Hammett indices ranging from 18.4 to 26.5 obtained from treatment under vacuum at 450 °C in ref. 38. Thus, the loading of NaNO3 on MgO significantly enhances its basicity strength, which increases from H− > 18.4 to H− > 26.5, and the basicity strength of 5-Na/MgO reaches that of a superbase. According to Matsuhashi et al., the generation of superbase sites is usually attributed to the induction effect caused by electrons released from alkali metals being attracted to oxygen vacancies, and this induction effect becomes more pronounced when two electrons simultaneously transfer to a single vacancy.51
Since the amount of CO2 adsorbed is positively correlated with the number of basic sites, the amount of CO2 adsorbed per unit mass is labeled in Fig. 6 and was used to characterize the number of basic sites. The temperature of CO2 desorption corresponded to the strength of the basic sites and was positively correlated, so ranges of temperatures lower than 550 °C were defined as weak bases, and ranges of temperatures higher than 550 °C were defined as strong bases. None of the CO2 desorption peaks appeared on SiO2, indicating that it was not a base catalyst but a neutral carrier. MgO showed only two CO2 desorption peaks in the low-temperature range of 110–550 °C while a total CO2 adsorption capacity of 1.99 cm3 g−1 was observed, reflecting the presence of only weakly basic sites on MgO. A total CO2 adsorption capacity of 1.74 cm3 g−1 was displayed on 5-Na/MgO, suggesting that 5-Na/MgO had fewer basic sites than MgO, which confirmed the covering of NaNO3 on the MgO surface. However, 5-Na/MgO developed a peak corresponding to stronger bases in the temperature range of 550–840 °C, indicating that the introduction of NaNO3 brought strong basic sites to the catalyst and showed a CO2 adsorption capacity of 0.58 cm3 g−1, which was corroborated by the results of the basicity index method shown in Table 1. From analysis of the above results, the introduction of NaNO3 provided stronger basic sites and increased the base strength of the catalyst, though partial covering of the surface of MgO led to a decrease in the number of weakly basic sites from 1.99 cm3 g−1 to 1.16 cm3 g−1.
3.2 Propane catalytic cracking activity
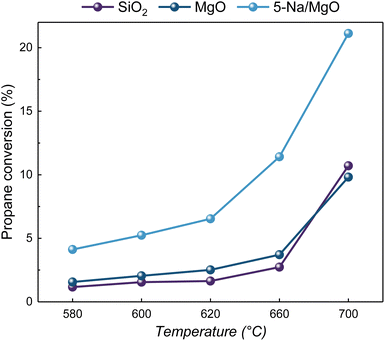
Catalytic cracking of propane was implemented to evaluate the catalytic performance of the different catalysts. The cracking reaction over SiO2 can be considered as the thermal cracking process of a neutral catalyst, while the cracking reaction over MgO and 5-Na/MgO can be reckoned as the catalytic process of solid base catalysts with different base strengths. The conversion curves of catalytic cracking of propane performed on different catalysts at different reaction temperatures are shown in Fig. 7. The propane conversions of all samples increased along with temperature. When the reaction temperature is below 660 °C, it can be seen that the activity of the 5-Na/MgO catalyst is significantly higher than that of the other catalysts. After increasing the reaction temperature to 700 °C, the conversion of propane on SiO2 increased and exceeded that of MgO. This is consistent with the perception that thermal cracking processes generally need to be carried out at high temperatures, reflecting the features of the free radical mechanism.52With an increase in reaction temperature, the propane conversion of the series of catalysts was enhanced to different degrees. Among them, the catalytic activity of 5-Na/MgO showed the greatest improvement, with the conversion increasing from 4.1% to more than 21%. The conversion of 5-Na/MgO was increased by about 2.5% at a reaction temperature of 580 °C compared to that of MgO, and by about 11% at a reaction temperature of 700 °C. The above results suggest that MgO with weaker basic strength could not significantly improve the catalytic performance for the catalytic cracking reaction of propane, while the 5-Na/MgO catalyst with stronger basicity showed significantly better catalytic performance. 5-Na/MgO might have a lower activation energy barrier for catalytic cracking than the other catalysts, showing a noticeable advantage provided by the stronger base site.
In order to study the differences in the series of catalysts in catalytic cracking and their role in increasing the production of light olefins, the product distributions of the series of catalysts were further analyzed and compared. The product distribution of the catalytic cracking reaction of propane over the series of catalysts is shown in Fig. 8. As shown in Fig. 8(a), the H2 selectivity of SiO2 and MgO catalysts increased rapidly with the increase in reaction temperature, and the positive correlation between H2 selectivity and reaction temperature indicated that these catalysts tended to generate more H2 at high temperatures, and that this process might lead to competitive adsorption of H2 on the surface of the catalysts, which in turn would inhibit the conversion of the reaction and the yield of light olefins. In contrast, the selectivity for H2 is much lower than that of SiO2 and MgO and is stabilized using 5-Na/MgO as catalyst. With the increase in reaction temperature, the selectivity for H2 did not show a positive correlation with reaction temperature, and even decreased to a certain extent with the increase in reaction temperature, implying that a new catalytic process different from that of the SiO2 or MgO catalysts could be developed on the 5-Na/MgO catalyst. As shown in Fig. 8(b), SiO2 had the lowest CH4 selectivity followed by 5-Na/MgO at a reaction temperature of 580 °C. However, the CH4 selectivity on SiO2 and MgO catalysts increased rapidly with the raising of the reaction temperature. Although there was an increase in CH4 selectivity on 5-Na/MgO, the increment was minimal compared to that of the other catalysts. When the reaction temperature was 600–700 °C, the CH4 selectivity on 5-Na/MgO was significantly lower than that on the other catalysts and the CH4 selectivity on 5-Na/MgO was relatively unchanged in this temperature range, and the comparison of these results reflected that the 5-Na/MgO catalysts had a good performance of inhibiting CH4 production. In the product distributions shown in Fig. 8, the 5-Na/MgO catalyst is clearly distinguishable from the other catalysts by the C2H4 selectivity in addition to the H2 selectivity, and the C2H4 selectivity of the three types of catalysts at different reaction temperatures are shown in Fig. 8(c). Remarkably, the C2H4 selectivity of the 5-Na/MgO catalyst reached 59.56% at 580 °C, which was about three times higher than that of SiO2, whereas the C2H4 selectivities of the SiO2 and MgO catalysts were only 4.07% and 12.74%, respectively, which clearly demonstrated that the mechanism of propane catalytic cracking was different on 5-Na/MgO compared to the other catalysts. With the increase in reaction temperature, the C2H4 selectivity of the three types of catalyst increased to a certain extent, but the increase was not significant. The C2H4 selectivity on the 5-Na/MgO catalyst is maintained at more than 60%, whereas the highest C2H4 selectivity achieved by the other catalysts is only 29.74% of that of the MgO catalyst at 660 °C, which indicates that the 5-Na/MgO catalyst showed superior promotion of C2H4 production. This indicates that the 5-Na/MgO catalyst has better catalytic performance, and that the use of this kind of catalyst could radically change the product distribution of the propane catalytic cracking reaction to maximize the production of ethylene. The C3H6 selectivity of the series of catalysts is shown in Fig. 8(d), and 5-Na/MgO had the highest C3H6 selectivity at a reaction temperature of 580 °C. However, the differences in C3H6 selectivity among the three types of catalyst kept narrowing as the reaction temperature increased. The C3H6 selectivities of SiO2 and MgO slightly increase, while the C3H6 selectivity of 5-Na/MgO shows no significant increase or decrease. The above results show that the 5-Na/MgO catalyst has better C2H4 selectivity and lower H2 and CH4 selectivity, which can provide a more reasonable product distribution for the propane catalytic cracking reaction.
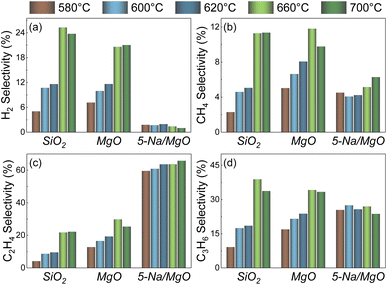 | ||
| Fig. 8 Catalytic cracking performance for the catalysts at different temperatures: (a) H2 selectivity, (b) CH4 selectivity, (c) C2H4 selectivity, (d) C3H6 selectivity. | ||
Through the above analysis, the 5-Na/MgO catalysts showed significant differences in terms of catalytic performance over the other catalysts. Therefore, the catalytic properties of the three types of catalyst were further investigated by comprehensive analysis of different products, as shown in Fig. 9. As can be seen from Fig. 9(a), with the increase in reaction temperature, 5-Na/MgO maintained the highest light olefin selectivity, followed by MgO. The light olefin selectivity of 5-Na/MgO reached 91.7% at 660 °C and there was almost a positive correlation between the light olefin selectivity of the three catalysts and the reaction temperature. In conclusion, the catalytic cracking of propane using the 5-Na/MgO catalyst produced mainly a large number of light olefins and a small number of other products. Meanwhile, the performance of the 5-Na/MgO catalyst in producing light olefins was more stable than that of the other catalysts in terms of temperature change, and the product distribution showed less sensitivity to temperature.
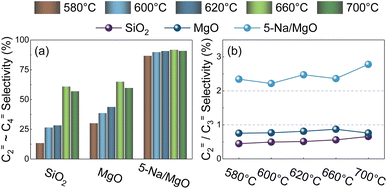 | ||
| Fig. 9 Products analysis for the catalysts at different temperatures: (a) summation of C2= ∼ C4= (light olefin) selectivity, (b) C2H4 selectivity/C3H6 selectivity. | ||
The higher selectivity for ethylene than for propylene is a feature of thermal cracking and base-catalyzed processes.53–56 Therefore, C2H4 selectivity/C3H6 selectivity was defined to probe the product properties of base catalysis. The C2H4 selectivity/C3H6 selectivity for various catalysts at different reaction temperatures is shown in Fig. 9(b). It can be seen that the ratio was relatively stable over the three types of catalyst, and it was consistently lower than 1 over SiO2 and MgO and consistently higher than 2 over 5-Na/MgO.
The thermal cracking process of propane does not yield a product distribution consistent with the free radical mechanism in the temperature range of 580–700 °C in this paper, and its C2H4 selectivity/C3H6 selectivity is also less than 1. Although this ratio increases slowly with rising temperature on SiO2, the ratio is only equal to that of MgO when the reaction temperature increases to 700 °C. According to the product distribution on SiO2 shown in Fig. 8, it could be seen that with the increase in reaction temperature, the selectivities for H2 and C3H6 change with the same trend, while the CH4 and C2H4 change with another trend. The selectivity for C3H6 is significantly higher than for the other products. Therefore, a possible explanation is provided by the following: small alkane molecules such as propane molecules are thermodynamically more stable than long-chain alkanes, resulting in a higher activation energy for propane cracking, suggesting that there is a higher incidence of primary scission of propane molecules over SiO2 in the reaction temperature range of 580–700 °C. The propane molecule generates methyl and ethyl radicals mainly by C–C bond breaking via a free radical mechanism, and these two radicals could not be further cracked by β-scission. Propylene could be produced only by dehydrogenation of propane or by a subsequent reaction based on the cracking of propane to generate a small amount of hydrogen radicals and propyl radicals, while ethylene would be even less available as the product of the subsequent reaction. This is reflected in the lower conversion, as shown in Fig. 7, which in turn affects the product distribution. Currently, the operating temperatures of commonly used thermal cracking processes would typically be ≥800 °C, and since the initiation of free radicals is known to be a rate-controlling step in the free radical reaction, the above results might also be attributed to the low reaction temperature used in this work.4,5,24 The MgO catalysts with lower basic strength than 5-Na/MgO had the second highest C2H4 selectivity/C3H6 selectivity ratio, which remained stable at around 0.8. It is hypothesized that the fact that MgO did not exhibit typical base-catalytic features might be attributed to the weaker base strength. In particular, the C2H4 selectivity/C3H6 selectivity ratio on 5-Na/MgO was stable at greater than 2 with a slowly increasing trend. Meanwhile, 5-Na/MgO provided the highest light olefin selectivity, suggesting that these catalysts were beneficial for the generation of low-carbon olefins and could potentially undergo fewer hydrogen-transfer reactions and condensation reactions, which could significantly facilitate the generation of C2H4 and provide a completely different reaction pathway for the catalytic cracking of propane.
In summary, by evaluating the performance of the series of catalysts at different reaction temperatures, the significant variation in product distribution reflected the difference in the reaction mechanisms on the neutral and base catalysts. The product distribution of the 5-Na/MgO catalyst was obviously better than that of the other catalysts, and the product distribution was relatively stable at different reaction temperatures, suggesting that the catalytic process of 5-Na/MgO may follow a new mechanism that may be insensitive to temperature and significantly different from the thermal cracking process.
3.3 Effect of Na content on basicity and catalytic properties
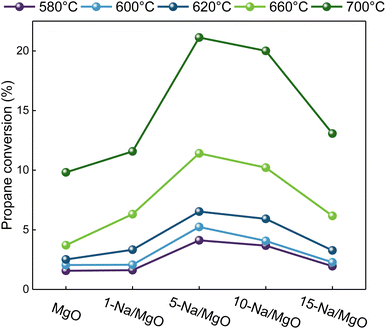
To investigate the effect of Na content on the catalytic properties, Na-loaded MgO samples with different loading amounts were tested for the propane cracking reaction at different temperatures. The propane conversion curves of NaNO3-loaded samples at a series of reaction temperatures are shown in Fig. 10. As can be seen from Fig. 10, the conversion of all Na/MgO samples increased to a certain extent with the increase in reaction temperature, which is consistent with the realization that molecular cracking is a heat-absorbing reaction. Meanwhile, the propane conversion of Na/MgO samples at a series of reaction temperatures all showed a tendency to increase and then decrease with an increase in Na loading amount, with almost identical trends, and the 5-Na/MgO sample provided the optimal reaction activity amongst all of them. It is noteworthy that, although the catalytic performance of the samples decreased with an increase in loading after the loading amount exceeded 5%, they were all better than those of the samples without Na loading. This suggests that such a change in propane conversion may not be related directly to the change in the coverage of the surface or in the number of basic sites (like Na2O), but is more likely to be related to the chemical and electrical environments of the active sites provided by the NaNO3 loading on MgO.39In order to investigate the basic properties of the Na/MgO samples, the series of catalysts prepared by NaNO3 impregnation were characterized for CO2-TPD, and the results of the characterization are shown in Fig. S4.† It can clearly be seen that with the increase in Na loading, the Na/MgO sample started to show obvious high-temperature desorption peaks of CO2, which corresponded to the strong base sites. Upon further increasing the NaNO3 loading amount, the peak temperature of the high-temperature desorption peaks started to shift towards a higher temperature, which indicated the positive correlation between the NaNO3 loading amount and the basicity strength. It is noteworthy that the Na/MgO samples showed fluctuations in the relationship between the area of their high-temperature desorption peaks and the loading amount of NaNO3, with the areas of the high-temperature desorption peaks (labelled (1), (2), and (3) in the figure, respectively) on 5-Na/MgO, 10-Na/MgO, and 15-Na/MgO being 285.70, 281.58, and 191.72, respectively, and the 15-Na/MgO sample also showed a CO2 desorption peak corresponding to medium-strong base sites in the temperature range of 500–550 °C. Thus, there were no strong base sites on the MgO sample and the 1-Na/MgO sample; the 5-Na/MgO sample and the 10-Na/MgO sample have similar amounts of strong base sites; whereas the quantity of sites corresponding to a strong base on the 15-Na/MgO sample had decreased. Thus, the increase in NaNO3 loading amount is able to provide more strongly basic sites within a certain limit. The amount of strong base sites will decrease if this limit is exceeded, and some of the strong base sites may be converted to medium-strong base sites.
In summary, in order to investigate the effect of different types of catalyst on the propane cracking performance and reaction mechanism, Na/MgO samples were chosen for comparison with MgO and a subsequent DFT calculation study.
3.4 Pathway of propane to light olefins via catalytic cracking
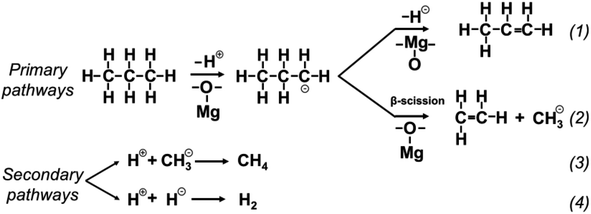
Depending on the reaction temperature and catalyst, the mechanism of generation of light olefins from propane might change to a greater or lesser extent, which could be reflected in the product distribution. As mentioned above, Na/MgO catalysts demonstrated particular advantages when used in the catalytic cracking reaction of propane, not only in terms of improved conversion, but also in terms of a more reasonable product distribution. Therefore, the following reaction pathway for Na/MgO-catalyzed propane cracking was proposed based on the distribution features of the products at different temperatures, as shown in Scheme 1. Path (2) was the dominant path for the Na/MgO catalyst, and this path accounted for the largest portion of the catalytic cracking of propane, which in turn produced a large amount of ethylene. A smaller amount of propylene was generated through path (1). The process described above is the primary path of the propane catalytic cracking reaction, and the advantage of the Na/MgO catalyst might be reflected in path (2) with a lower activation energy barrier, and the ratio of these two paths directly determined the final catalytic performance. Subsequent reduction of the carbanions proceeded via paths (3) and (4) to produce less H2 and CH4. The compounds of C4 both had low selectivity over the catalysts and were therefore not considered the main reaction. It should be noted that there should be more reaction paths in the secondary reaction rather than being limited to those listed in the figure, which yielded further small amounts of other products with a minimal fraction in the reaction process. Therefore, in order to verify the feasibility and reasonability of the proposed reaction pathways, the charge distribution on the surface of the solid base catalysts and their paths catalyzing the cracking of propane molecules were calculated.3.5 The effect of catalyst surface on reaction performance
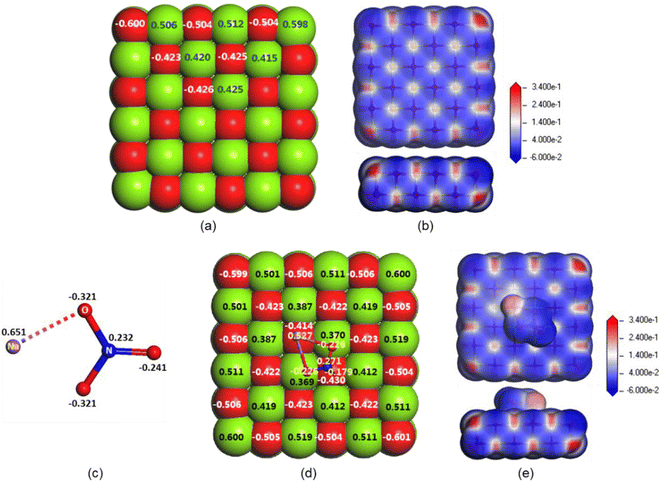
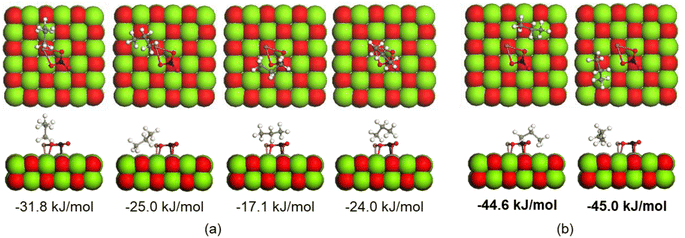
Clarification of the catalytic mechanism plays an important role in the regulation of the catalytic reaction process. The mainstream view of the catalytic cracking mechanism of hydrocarbon molecules in the base-catalyzed process includes the free radical mechanism or the carbanion mechanism, but awareness of these two mechanisms was still ambiguous.53–56 In order to investigate the surface properties of solid base catalysts, the electronic structure of propane, and the effect of solid base catalysts on the distribution of hydrocarbon catalytic cracking products, the charge distribution on the surface of solid base catalysts and their pathways of catalytic cracking of propane were investigated in this study using density functional theory (DFT).As mentioned above, the presence of NaNO3 on the catalyst surface changed the charge distribution, making it easier for propane molecules to adsorb on the MgO surface, thus facilitating the catalytic cracking reaction of propane. The adsorption energy of propane molecules was analyzed in order to study the states of propane molecules after adsorption on the Na/MgO surface. The top view, side view and adsorption energy values of the propane molecules in different adsorption conformations when adsorbed on NaNO3 or on MgO adjacent to NaNO3 are shown in Fig. 12. The adsorption energy of propane molecules adsorbed on NaNO3 on Na/MgO was −17.1 to −31.8 kJ mol−1, while the adsorption energy of propane molecules adsorbed on the MgO surface adjacent to NaNO3 was −44.6 to −45.0 kJ mol−1. Based on the results of adsorption energy calculations, it can be concluded that propane molecules preferred to adsorb on the MgO surface adjacent to NaNO3 rather than tending to adsorb on NaNO3 when approaching the surface of Na/MgO. Meanwhile, the introduction of NaNO3 made the propane molecules more likely to adsorb on the MgO surface to facilitate the catalytic cracking reaction of propane. In addition, Matsuhashi et al. studied a series of solid base catalysts and concluded that the inductive effect resulting from electrons released from alkali metals being attracted to oxygen vacancies promoted basic catalytic activity, rather than Na+ or K+ species.58 Combined with analysis of the calculations, the catalytic cracking for propane on Na/MgO still proceeded on the surface of MgO rather than on NaNO3.
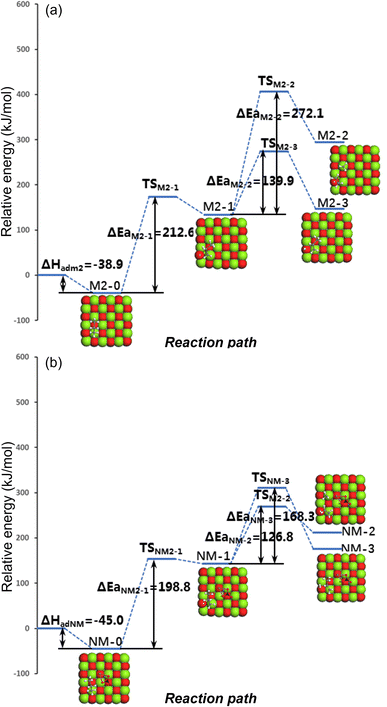
The changes in system energy for the reaction processes (as shown in the reaction path in Fig. 13) on both MgO and Na/MgO catalysts are shown in Fig. 14. In propane adsorption in the first step of the reaction (M2-0 and NM-0 in Fig. 14), Na/MgO could provide a lower adsorption energy for the adsorption of propane molecules compared to MgO, which makes the propane molecules more easily activated for the next step of the reaction. In the second step of the reaction, the energy barriers for the hydrogen proton capture reactions of the lattice oxygens of MgO and Na/MgO (M2-1 and NM-1 in Fig. 14) proceeded with 212.6 kJ mol−1 and 198.8 kJ mol−1, respectively, suggesting that the introduction of NaNO3 made it easier to break the terminal C–H bond of the propane molecule and produce the propyl-carbanion. The improved conversion of Na/MgO compared to MgO in the results of the catalyst evaluation in Section 2 provided support for this view. It is noteworthy that the reaction energy barriers of the reaction pathways RM2-2 and RM2-3 on MgO were 272.1 kJ mol−1 and 139.9 kJ mol−1, respectively, when the propyl-carbanion proceeded to the next step of the reaction. The pathways RM2-2 or RM2-3 corresponded to the production of ethylene or propylene and hydrogen, respectively. Therefore, the cracking of propyl-carbanions on MgO was more favorable for the production of propylene and hydrogen rather than ethylene via β-scission, and this conclusion was confirmed by the results of the catalytic performance of MgO. Unlike MgO, the reaction energy barriers for the reaction paths RNM-2 and RNM-3 on Na/MgO were 126.8 kJ mol−1 and 168.3 kJ mol−1, respectively, whereas paths RNM-2 and RNM-3 corresponded to the production of ethylene and propylene, respectively. Therefore, it was easier to generate ethylene via β-scission of the propyl-carbanion over Na/MgO. From the catalytic performances of Na/MgO and MgO, it could be concluded that the introduction of NaNO3 to MgO increased the selectivity ratio of C2H4 to C3H6 from about 0.8 to about 2.3, and about 90% of the total light olefin selectivity was obtained, which confirmed the conclusions of the reaction pathway drawn through simulations.
4. Conclusions
In this work, the cracking of propane molecules via a thermal cracking process, a base-catalyzed process, and a strong-base-catalyzed process were studied by means of catalyst characterization and evaluation of catalyst performance. Then, a series of samples with different Na contents were analyzed during the propane cracking reaction at different temperatures. Subsequently, density functional theory (DFT) simulations were performed for the MgO and Na/MgO catalysts. An analysis of the structure–activity relationship between catalyst and reaction performance and the mechanism of catalytic cracking of propane by the base-catalyzed process led to the following conclusions: the basic strength of the samples increased slightly with the rise in Na content, but the trend in the quantity of strong base sites did not follow the trend of the Na-loading amount. Moreover, the conversion rates of the samples showed a “volcano” distribution with increasing Na content, indicating that the active sites of propane cracking were not only limited to the base sites (Na2O), but could be found on generated composite basic active centers. The favored active sites for propane cracking to light olefins are the superbase sites, which show better cracking performance and product distribution, as evidenced by the significant improvement in propane conversion and light olefin selectivity with the introduction of stronger base sites. The introduction of NaNO3 could alter the charge distribution condition of the catalyst, introducing a different active site for the MgO surface through charge transfer, which was generated from the interaction between NaNO3 and MgO and reflected in the obvious enhancement of the base strength and the significant difference in the reaction routes. 5-Na/MgO generates a different reaction mechanism in the reaction process from MgO and SiO2, which reduces the energy barriers of the reaction as well as the activation energy of the adsorption process of propane molecules and the activation energy of β-scission under the carbanion mechanism, which in turn improves the selectivity for ethylene to inhibit the generation of such unwelcome processes, e.g., the production of H2 and CH4, and condensation reactions.Conflicts of interest
There are no conflicts to declare.Acknowledgements
This work is financially supported by the National Key Research and Development Program of China (grant number 2022YFB3504000) and the Contract Projects of China Petroleum & Chemical Corporation (SINOPEC Corp.) [grant number 123031].Notes and references
- T. Ren, M. Patel and K. Blok, Energy, 2006, 31, 425–451 CrossRef CAS.
- Z. Li, H. Wang, G. Huang, W. Ren, B. Zhang and S. Wei, Chem. Ind. Eng. Prog., 2017, 36, 767–773 Search PubMed.
- A. Akah, J. Williams and M. Ghrami, Catal. Surv. Asia, 2019, 23, 265–276 CrossRef CAS.
- H. Wang, Chem. Ind. Eng. Prog., 2020, 39, 4401–4407 CAS.
- A. Akah and M. Al-Ghrami, Appl. Petrochem. Res., 2015, 5, 377–392 CrossRef CAS.
- A. Tanimu, G. Tanimu, H. Alasiri and A. Aitani, Energy Fuels, 2022, 36, 5152–5166 CrossRef CAS.
- M. A. Alabdullah, A. R. Gomez, J. Vittenet, A. Bendjeriou-Sedjerari, W. Xu, I. A. Abba and J. Gascon, ACS Catal., 2020, 10, 8131–8140 CrossRef CAS.
- S. M. Sadrameli, Fuel, 2016, 173, 285–297 CrossRef CAS.
- L. Li, J. Gao, C. Xu and X. Meng, Chem. Eng. J., 2006, 116, 155–161 CrossRef CAS.
- S. M. Jeong, J. H. Chae, J. Kang, S. H. Lee and W. Lee, Catal. Today, 2002, 74, 257–264 CrossRef CAS.
- A. Corma, E. Corresa, Y. Mathieu, L. Sauvanaud, S. Al-Bogami, M. S. Al-Ghrami and A. Bourane, Catal. Sci. Technol., 2017, 7, 12–46 RSC.
- X. Meng, C. Xu, J. Gao and L. Li, Appl. Catal., A, 2005, 294, 168–176 CrossRef CAS.
- W. Rongbin, Acta Pet. Sin., 2021, 37, 384 Search PubMed.
- R. Pujro, M. Falco and U. Sedran, J. Chem. Technol. Biotechnol., 2016, 91, 336–345 CrossRef CAS.
- Y. Ono and H. Hattori, Solid Base Catalysis, Springer Science & Business Media, Germany, 2012 Search PubMed.
- T. Wei, M. H. Wang, W. Wei, Y. H. Sun and B. Zhong, Chem.–Eur. J., 2002, 65, 594–600 CAS.
- X. Z. Li and Q. Jiang, Low Carbon Chem. Chem. Eng., 2005, 30, 42–48 CAS.
- V. Verdoliva, M. Saviano and S. De Luca, Catalysts, 2019, 9, 248 CrossRef.
- X. Gong, M. Caglayan, Y. Ye, K. Liu, J. Gascon and A. Dutta Chowdhury, Chem. Rev., 2022, 122, 14275–14345 CrossRef CAS PubMed.
- M. Boronat, M. J. Climent, P. Concepción, U. Díaz, H. García, S. Iborra, A. Leyva-Pérez, L. Liu, A. Martínez and C. Martinez, ACS Catal., 2022, 12, 7054–7123 CrossRef CAS.
- A. Munyentwali, H. Li and Q. Yang, Appl. Catal., A, 2022, 633, 118525 CrossRef CAS.
- P. Gupta and S. Paul, Catal. Today, 2014, 236, 153–170 CrossRef CAS.
- C. Boyadjian, L. Lefferts and K. Seshan, Appl. Catal., A, 2010, 372, 167–174 CrossRef CAS.
- B. Basu and D. Kunzru, Ind. Eng. Chem. Res., 1992, 31, 146–155 CrossRef CAS.
- R. Tang, Y. Tian, G. Leng and Y. Qiao, Acta Pet. Sin., 2016, 32, 486–492 CAS.
- Y. Zhang, D. Yu, W. Li, Y. Wang, S. Gao and G. Xu, Ind. Eng. Chem. Res., 2012, 51, 15032–15040 CrossRef CAS.
- M. S. Gao, G. H. Zhang, L. Zhao, J. S. Gao and C. M. Xu, Ind. Eng. Chem. Res., 2023, 62, 1215–1226 CrossRef CAS.
- M. L. Kaliya and S. B. Kogan, Catal. Today, 2005, 106, 95–98 CrossRef CAS.
- S. M. Jeong, J. H. Chae and W. H. Lee, Ind. Eng. Chem. Res., 2001, 40, 6081–6086 CrossRef CAS.
- N. Niwamanya, J. Zhang, C. Gao, D. T. Sekyere, A. Barigye, J. Nangendo and Y. Tian, Fuel, 2022, 328, 125285 CrossRef CAS.
- R. Y. Tang, Y. Y. Tian, J. L. Cai and Y. Y. Qiao, Chem. Eng. Oil Gas, 2015, 44, 23–27 CAS.
- R. Y. Tang, Y. Y. Tian, Y. Y. Qiao, G. M. Zhao and H. F. Zhou, Energy Fuels, 2016, 30, 8855–8862 CrossRef CAS.
- Y. Y. Tian, Y. J. Che, M. S. Chen, W. Feng, J. H. Zhang and Y. Y. Qiao, Energy Fuels, 2019, 33, 7297–7304 CrossRef CAS.
- R. Y. Tang, M. Yuan, K. Liu, H. F. Li, J. T. Zhang and Y. Y. Tian, J. Energy Inst., 2019, 92, 1936–1943 CrossRef CAS.
- Q. Wu, Fuel, 2023, 332, 126132 CrossRef CAS.
- W. Xie and H. Li, J. Mol. Catal. A: Chem., 2006, 255, 1–9 CrossRef CAS.
- C. Morterra and G. Magnacca, Catal. Today, 1996, 27, 497–532 CrossRef CAS.
- J. Take, N. Kikuchi and Y. Yoneda, J. Catal., 1971, 21, 164–170 CrossRef CAS.
- A. Z. Khan and E. Ruckenstein, J. Catal., 1993, 143, 1–21 CrossRef CAS.
- E. S. Freeman, J. Phys. Chem., 1956, 60, 1487–1493 CrossRef CAS.
- B. D. Bond and P. Jacobs, J. Chem. Soc. A, 1966, 1265–1268 RSC.
- K. H. Stern, J. Phys. Chem. Ref. Data, 1972, 1, 747–772 CrossRef.
- C. D. Wagner, Faraday Discuss. Chem. Soc., 1975, 60, 291–300 RSC.
- A. Barrie and F. J. Street, J. Electron Spectrosc. Relat. Phenom., 1975, 7, 1–31 CrossRef CAS.
- J. Weitkamp, M. Hunger and U. Rymsa, Microporous Mesoporous Mater., 2001, 48, 255–270 CrossRef CAS.
- K. Higuchi, M. Onaka and Y. Izumi, Bull. Chem. Soc. Jpn., 1993, 66, 2016–2032 CrossRef CAS.
- K. Tanabe, M. Misono, Y. Ono and H. Hattori, in New Solid Acids and Bases, Kodansha/Elsevier, Japan, 1989, ch. 2, p. 5 Search PubMed.
- H. Abimanyu, C. S. Kim, B. S. Ahn and K. S. Yoo, Catal. Lett., 2007, 118, 30–35 CrossRef CAS.
- Y. L. Wei, Y. M. Wang, J. H. Zhu and Z. Y. Wu, Adv. Mater., 2003, 15, 1943–1945 CrossRef CAS.
- L. Sun, X. Liu and H. Zhou, Chem. Soc. Rev., 2015, 44, 5092–5147 RSC.
- H. Matsuhashi and K. Arata, J. Phys. Chem., 1995, 99, 11178–11181 CrossRef CAS.
- J. H. Song, P. Chen, S. H. Kim, G. A. Somorjai, R. J. Gartside and F. M. Dautzenberg, J. Mol. Catal. A: Chem., 2002, 184, 197–202 CrossRef CAS.
- L. Meijia, W. Gang, Z. Zhongdong and T. Aizhen, J. Fuel Chem. Technol., 2021, 49, 104–112 Search PubMed.
- L. Fan, Y. Zhang, S. Liu, N. Zhou, P. Chen, Y. Liu, Y. Wang, P. Peng, Y. Cheng and M. Addy, Energy Convers. Manage., 2017, 149, 432–441 CrossRef CAS.
- J. Lai, Y. Meng, Y. Yan, E. Lester, T. Wu and C. H. Pang, Korean J. Chem. Eng., 2021, 38, 2235–2246 CrossRef CAS PubMed.
- O. S. Woo, N. Ayala and L. J. Broadbelt, Catal. Today, 2000, 55, 161–171 CrossRef CAS.
- E. Giamello, A. Ferrero, S. Coluccia and A. Zecchina, J. Phys. Chem., 1991, 95, 9385–9391 CrossRef CAS.
- H. Matsuhashi, M. Oikawa and K. Arata, Langmuir, 2000, 16, 8201–8205 CrossRef CAS.
Footnotes |
| † Electronic supplementary information (ESI) available. See DOI: https://doi.org/10.1039/d4ra00878b |
| ‡ These three authors contribute equally to this work. |
| This journal is © The Royal Society of Chemistry 2024 |


