 Open Access Article
Effect of calcination temperature induced structural modifications on the photocatalytic efficacy of Fe2O3–ZrO2 nanostructures: mechanochemical synthesis
Maqsoom Zaina,
Khawaja Ansar Yasin*a,
Sirajul Haq *a,
Wajid Rehman
 b,
Salah Ud Dina,
Shafia Shujaata,
Asad Syed
 c,
M. Khalid Hossain
 d,
Bilal Ahamad Paraye,
Jamoliddin Razzokovfgh and
Abdus Samadi
aDepartment of Chemistry, University of Azad Jammu and Kashmir, Muzaffarabad 13100, Pakistan. E-mail: cii_raj@yahoo.com
bDepartment of Chemistry, Hazara University, Mansehra, Pakistan
cDepartment of Botany and Microbiology, College of Science, King Saud University, P. O. 2455, Riyadh 11451, Saudi Arabia
dInstitute of Electronics, Atomic Energy Research Establishment, Bangladesh Atomic Energy Commission, Dhaka 1349, Bangladesh
eDepartment of Zoology, College of Science, King Saud University, PO Box 2455, Riyadh, 11451, Saudi Arabia
fInstitute of Fundamental and Applied Research, National Research University TIIAME, Kori Niyoziy 39, 100000 Tashkent, Uzbekistan
gR&D Center, New Uzbekistan University, Movarounnahr Street 1, Tashkent 100007, Uzbekistan
hDepartment of Mechanical Engineering, Tashkent State Technical University, Tashkent 100095, Uzbekistan
iSchool of Material Science and Engineering, Nanjing Tech University, P. R. China
First published on 8th May 2024
Abstract
Water contamination due to organic pollutants is a challenging issue around the globe, and several attempts have been made to deal with this issue. Out of which, the semiconductor-based photocatalytic process had gained much attention and proved to be an efficient, easy, and economical process for the removal of organic dyes from aqueous solutions. For this purpose, the iron oxide–zirconium dioxide nanocomposite (Fe2O3–ZrO2 NC) was prepared via a simple mechanochemical process using a mortar and pestle, followed by a calcination process at 300, 600, and 900 °C. Different physicochemical analyses were carried out in order to investigate the successful synthesis of Fe2O3–ZrO2 NC and the effect of temperature on the crystallinity, surface area, pore size, phase composition, sample morphology, and particle/crystallite size. The Fe2O3–ZrO2 NCs were subjected to a photocatalytic test under solar light irradiation against fluorescein dye in an aqueous medium, and the photocatalytic performance was examined under the influence of calcination temperatures, pH, catalyst dose, and initial concentration. The stability of the Fe2O3–ZrO2 NCs was also checked by recycling them for five reuse cycles.
1. Introduction
The occurrence of environmental pollution is marked by harm to natural elements due to the presence of detrimental synthetic substances. These substances have the potential to disturb ecosystem balance and pose diverse health risks to both animals and humans. Environmental pollution is triggered by the introduction of harmful materials, such as gaseous pollutants, toxic metals, and particulate matter (PM) into the atmosphere; sewage, industrial effluents, agricultural runoffs, and electronic wastes into water bodies; and activities such as mining, deforestation, landfills, and illegal dumping of refuse that cause soil pollution.1 Nowadays, water pollution has emerged as a widespread global issue.2 Organic dyes present an environmental challenge for aquatic ecosystems.3 The principal diseases linked to water pollution are acute and chronic gastrointestinal diseases, most importantly diarrheal diseases (70% of deaths attributed to water pollution), typhoid fever (8%), paratyphoid fever (20%), and lower respiratory tract infections (2%).4 Fluorescein (C20H12O5) is an organic dye with low solubility in both water and other organic solvents. When dissolved, it exhibits strong fluorescence under UV light. This dye is employed in various applications such as fluid tracing, marker highlighting, fluorescent toys, and leakage detection. The toxicity of fluorescein presents a significant danger, often resulting in anaphylaxis marked by symptoms such as hypotension, tachycardia, bronchospasm, hives, and itching.5Water containing organic dyes poses various health risks, depending on dye properties and concentrations. Potential effects include toxicity; carcinogenicity, allergic reactions, endocrine disruption, headaches, and dizziness. Numerous techniques have been identified for eliminating organic dyes from wastewater. These methods encompass equalization, sedimentation, and various biological approaches such as bacteria-assisted, algae-assisted, fungi-assisted, yeast-assisted, and enzyme-assisted biodegradations. Additionally, chemical processes, including advanced oxidation processes (AOPs), coagulation–flocculation, and electrochemical treatments like electrocoagulation (EC), electro-fenton (EF), and anodic oxidation (AO), are employed. Physical processes, such as adsorption, membrane filtration, microfiltration (MF), ultrafiltration (UF), nanofiltration (NF), reverse osmosis (RO), ion exchange, and hybrid treatments like PMR and MBR hybrid technologies, are also utilized for this purpose.6 Various methods exist for removing organic dyes from wastewater but these treatment approaches may encounter inefficiencies at times, attributed to the varied spectrum of dyes, high costs, significant sludge production, slow reaction rates, and inherent self-decomposition.7
Transition metal oxide nanoparticles as semiconductors exhibit notable characteristics, such as heightened chemical stability, environmentally friendly properties, a diverse range of band gap energies, efficient catalytic activity, and a significant surface area.8 These features render them suitable for applications in heterogeneous photocatalysis.9 The hematite (Fe2O3) possess a band gap of 2.1–2.2 eV.10 Zirconium oxide (ZrO2) has band gap in the 5–7 eV range.11 ZrO2 holds significant importance as an oxide and has found widespread application in heterogeneous catalytic reactions.12 Zirconia finds extensive applications in various fields, including bio-sensors, solid oxide fuel cells, oxygen sensors, and materials for storing H2 gas.13 Iron oxide nanoparticles play a significant role in diverse applications, including magnetic and electrochemical applications, gas sensing, energy storage, cancer therapy, magnetic storage, and biomedical treatments.10 The Fe2O3–ZrO2 NC had attracted significant interest due to their synergistic properties.14 The Fe2O3 offer high electrical conductivity and photocatalytic activity, while ZrO2 contribute excellent thermal stability, chemical resistance, and oxygen storage capacity. When combined at the nanoscale, these composites can exhibit enhanced electrical conductivity, improved photocatalytic performance for pollutant degradation or hydrogen generation, and potentially tunable magnetic properties.8 Consequently, they have been fabricated employing various methods. IUPAC has recognized mechanochemistry as one of the ten technologies that can change the world.15 Mechanochemistry provides direct reaction pathways and technologies that are solvent-free and operate at low temperatures.16 Recently, there has been significant interest in utilizing mechanochemical synthesis to facilitate the production of technologically essential complex oxides.
This investigation was designed to fabricate a Fe2O3–ZrO2 nanocomposite through a straightforward mechanochemical process using a mortar and pestle, followed by calcination at various temperatures for the resulting product. The impact of calcination temperature on structural changes was analyzed using XRD, SEM, EDX, FTIR, DRS and N2 adsorption techniques. Subsequently, the Fe2O3–ZrO2 samples were employed as photocatalysts for degrading fluorescein, and the impact of calcination temperature, initial dye concentration, catalyst dose and pH was investigated.
2. Materials and methods
2.1 Reagents
To synthesize Fe2O3–ZrO2 NCs through mechanochemical means, iron(II) hydroxide and zirconium(IV) hydroxide were utilized. These chemicals of general-purpose grade were obtained from Fisher Scientific. The hydroxides were ground with a mortar and pestle to produce the necessary metal oxides. Distilled water was employed to clean the mortar and pestle and was also used as solvent for the preparation of Fluorescein solutions.2.2 Synthesis of Fe2O3–ZrO2 NCs
Initially, an equal amount (1 g) of each metal hydroxide precursor was taken and ground using a mortar and pestle following standard procedures. The grinding process continued for six hours, during which all physical transformations were closely observed. The initial product exhibited a granular appearance, and with extended grinding time, it transitioned into a powdered form. Three hours into the process, the sample developed a sticky consistency, which was attributed to the breakdown of hydroxide bonds and the presence of moisture. As the six-hour mark approached, the product transitioned back into a powdered form, accompanied by the formation of metal oxides.17 The resulting powder was then stored in a tightly sealed sample bottle. The experiment was conducted several times to gain required quantity of the sample and also to examine how the duration of grinding influenced the progression of the reaction. Physical characteristics, such as melting point and solubility, were also examined. Finally, the finished product underwent calcination in a muffle furnace at temperatures of 300, 600, and 900 °C.2.3 Instrumentation
Various physico-chemical techniques were employed to characterize the synthesized Fe2O3–ZrO2 NCs. The crystalline characteristics were evaluated using X-ray diffraction (XRD) analysis with the Philips X'Pert model. The Debye–Scherrer equation was utilized to ascertain the crystallite size of the synthesized nanostructures. A field emission scanning electron microscope (SEM), specifically the JEOL JSM-5600LV model from Tokyo, Japan was employed to investigate the microstructure and surface topology. EDX (model INCA-200 (UK)) was employed to verify the elemental composition of the sample. The N2 adsorption experiment was conducted using the Gemini instrument model 2390 t at a standard pressure of 760.00 mmHg, and the BET equation was utilized to assess the surface area and pore size distribution. UV-DRS analysis was employed to investigate the light absorbance characteristics of the samples, and the band gap energy was determined using Tauc plot. The analysis of surface functional moieties was conducted through FTIR, spanning the range of 4000 to 400 cm−1. The decrease in the λ-max of fluorescein dye during photocatalytic process was examined through UV-visible spectrophotometer (1601 SHIMADZU).2.4 Photocatalytic assay
The photocatalytic efficiency of all the samples of prepared nanocomposite i.e. Fe2O3–ZrO2, utilizing mechanochemical method, including both uncalcined and those calcined at 300, 600, and 900 °C, was assessed in the context of the photocatalytic degradation of fluorescein dye. Initially, a 15 ppm stock solution of fluorescein dye was prepared in distilled water. 100 ml of this solution was transferred into a reaction vessel, to which 25 mg of the synthesized samples were added. To achieve adsorption–desorption equilibrium, the reaction mixture was stirred in the dark for 30 min. Following exposure of the solution to simulated solar radiation for a specific duration, a thorough assessment of the sample was conducted using a double-beam spectrophotometer, and the reduction in absorbance maxima was monitored over time.3. Results and discussion
3.1 XRD analysis
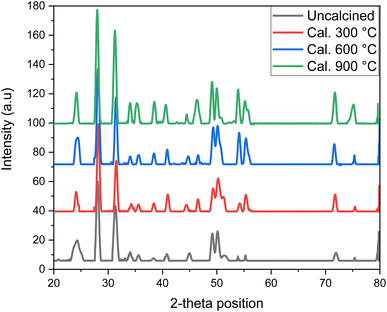
The XRD patterns displayed in Fig. 1, shows three sets of corresponding to Fe2O3, ZrO2 and Fe2O3–ZrO2. The diffraction bands appeared at 27.17, 40.54, 49.05, 53.92, 71.79 and 75.02 positions corresponding to (012), (113), (024), (116), (10 10) and (217). All these peaks are found similar to those reported in JCPDS card 01-079-1741 attributed to the rhombohedral crystal system with space group of R![[3 with combining macron]](https://www.rsc.org/images/entities/char_0033_0304.gif) c and space number of 167. The length of two a and b coordinates are same (5.0342 Å), c is equal to 13.7460 Å, the interfacial angles alpha and beta is equal to 90.00° whereas gamma is of 120.00°. The density and volume of unit cell is found to be 5.27 g cm−3 and 301.69 × 10⁶ pm3 respectively. The second set of diffraction peaks appeared at 31.24, 34.01, 35.27, 38.50, 44.46, 49.99, 53.94, and 55.18 due to the diffraction of X-ray from the hkl planes (111), (020), (002), (021), (211), (220), (221), and (300). These peaks are matched with those reported in reference card 96-900-5835 and assigned to the orthorhombic geometry of ZrO2 crystal system having space group of Pbcm and space number 57. The length of a, b and c coordinates are 5.0050, 5.2350 and 50.10 Å respectively and degree of interfacial angles alpha, beta and gamma are 90.00. The density and volume of unit cell 6.18 g cm−3 and 132.34 × 10⁶ pm3 respectively. The diffraction peaks along the hkl planes at 27.95 (111) and 46.36 (112) is assigned to the monoclinic geometry of ZrO2, which is in accordance to the reported literature.18
c and space number of 167. The length of two a and b coordinates are same (5.0342 Å), c is equal to 13.7460 Å, the interfacial angles alpha and beta is equal to 90.00° whereas gamma is of 120.00°. The density and volume of unit cell is found to be 5.27 g cm−3 and 301.69 × 10⁶ pm3 respectively. The second set of diffraction peaks appeared at 31.24, 34.01, 35.27, 38.50, 44.46, 49.99, 53.94, and 55.18 due to the diffraction of X-ray from the hkl planes (111), (020), (002), (021), (211), (220), (221), and (300). These peaks are matched with those reported in reference card 96-900-5835 and assigned to the orthorhombic geometry of ZrO2 crystal system having space group of Pbcm and space number 57. The length of a, b and c coordinates are 5.0050, 5.2350 and 50.10 Å respectively and degree of interfacial angles alpha, beta and gamma are 90.00. The density and volume of unit cell 6.18 g cm−3 and 132.34 × 10⁶ pm3 respectively. The diffraction peaks along the hkl planes at 27.95 (111) and 46.36 (112) is assigned to the monoclinic geometry of ZrO2, which is in accordance to the reported literature.18
The XRD analysis of the Fe2O3–ZrO2 NCs calcined at different temperatures reveals the influence of thermal treatment on the phase composition, crystallinity and crystallite size. With increasing calcination temperature, no new peak was emerge in the diffractogram confirmed that no phase transformation occurred. The increased intensity of the peaks suggest that the crystallinity of the sample increases and the Fe2O3–ZrO2 NC calcined at 900 °C has the highest degree of crystallinity. Therefore, the observed changes in the peaks intensities with increasing calcination temperature suggests that higher temperatures promote the formation of more ordered and stable crystalline Fe2O3–ZrO2 NC.
3.2 SEM analysis
SEM is a powerful imaging technique offering high-resolution, three-dimensional views of material surfaces in the micro- and nanoscale. Under low magnification, the SEM image of the uncalcined Fe2O3–ZrO2 NCs highlighted differences in both size and shape, revealing a rough morphology (Fig. 2(a)). Various aggregates and agglomerates with diverse morphologies were visible, some with clear boundaries. These structures, along with individual particles, were randomly dispersed, with larger spacing among them. Overall, their surfaces displayed a non-smooth appearance. After calcination at 300 °C (Fig. 2(b)), the SEM examination revealed significant variations in size and shape, emphasizing the influence of calcination temperature. There was a distinct increase in agglomeration, especially noticeable at specific points, maintaining a non-smooth surface appearance. The spacing among some agglomerates became more prominent at certain points. Following calcination at 600 °C, the SEM analysis (Fig. 2(c)) exhibited notable disparities in sizes and shapes, with a substantial increase in agglomeration. The agglomerates, with non-smooth surfaces, appeared scattered and displayed mixed morphologies. Post-calcination at 900 °C (Fig. 2(d)), pronounced agglomeration reduced spacing, presenting non-smooth surfaces with cavities visible only at few points. The resulting agglomerates showcased diverse morphologies.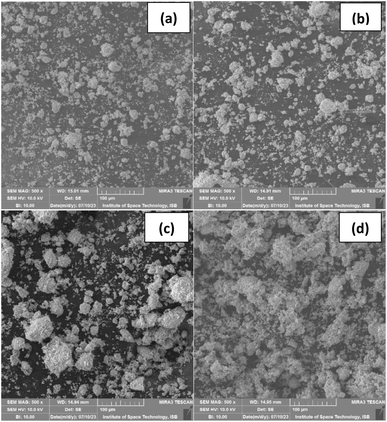 | ||
| Fig. 2 Low magnification SEM images of Fe2O3–ZrO2 NCs (uncalcined (a) and calcined at 300 (b), 600 (c) and 900 (d) °C). | ||
It was employed to explore the impact of calcination temperature on the morphology of Fe2O3–ZrO2 NCs, with results presented in Fig. 3(a–d). Under high magnification, the SEM analysis of uncalcined Fe2O3–ZrO2 NCs revealed variations in sizes and shapes, indicating a rough morphology and non-uniformity. The presence of agglomerates with diverse shapes, small dispersed particles, and irregularly placed smaller nanocomposites on larger agglomerates was observed. Despite a smooth surface, uneven distribution led to cavities. The rough morphology was attributed to variations in nucleation and growth. Calcination of Fe2O3–ZrO2 NC at 300 °C showed significant variations, increasing agglomeration, and reducing cavities due to fusion of particles and agglomerates. Larger agglomerate distribution increased, with elevated scattering of small nanocomposites. At 600 °C, pronounced agglomeration, reduced cavities, and increased scattering were noted. Calcination at 900 °C led to extensive agglomeration, fusion of particles, reduced cavities, and indistinct boundaries, presenting a smooth appearance with mixed morphologies. Along with morphological changes, calcination temperature has also effect particles size and the average size for Fe2O3–ZrO2 NCs are found to be 38.60, 42.97, 55.21 and 61.78 nm for the uncalcined, and those calcined at 300, 600 and 900 °C respectively. The heat treatment at higher temperature led to the diffusion and coalescence of the adjacent particles results into the formation of larger particles. Moreover, the elevated temperature promote the particles growth and agglomerations compared to nucleation process led to the formation of larger particles that influence the surface area and reactivity of the sample.
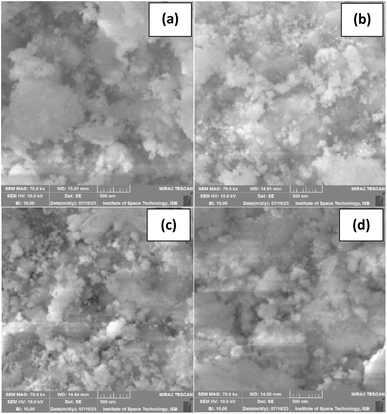 | ||
| Fig. 3 High magnification SEM images of Fe2O3–ZrO2 NCs (uncalcined (a) and calcined at 300 (b), 600 (c) and 900 (d) °C). | ||
3.3 Surface area and pore size analysis
The BET equation was applied to N2 adsorption data to examine the surface area and pore size of Fe2O3–ZrO2 NCs. The BET plots are shown in Fig. 4(a–d), and the low 1/[Q(p°/p − 1)] value in the BET plot shows that the larger quantity of N2 was adsorbed at a lower relative pressure (0.5 p/p°). A gradual decrease was seen in the adsorption of N2, with increasing relative pressure attributable to surface/pore saturation and gas–gas interaction. If we compared the BET plots for all the Fe2O3–ZrO2 samples, a significant increase occurred in the 1/[Q(p°/p − 1)] values with the increasing calcination process, which suggests a clear decrease in the adsorption of N2 into the Fe2O3–ZrO2 surface. This decrease is due to the calcination temperature-induced morphology changes that occurred in the Fe2O3–ZrO2 samples, including agglomeration, fusion of particles, and reduced pore size. The N2 adsorption isotherms of the Fe2O3–ZrO2 NCs are shown in Fig. 5, which found similar with type IV isotherm according to IUPAC classification. The type of isotherms suggest the presence of mesopores in the samples. The pore distribution plots are shown in the inset in Fig. 4 shows that the size pores decreases with increasing calcination temperature. The data listed in Table 1 which shows that the uncalcined Fe2O3–ZrO2 NC exhibits the highest surface area as compared to the calcined analogues. A gradual decrease in the surface area of the samples is seen with increasing calcination temperature, which might be due to increasing crystallite or particle sizes, agglomeration, and other morphological changes. Similarly, the pore sizes and pore volume of the Fe2O3–ZrO2 NCs are also decreased with increasing calcination temperature. The decrease in pore parameters is attributed to the agglomeration process, an increase in particle size, and the rearrangement of the particles that led to the collapse or blockage of pores.19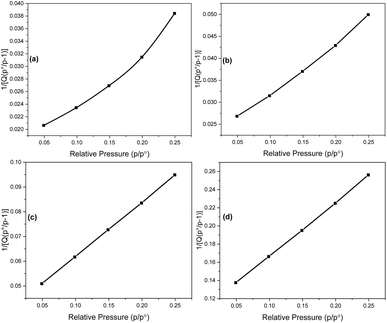 | ||
| Fig. 4 BET plots showing the adsorption of N2 on the Fe2O3–ZrO2 NCs; uncalcined (a), cal. at 300 °C (b), cal. at 600 °C (c), and cal. at 900 °C (d). | ||
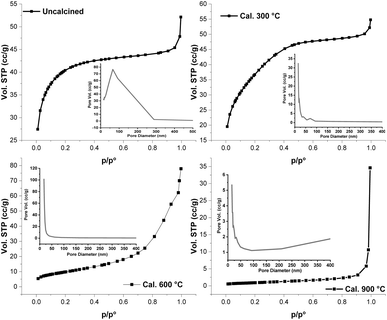 | ||
| Fig. 5 N2 adsorption of the Fe2O3–ZrO2 NCs (inset: pore size distribution); uncalcined, cal. at 300 °C, cal. at 600 °C, and cal. at 900 °C. | ||
| Samples | Texture parameters | ||
|---|---|---|---|
| SBET (m2 g−1) | Pore size (Å) | Pore volume (cm3 g−1) | |
| Uncalcined | 92 | 66.28 | 0.0377 |
| Cal. 300 °C | 64 | 17.23 | 0.0285 |
| Cal. 600 °C | 21 | 15.97 | 0.0109 |
| Cal. 900 °C | 2 | 15.17 | 0.0002 |
Surface area is one of the main factors that determines the photocatalytic efficacy of the materials, and the photocatalytic reaction occurs at the active sites that are present on the surface of the catalyst. Thus, catalysts with a higher surface area exhibit more active sites that facilitate the photocatalytic process. Furthermore, the catalyst with a larger surface area has a larger number of atoms on the surface, which enhances the absorption of incident light and results in the efficient generation of electron–hole pairs that initiate the redox process.20
3.4 DRS analysis
The light absorption phenomena of the Fe2O3–ZrO2 NCs (uncalcined and calcined at 300, 600 and 900 °C) was studied by DRS (inset: Fig. 6(a)) and all the samples shows maximum absorption in the UV region, which is a distinctive feature of many metal oxides including Fe2O3 and ZrO2 due to their specific electronic band structure. A slight red shift was observed in the absorbance edge of the samples is attribute to an increase in the crystallinity with increasing calcination temperature. As the larger particles have a lower band gap, where quantum confinement effect become less dominant as the particle size increases.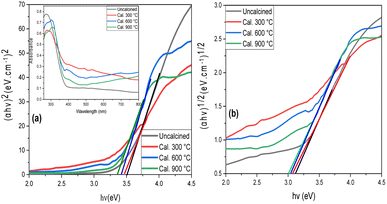 | ||
| Fig. 6 Tauc's plots for direct (a) and indirect (b) transition (inset: DRS spectra) of the Fe2O3–ZrO2 NCs both uncalcined and those calcined at different temperature. | ||
The shift toward longer wavelength may also be due to the redistribution of surface defects i.e. vacancies/interstitials within the crystal, they can also act as a charge carrier and disturbed the electronic band structures.21 This shift is attributed a decrease in the band gap energy. The band gap energies for direct (Fig. 6(a)) and indirect (Fig. 5(b)) transitions of the Fe2O3–ZrO2 NCs were determined through the eqn (1) and (2) respectively; where the α is absorption coefficient, h is plank's constant, v photon frequency, A is proportionality constant and Eg is the band gap energy.22 The calculated band gap energies are listed in Table 2, showing a gradual decreasing trend with increasing calcination. This decrease in the band gap energy is might be due to the increase in the crystallinity and particle size at elevated calcination temperature.23 The calculated band gap energies, they are found to be less than those reported previously.24 The difference in the band gap energies for both direct and indirect transitions attributed to the variation particle/crystallite size, which is in accordance with reported literature.25
| αhν = A(hν − Eg)2 | (1) |
| αhν = A(hν − Eg)1/2 | (2) |
| Band gap (eV) | Fe2O3–ZrO2 NCs | |||
|---|---|---|---|---|
| Uncalcined | Cal. 300 °C | Cal. 600 °C | Cal. 900 °C | |
| Direct band gap | 3.52 | 3.45 | 3.40 | 3.35 |
| Indirect band gap | 3.12 | 3.08 | 3.04 | 3.01 |
| Direct spectrum band gap (=1240/λ) | 3.25 | 3.19 | 3.14 | 3.10 |
3.5 EDX analysis
An EDX spectrum identifies and quantifies elements in a sample by measuring characteristic X-ray emissions, enabling elemental analysis, spatial mapping, and material characterization. For Fe2O3–ZrO2 NCs, both uncalcined and calcined at various temperatures (300, 600, and 900 °C), the EDX spectrum unveiled the elements' presence and their relative abundance in the sample (Fig. 7(a)). The signal observed at 0.2 keV indicated the existence of oxygen. This peak was probably linked to the oxide constituents present in the nanocomposites.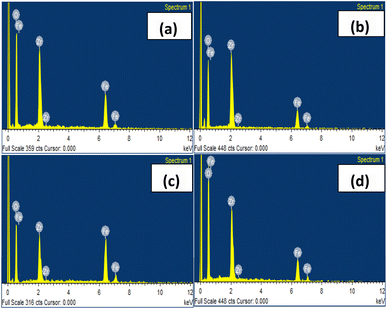 | ||
| Fig. 7 EDX spectra of the Fe2O3–ZrO2 NCs both uncalcined and those calcined at different temperature. | ||
The peaks at 0.3, 6.2, and 6.5 keV unequivocally represented characteristic X-ray signals indicative of the presence of iron whereas the peaks observed at 2 and 2.2 keV suggested the presence of zirconium. Elevating the calcination temperature induces diverse effects on the EDX spectra of Fe2O3–ZrO2. In Fig. 7(b–d). The EDX spectra revealed an increase in the peak intensities of Fe and Zr with increasing calcination temperature. This variation in peak intensities for the same elements can be ascribed to multiple factors, including sample inhomogeneity, variations in sample preparation, differential absorption, surface contamination, matrix effects, crystal structure changes, detector sensitivity, and beam damage. These factors collectively contribute to the complexity of the interaction between the electron beam and the sample, resulting in fluctuations in X-ray emissions and subsequent peak intensities.
Studies additionally propose that the phase composition, morphology, and properties of materials are influenced by the calcination temperature.
In the Fe2O3–ZrO2 system, solubility of Fe2O3 in the ZrO2 lattice undergoes significant changes at different calcination temperatures, exhibiting lower solubility at higher temperatures. Furthermore, calcination temperature impacts the crystalline behavior, enhancing the crystallinity of ZrO2 NPs as the temperature increases. Moreover, peak intensities of elements in EDX spectra can increase with higher calcination temperatures due to various factors, including crystallite size, phase transformation, enhanced crystallinity, coarsening of nanoparticles, and higher phase purity. Notably, different phases or crystal structures manifest distinct characteristics in terms of X-ray emissions in EDX spectra, owing to the unique atomic composition and arrangement within each phase. Each element emits specific X-rays based on energy differences between electron shells, resulting in characteristic X-ray lines in the spectra. Additionally, variations in lattice arrangements and crystal structures contribute to different diffraction patterns, influencing the shape and position of X-ray peaks in the EDX spectra. These diverse factors collectively contribute to the observed spectra.
3.6 FTIR analysis
The FTIR spectra of Fe2O3–ZrO2 NCs shown in Fig. 8, exhibits peaks aligned with specific wavenumbers (cm−1), signifying the points where the transmission of infrared radiation took place. The broad band centered at 3466 cm−1 was assigned to the stretching collision of H–O–H and hydroxyl absorption.26 Peak at 1738.71 cm−1 was attributed to the Zr–OH functional group.27 A midrange band at 1639.39 cm−1 was noted, possibly originating from the bending of H–O–H coordinated H2O molecule.28 Peak at 1379.79 cm−1 was ascribed to the presence of surface –OH groups in M–OH (either Fe(OH)2 or Zr(OH)4).26 An additional peak emerged at 1219.15 cm−1, which may also be attributed to the vibrations of M–OH (either Fe(OH)2 or Zr(OH)4).29 A weak band emerged at 1091.10 cm−1 possibly arising due to terminal metal hydroxide(s).30 Peak at 1034.47 cm−1 might also has happened due to the different modes of bending vibration of the M–O bond (either Fe–O or Zr–O).31 At 912.17 cm−1, a sharp peak was identified as the result of O–M–O vibrations (can be Fe–O–Fe, Fe–O–Zr, or Zr–O–Zr).32 A midrange band at 732.42 cm−1 occurred due to the Zr–O–Zr asymmetric stretching modes.33 A sharp band was obvious at 534.61 cm−1 due to the Fe–O functional group.27 These peaks consistently appeared within the identical range throughout the spectra of all samples. For the samples that were calcined at 300, 600, and 900 °C, there was a progressive decline in the strength of the band in the 3466 cm−1 range. In the calcined samples, there was a noticeable drop in the band's strength in the 1738.71 cm−1 range suggest the condensation of Zr(OH)2 to ZrO2. In the 1639.39 cm−1 range, the peaks showed the same decline. A sharp drop was seen in the intensities of the peaks at 1639.39 cm−1 and 1379.79 cm−1 also suggest the dehydration of the samples at elevated temperature. The increase/decrease along with a minor shift in the intensity of the bands at 1219.15 cm−1, 1091.10 cm−1, 1034.47 cm−1, 912.17 cm−1, and 732.42 cm−1 attributed to the calcination temperature promoted rearrangement of the unit cell in the crystal structure.24 The band at 534.61 cm−1 seemed to begin merging together in calcined samples; this merging effect became more noticeable at higher calcination temperatures, when it began to transform into a broad band. The reduction happened as a result of a condensation reaction that evaporated water molecules and turned metal hydroxides into metal oxides.34,35 It was also ascribed to the generation of metal oxides and the increasing concentration of metal oxides, the intensity of the bands in this region was on the rise.25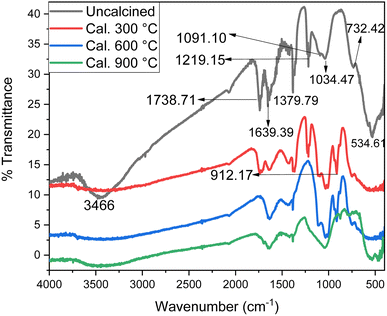 | ||
| Fig. 8 FTIR spectra of the Fe2O3–ZrO2 NCs both uncalcined and those calcined at different temperature. | ||
3.7 Photocatalytic activity
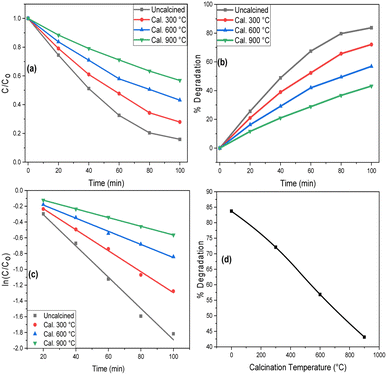
The photocatalytic efficiency of Fe2O3–ZrO2 NCs, synthesized via the mechanochemical method, was evaluated for both uncalcined samples and those exposed to different calcination temperatures against fluorescein dye. The assessment took place outdoors, amid natural sunlight, spanning June 15 to 30, and occurred between 11 a.m. and 3 p.m. The diminishing greenish-yellow hue over time signified the decolorization of the reaction mixture. Following the UV-visible analysis conducted using a double-beam spectrophotometer, there was an initial noticeable decline noted in the absorbance maxima at 475 nm. This suggested the degradation of the chromophore responsible for light absorption at that particular wavelength. The degradation profile shown in Fig. 9(a) demonstrated a gradual diminution in the absorbance maximum with the rise in calcination temperature. During the initial 20 min, especially in the uncalcined sample in comparison to those subjected to various calcination temperatures, there was a noticeable and sharp decline in the absorbance maxima. Afterward, the rate of reduction decelerated in all samples. The most significant decline in the absorbance maxima was evident in the uncalcined sample.35,36The degradation percentage of Fluorescein was computed using eqn (1),37 and the results are illustrated in Fig. 9(b) for different Fe2O3–ZrO2 NCs. This included both the uncalcined sample and samples exposed to different calcination temperatures, namely 300, 600, and 900 °C. The uncalcined sample showed a fluorescein degradation of 83.73%, whereas the samples subjected to calcination at 300, 600, and 900 °C showcased degradation percentages of 78.09%, 56.86%, and 43.13%, respectively. The most photocatalytically active prepared sample was the one that was left uncalcined, whereas the sample that was calcined at the maximum temperature i.e. 900 °C showed the lowest level of activity. The rate of the photochemical reaction was depicted by the rate constant values, which were calculated using eqn (2) and displayed in Fig. 9(c).37 The photocatalytic processes carried out in the presence of uncalcined NCs and those calcined at 300, 600, and 900 °C were found to that 0.0198, 0.0133, 0.0083, and 0.0055 quantity of dye was degraded per min, respectively, based on the obtained results. These results represented the relative photocatalytic effectiveness of each prepared sample in boosting fluorescein degradation in the specified reaction conditions.38,39
A greater rate constant denoted a faster rate of degradation, indicating increased photocatalytic activity in the Fe2O3–ZrO2 that was produced. With a value of 0.0198 per min, the uncalcined NCs showed the highest rate constant among the examined samples, according to the results. Additionally, the results suggested that uncalcined NCs might be more effective in promoting the targeted compound's degradation.
 | (3) |
 | (4) |
The process of photodegradation for fluorescein, facilitated by a Fe2O3–ZrO2 catalyst under solar light, comprises a sequence of steps orchestrated by the interplay among the catalyst, sunlight, and the dye molecule Fig. 10. The catalyst absorbs photons from solar light, initiating the formation of electron–hole pairs (e−/h+) within the catalyst material. Under these conditions, Fe2O3–ZrO2 acted as a semiconductor; photons that were absorbed raised electrons in the catalyst's valence band (VB) to the conduction band (CB), which led to the creation of electron–hole pairs. The VB of ZrO2 was where the positive holes congregated, while the VB of Fe2O3 contained the excited electrons. These charge carriers were essential to the succeeding redox processes. Water molecules reacted with photogenerated holes to form hydroxyl radicals (˙OH), whereas oxygen molecules were reduced by photogenerated electrons to become superoxide radicals (˙O2−), which then reacted with hydrogen to produce hydroxyl radicals. The highly reactive hydroxyl radicals (˙OH) attacked the adsorbed fluorescein molecules, causing the dye's chemical bonds to dissolve and the dye to mineralize into carbon dioxide and water.40
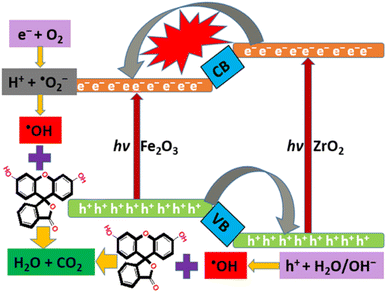 | ||
| Fig. 10 Proposed photocatalytic mechanism showing the electron–hole generation and subsequent photocatalytic reactions. | ||
3.8 Determinants of photocatalytic activity
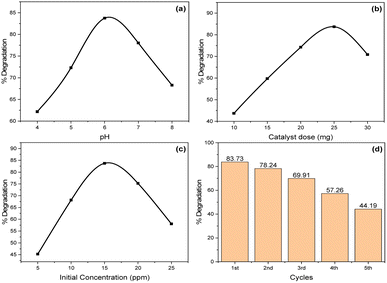
The data suggested that within an acidic environment, the forces of attraction between the dye and catalyst were conducive to the dye being adsorbed onto the surface of the photocatalysts. The inclination toward adsorption was ascribed to the dye being in an anionic form under acidic conditions, while the catalyst was in a cationic form. This fostered a significant interaction between them, ultimately resulting in the adsorption of the dye and consequently causing a higher percentage of degradation, reaching its optimum at a pH of 6. Furthermore, the surface of Fe2O3–ZrO2 was found to become negatively charged at high pH values, which resulted in repulsive forces that inhibited adsorption. In other words, when the pH of the solution was raised above 7, a large proportion of the adsorbed dye molecules were not in direct contact with the photocatalysts surface, which lowered the rates of degradation.42
The proportion of degradation decreased as the concentration of Fe2O3–ZrO2 NCs increased because their active sites were fully occupied and saturated. Increased concentrations may interfere with light-catalyst surface interaction, which could lead to reduced hydroxyl ion production and a subsequent reduction in photocatalytic degradation efficiency. Moreover, reactive radicals and the production of degradation byproducts, which rival fluorescein for the few active sites on the NC surface, may be contributing factors to this decrease.46
Due to the dye that is absorbed on the surface of the photocatalysts during the recycling process as well as the catalysts' mass loss, the degradation efficiency of the catalyst may somewhat decrease.47 Additionally, if the catalyst surface is reused, impurities from the reaction environment may collect on it and reduce its catalytic activity. A number of reasons, including agglomeration, leaching of active species, or structural changes, may cause catalyst deactivation over the course of numerous cycles, hence decreasing the number of active sites accessible for the photocatalytic reaction.48
4. Conclusions
In this study, Fe2O3–ZrO2 NCs have been prepared through a mechanochemical process, which is a method of treating solids and couples mechanical and chemical events at the molecular level. Given that this procedure is more efficient, quicker, and simpler than traditional approaches, it is a better strategy for the preparation of these NCs. The physicochemical analysis shows that the crystallinity and particle size increase with increasing calcination temperature, which leads to a clear reduction in the surface area and band gap energies of the calcined analogues. As the surface area governs the photocatalytic efficiency of the nanocatalysts, and with its decreasing trend, the photocatalytic performance of the Fe2O3–ZrO2 NCs decreased at elevated temperatures. The photocatalytic test was carried out under optimized conditions, and the results of the optimization process show that the calcination temperature, pH, catalyst dose, and initial concentration of dye have a great influence on the photocatalytic behavior of Fe2O3–ZrO2 NCs.Author contributions
Maqsoom Zain – formal analysis and writing – original draft; Khawaja Ansar Yasin – supervision, project administration; Sirajul Haq, Wajid Rehman and Salah Ud din – Conceptualization, methodology and project administration; Shafia Shujaat – visualization, and writing – original draft; Asad Syed and Bilal Ahamad Paray – software, data curation and funding acquisition; Jamoliddin Razzokov and Abdus Samad – validation and writing – review & editing; M. Khalid Hossain – writing – review & editing.Conflicts of interest
There are no conflicts to declare.Acknowledgements
The authors would like to extend their sincere appreciation to the Researchers Supporting Project Number (RSP2024R144), King Saud University, Riyadh, Saudi Arabia.References
- P. O. Ukaogo, U. Ewuzie and C. V. Onwuka, Environmental Pollution: Causes, Effects, and the Remedies, INC, 2020 Search PubMed.
- C. FN, M. MF and J. Ecosyst, Ecography, 2017, 07, 5–8 Search PubMed.
- A. Tkaczyk, K. Mitrowska and A. Posyniak, Sci. Total Environ., 2020, 717, 137222 CrossRef CAS PubMed.
- P. J. Landrigan, R. Fuller, N. J. R. Acosta, O. Adeyi, R. Arnold, N. (Nil) Basu, A. B. Baldé, R. Bertollini, S. Bose-O'Reilly, J. I. Boufford, P. N. Breysse, T. Chiles, C. Mahidol, A. M. Coll-Seck, M. L. Cropper, J. Fobil, V. Fuster, M. Greenstone, A. Haines, D. Hanrahan, D. Hunter, M. Khare, A. Krupnick, B. Lanphear, B. Lohani, K. Martin, K. V. Mathiasen, M. A. McTeer, C. J. L. Murray, J. D. Ndahimananjara, F. Perera, J. Potočnik, A. S. Preker, J. Ramesh, J. Rockström, C. Salinas, L. D. Samson, K. Sandilya, P. D. Sly, K. R. Smith, A. Steiner, R. B. Stewart, W. A. Suk, O. C. P. van Schayck, G. N. Yadama, K. Yumkella and M. Zhong, Lancet, 2018, 391, 462–512 CrossRef PubMed.
- R. N. Johnson, A. D. Fu, H. R. McDonald, J. M. Jumper, E. Ai, E. T. Cunningham and B. J. Lujan, Fluorescein Angiography: Basic Principles and Interpretation, Elsevier Inc., 5th edn, 2012, vol. 1 Search PubMed.
- S. Samsami, M. Mohamadi, M. H. Sarrafzadeh, E. R. Rene and M. Firoozbahr, Process Saf. Environ. Prot., 2020, 143, 138–163 CrossRef CAS.
- B. M. Adesanmi, H. Paul, C. Huhnke, B. M. Adesanmi, Y. Hung, H. H. Paul and C. R. Huhnke, GSC Adv. Res. Rev., 2022, 10, 126–137 CrossRef CAS.
- S. Ilahi, O. Manzoor, M. Mohsin and S. Ali, Environ. Res., 2019, 171, 328–340 CrossRef.
- M. F. Warsi, N. Shaheen, M. I. Sarwar, P. O. Agboola, I. Shakir and S. Zulfiqar, Desalin. Water Treat., 2021, 211, 181–195 CrossRef CAS.
- P. Sangaiya and R. Jayaprakash, J. Supercond. Novel Magn., 2018, 31, 3397–3413 CrossRef CAS.
- O. Meza, L. A. Diaz-torres, P. Salas, E. De Rosa and D. Solis, Mater. Sci. Eng., B, 2010, 174, 177–181 CrossRef CAS.
- O. Długosz, K. Szostak and M. Banach, Appl. Nanosci., 2020, 10, 941–954 CrossRef.
- S. Riaz, A. Nairan and S. Naseem, 2013 World Congr. Adv. Nano, Biomech. Robot. Energy Res., 2013, pp. 297–305 Search PubMed.
- S. I. Siddiqui and S. A. Chaudhry, J. Cleaner Prod., 2019, 223, 849–868 CrossRef CAS.
- T. Friščić, C. Mottillo and H. M. Titi, Angew. Chem., 2020, 132, 1030–1041 CrossRef.
- L. Takacs, Prog. Mater. Sci., 2002, 47, 355–414 CrossRef CAS.
- C. Qiu, Q. Chen, C. Chang, W. Jiang and G. Fan, Int. J. Hydrogen Energy, 2021, 46, 656–665 CrossRef CAS.
- M. Mokhtar, S. N. Basahel and T. T. Ali, J. Mater. Sci., 2013, 48, 2705–2713 CrossRef CAS.
- D. J. Kim, S. H. Hahn, S. H. Oh and E. J. Kim, Mater. Lett., 2002, 57, 355–360 CrossRef.
- C. Chan, J. Porter, Y. Li and W. Guo, J. Am. Ceram. Soc., 1999, 72, 566–572 CrossRef.
- N. G. Menon, S. Sarma and S. Mukherji, Appl. Nanosci., 2018, 8, 915–930 CrossRef CAS.
- S. B. Kulkarni, U. M. Patil, R. R. Salunkhe, S. S. Joshi and C. D. Lokhande, J. Alloys Compd., 2011, 509, 3486–3492 CrossRef CAS.
- H. Helmiyati, Y. Budiman, G. H. Abbas, F. W. Dini and M. Khalil, Heliyon, 2021, 7(3), 1–9 CrossRef.
- H. Helmiyati, N. Fitriana, M. L. Chaerani and F. W. Dini, Opt. Mater., 2022, 124, 111982 CrossRef CAS.
- S. N. Basahel, M. Mokhtar, T. T. Ali and K. Narasimharao, Catal. Today, 2020, 348, 166–176 CrossRef CAS.
- S. A. Moon, B. K. Salunke, B. Alkotaini, E. Sathiyamoorthi and B. S. Kim, IET Nanobiotechnol., 2015, 9, 220–225 CrossRef PubMed.
- R. Karimi and M. Homayoonfal, Polym. Adv. Technol., 2021, 32, 1345–1362 CrossRef CAS.
- A. Ragunathan, R. Krishnan and B. Ameen, J. Chem. Res., 2015, 39, 622–626 CrossRef CAS.
- N. C. Horti, M. D. Kamatagi, N. R. Patil, M. N. Wari and S. R. Inamdar, Optik, 2018, 169, 314–320 CrossRef CAS.
- S. Haq, S. Dildar, M. Ben Ali, A. Mezni, A. Hedfi, M. I. Shahzad, N. Shahzad and A. Shah, Mater. Res. Express, 2021, 8, 055006 CrossRef CAS.
- M. A. Wahba and A. A. Badawy, J. Sol-Gel Sci. Technol., 2020, 94, 637–647 CrossRef CAS.
- S. Haq, F. Abbasi, M. Ben Ali, A. Hed, A. Mezni, W. Rehman, M. Waseem, A. R. Khan and H. Shaheen, Mater. Res. Express, 2021, 8, 075009 CrossRef CAS.
- S. N. Basahel, T. T. Ali, K. Narasimharao, A. A. Bagabas and M. Mokhtar, Mater. Res. Bull., 2012, 47, 3463–3472 CrossRef CAS.
- Z. Vasiljević, M. P. Dojčinović, J. D. Vujančević, M. Spreitzer, J. Kovač, D. Bartolić, S. Marković, I. Janković-Čaštvan, N. B. Tadić and M. V. Nikolić, RSC Adv., 2021, 11, 32358–32368 RSC.
- S. Haq, W. Rehman, M. Waseem, V. Meynen, S. U. Awan, A. R. Khan, S. Hussain, Z. Ul-Abdin, S. U. Din, M. Hafeez and N. Iqbal, J. Inorg. Organomet. Polym. Mater., 2021, 31, 1312–1322 CrossRef CAS.
- C. Lin, H. Chen, A. Nakaruk, P. Koshy and C. C. Sorrell, Energy Procedia, 2013, 34, 627–636 CrossRef CAS.
- S. Shoukat, W. Rehman, S. Haq, M. Waseem and A. Shah, Mater. Res. Express, 2019, 6, 115052 CrossRef CAS.
- L. Elsellami, F. Dappozze, N. Fessi, A. Houas and C. Guillard, Process Saf. Environ. Prot., 2018, 113, 109–121 CrossRef CAS.
- M. Farhan Hanafi and N. Sapawe, Mater. Today: Proc., 2019, 19, 1533–1536 CAS.
- N. Bibi, S. Haq, W. Rehman, M. Waseem, M. U. Rehman, A. Shah, B. Khan and P. Rasheed, Biointerface Res. Appl. Chem., 2020, 10, 5895–5900 CAS.
- H. Salavati, N. Tavakkoli and M. Hosseinpoor, Ultrason. Sonochem., 2012, 19, 546–553 CrossRef CAS PubMed.
- D. Dodoo-Arhin, T. Asiedu, B. Agyei-Tuffour, E. Nyankson, D. Obada and J. M. Mwabora, Mater. Today: Proc., 2021, 38, 809–815 CAS.
- U. G. Akpan and B. H. Hameed, J. Hazard. Mater., 2009, 170, 520–529 CrossRef CAS PubMed.
- D. M. Nzilu, E. S. Madivoli, D. S. Makhanu, S. I. Wanakai, G. K. Kiprono and P. G. Kareru, Sci. Rep., 2023, 13, 14030 CrossRef CAS PubMed.
- S. Haq, H. Afsar, I. U. Din, P. Ahmad, M. U. Khandaker, H. Osman, S. Alamri, M. I. Shahzad, N. Shahzad, W. Rehman and M. Waseem, Catalysts, 2021, 11, 1–15 Search PubMed.
- S. Haq, A. Sarfraz, F. Menaa, N. Shahzad, S. U. Din, H. A. Almukhlifi, S. A. Alshareef, E. M. Al Essa and M. I. Shahzad, Molecules, 2022, 27, 1–19 Search PubMed.
- J. Ren, Y. Z. Wu, Y. Dai, D. W. Sha, M. Chen, J. J. Wang, J. M. Pan, H. Tang, X. N. Cheng and X. H. Yan, Mater. Technol., 2017, 32, 574–583 CrossRef CAS.
- S. M. Hassan, A. I. Ahmed and M. A. Mannaa, J. Sci.: Adv. Mater. Devices, 2019, 4, 400–412 Search PubMed.
| This journal is © The Royal Society of Chemistry 2024 |

