 Open Access Article
Aluminum and polyanion-doping to improve structural and moisture stability of Ni-rich layered oxides for lithium-ion batteries†
Yan Mo‡
ab,
Yingke Wu‡abc,
Guohui Yuan *ab,
ZiKun Li*b and
Meng Zhangb
aSchool of Chemistry and Chemical Engineering, Harbin Institute of Technology, Harbin 150001, People's Republic of China. E-mail: ygh@hit.edu.cn
bBTR New Material Group Co., Ltd., Shenzhen 518083, People's Republic of China. E-mail: lizikun@btrchina.com
cYongtsing Graphene Research Institute Co., Ltd., Yong'an 366000, People's Republic of China
First published on 16th April 2024
Abstract
Ni-rich layered materials LiNi0.8Co0.1Mn0.1O2 attracts extensive interest to build high-performance lithium-ion batteries, but ground challenges, e.g., unfavorable phase transfer and interfacial parasitic reactions during cycling, especially after being exposure to the air for a long time, greatly limit their practical utilization. Here, we prove that those issues of Ni-rich layered materials can be alleviated by concurrently incorporating the Al3+ and PO34−, and conduct corresponding comprehensive studies to explore mechanisms of the enhanced electrochemical performances. It is suggested that the phase transition (H2 to H3) that related to the lattice contraction can be suppressed after Al3+ and PO34− co-doping, leading to improved cycling stability. Additionally, the co-doping successfully mitigates the chemical reaction between the Ni-based oxides and the ambient air, significantly improving the reversibility of lithium intercalation and charge transfer kinetics against long-time storage. Specifically, the Al3+ and PO34− co-doped material maintains 94.1% capacity retention of 150 cycles before storage, and 73.6% capacity retention of 100 cycles after being stored in ambient air for 30 days, which is much better than that of the undoped one.
Introduction
The necessity of increasing the nickel content of LiNixCoyMn1−x−yO2 (NCM) up to 80% is rapidly increasing for developing high-capacity (exceeding 200 mA h g−1) Li-ion batteries (LIBs) and satisfying the demand of automotive application.1,2 However, for this kind of Ni-rich NCM materials (LiNixCoyMn1−x−yO2 with x > 0.8), non-stoichiometric Li1−xNi1+xO2 is inevitably formed due to the unstable Ni3+, in which the Ni2+ tends to be more thermodynamically stable at the expense of the oxygen self-reduction.3,4 As a result, it renders intersites mixing of Li+/Ni2+ and residual lithium to deteriorate structure crystallinity of Ni-rich NCM materials, thus severely degrading the kinetics of the lithium diffusion and reversibility of lithium extraction.5,6 Besides the structural antistites issue, the particle surface of the Ni-rich materials suffer from intrinsic chemical instability, involving the parasitic reactions between the high-valent Ni ion (at a highly delithiated state) with the electrolyte; air instability induced by the self-reduction of Ni3+ and rapid absorption of CO2 and moisture, leading contamination accumulation of Li2CO3 and LiOH.7,8 Thus, enhancing the structural and surface stability of Ni-rich NCM is desirable but challenging for developing high-performing LIBs.Surface coating and elemental doping are the two main strategies that have been introduced to tailor the above limitations. For the former one, traditional surface coating acting as an inert shielding can inhibits the side reactions of the electrode interface.9,10 But this method requires an extra calcination process after the first lithiation reaction between the precursor and lithium source, which is energy-consuming and always suffer from failure in establishing a uniform and robust coating layer. On the contrary, elemental doping is a time and energy-effective method that not only stabilize the crystal structure but also implement the surface protection. Among various cationic doping, the introduction of metal elements such as Zr, Ti, Al, Mg and Nb for transition elements (TMs) in Ni-rich materials has been proven to be effective at extending the cycle life with varying degrees.11–17 Based on previous study, it has been shown that the undesired NiO-like phase transition as well as the Li/Ni mixing can be alleviated after cationic doping. Particularly, the cost-effective Al element has been used to substitute the Ni of the layered oxides, which could enhance the moisture stability by limiting the generation of residual lithium.18 It should be mentioned that the doping rout of this work was co-precipitation method, which can ensure uniform Al3+ distribution but was relatively inefficient. However, whether solid-state doping can achieve the same effect of resisting the air pollution has not been studied yet. On the other hand, polyanion substitution with BO45−, SiO44− and PO43− for O decreased the TM–O covalency and inhibited the formation of O vacancies.19–21 For example, Xia and coworkers proposed that incorporating of BO33− and BO45− can decrease the variation of the electronic structure of the M–O systems, contributing to improved specific capacity, and cycling performance.19 However, the synergistic combination of cation and polyanion doping was rarely reported and the synergistic effect on the Ni-rich NCM materials is required to be revealed.
In this work, we introduce the high oxygen-binding Al3+ and highly electronegative PO43− into Ni-rich layered materials LiNi0.8Co0.1Mn0.1O2 to enhance the structural and chemical stability against the ambient air. The results clearly suggest that the synergistic incorporation significantly alleviates the Li+/Ni2+ mixing during lithiation process and thus enlarges the interlayer spacing, leading to the improved reversible capacity and better rate performance. Also, co-doped with Al3+ and PO43− is expected to stabilize the layered structure against the undesired phase transition of H2 to H3 as well as the contamination of ambient air, which efficiently enhances the cycling stability before and after being stored in the ambient air for a long time. Compared with the undoped one, the modified sample after 30 day stored still displays a higher specific capacity of 144.5 mA h g−1 after 100 cycles and rate performance of 62.5 mA h g−1 at 5C.
Experimental
Materials preparation
The undoped sample is named as U-NMC, which with nominal composition LiNi0.8Mn0.1Co0.1O2 was synthesized by co-precipitation method followed by solid-state route as previously presented in details.22 Briefly, the precursor Ni0.8Mn0.1Co0.1(OH)2 was obtained from the co-precipitation reaction of sulfate (NiSO4·6H2O, CoSO4·7H2O, and MnSO4·H2O) and NaOH solution. Then the precursor was annealed with LiOH·H2O at 550 °C for 5 h, 800 °C for 10 h with a heating rate of 5 °C per minute and O2 flow of 5 mL per minute, in which the molar ratio of Li![[thin space (1/6-em)]](https://www.rsc.org/images/entities/char_2009.gif) :
:![[thin space (1/6-em)]](https://www.rsc.org/images/entities/char_2009.gif) (Ni + Co + Mn) = 1.03
(Ni + Co + Mn) = 1.03![[thin space (1/6-em)]](https://www.rsc.org/images/entities/char_2009.gif) :
:![[thin space (1/6-em)]](https://www.rsc.org/images/entities/char_2009.gif) 1. The Al3+ and PO43− co-doped sample is named as APO–NCM, which was prepared by mixing the precursor Ni0.8Mn0.1Co0.1(OH)2 with a proper amount of NH4H2PO4, Al2O3 and LiOH·H2O (3% excess) and was calcined at the same condition as U-NCM. The synthesized U-NCA and APO–NCM powder was stored in the ambient air for 30 days to obtain degraded materials, which were labeled as U-NCM-S and APO–NCM-S, respectively.
1. The Al3+ and PO43− co-doped sample is named as APO–NCM, which was prepared by mixing the precursor Ni0.8Mn0.1Co0.1(OH)2 with a proper amount of NH4H2PO4, Al2O3 and LiOH·H2O (3% excess) and was calcined at the same condition as U-NCM. The synthesized U-NCA and APO–NCM powder was stored in the ambient air for 30 days to obtain degraded materials, which were labeled as U-NCM-S and APO–NCM-S, respectively.
Materials characterization
X-ray diffraction was used to distinguish the differences of crystal structure of the prepared powders (XRD, Bruker D2 Advance diffractometer, 10–80°). Additionally, the same device was used to respectively conduct the in situ XRD experiments to track the structural evolution of the electrodes during charge and discharge between 3 and 4.3 V at a rate of 0.05C (1C = 200 mA h g−1), and in situ high-temperature XRD (HT-XRD) studies to reveal the crystalline change upon calcination from 100 °C to 800 °C. The cell for in situ XRD was a special designed 2032-typed coin cell with a thin Be window for X-rays penetration. The lattice and occupancies parameters of the XRD patterns were analyzed by the GSAS/EXPGUI Rietveld program. X-ray photoelectron spectroscopy (XPS, Thermo ESCALAB 250) was performed to study the surface chemical properties of the materials. Field emission scanning electron microscope (SEM, Hitachi S-4800) coupled with an energy dispersive X-ray detector (EDS) was used to observe the morphology of the material. The microstructure of the material was analyzed using high-resolution transmission electron microscope (HRTEM, Tecnai G2 F30, S-TWIN), which was operated at 200 kV.The galvanostatic charge–discharge tests of the prepared cells were characterized by NEWARE testing system (BTS9) at 25 °C, in which the voltage range was 3–4.3 V and the current density of 1C was 200 mA h g−1. The electrodes were made by mixing the 5% conductive agent (Ketjen black), 3% binder (polyvinylidene fluoride) and 92% active materials in N-Methyl-2-Pyrrolidone (NMP) solution to obtain a slurry, then casting the slurry on Al foil and drying at 100 °C for 12 h, achieving an active material of approximately 3–5 mg on each disc with 10 mm thick coatings. The prepared cathodes were fabricated to the half cells (2025 coin-typed) in the Ar-filled glovebox with lithium disk as counter electrodes. The electrolyte was used 1 mol L−1 LiPF6 in carbonate–ethylene and carbonate–dimethyl mixture (EC![[thin space (1/6-em)]](https://www.rsc.org/images/entities/char_2009.gif) :
:![[thin space (1/6-em)]](https://www.rsc.org/images/entities/char_2009.gif) DEC = 1
DEC = 1![[thin space (1/6-em)]](https://www.rsc.org/images/entities/char_2009.gif) :
:![[thin space (1/6-em)]](https://www.rsc.org/images/entities/char_2009.gif) 2 by volume). The electrochemical impedance spectroscopy (EIS) and cyclic voltammograms (CV) were respectively done in the frequency range of 100 kHz to 0.1 Hz and 3–4.3 V vs. Li/Li+ with a scan rate of 0.5 mV s−1 by using the electrochemical workstation (Biologic VSP-300). The differential capacity vs. voltage (dQ/dV) derived from the charge–discharge curve as well as the galvanostatic intermittent titration technique (GITT) was conducted using HOKUTO DENKO test system.
2 by volume). The electrochemical impedance spectroscopy (EIS) and cyclic voltammograms (CV) were respectively done in the frequency range of 100 kHz to 0.1 Hz and 3–4.3 V vs. Li/Li+ with a scan rate of 0.5 mV s−1 by using the electrochemical workstation (Biologic VSP-300). The differential capacity vs. voltage (dQ/dV) derived from the charge–discharge curve as well as the galvanostatic intermittent titration technique (GITT) was conducted using HOKUTO DENKO test system.
Results and discussion
XRD patterns of the U-NCM, APO–NCM samples are presented in Fig. 1. Both the pristine and doped one show strong peaks that can be attributed to the layered structure (R![[3 with combining macron]](https://www.rsc.org/images/entities/char_0033_0304.gif) m) of hexagonal α-NaFeO2.23 No extra phases are detected even for the modified sample due to the addition amounts of Al3+ and PO43− are very low. The Rietveld refinements are conducted to unravel the co-doping effect on the crystal structure, in which the lattice and occupancy parameters are listed in Table 1. The lattice parameters a and c for the undoped U-NCM sample are 2.875088 Å and 14.199792 Å, respectively. Although the size of Al3+ (0.53 Å) is smaller than that of Co3+ (0.54 Å), Ni2+ (0.69 Å) and Ni3+ (0.6 Å), the Al3+ and PO43− co-doping efficiently increases structure crystallinity, leading to an enlarged lattice axis and better hexagonal ordering.7,24 After Al3+ and PO43− incorporation, the value of a and c for the APO–NCM sample respectively increase to 2.875135 Å and 14.224755 Å, and the hexagonal ordering indicator of c/a is increased from 4.938 to 4.947. By comparing the calculated Rietveld refinements, the Li+/Ni2+ mixing of the APO–NCM sample is greatly reduced from 9.18% to 4.54%, which is coincide with the results of the peak ratio of (003) to (104) (I(003)/I(104)).25 This significant improvement can be attributed to the higher electronegativity of PO43− and the strong bonding energy of Al–O, which can inhibit the mobility of Ni2+ into Li layer during the high-temperature calcination. This can be further proved by the subsequent in situ HT-XRD experiments (Fig. 2) and HRTEM (Fig. S5†) measurement.
m) of hexagonal α-NaFeO2.23 No extra phases are detected even for the modified sample due to the addition amounts of Al3+ and PO43− are very low. The Rietveld refinements are conducted to unravel the co-doping effect on the crystal structure, in which the lattice and occupancy parameters are listed in Table 1. The lattice parameters a and c for the undoped U-NCM sample are 2.875088 Å and 14.199792 Å, respectively. Although the size of Al3+ (0.53 Å) is smaller than that of Co3+ (0.54 Å), Ni2+ (0.69 Å) and Ni3+ (0.6 Å), the Al3+ and PO43− co-doping efficiently increases structure crystallinity, leading to an enlarged lattice axis and better hexagonal ordering.7,24 After Al3+ and PO43− incorporation, the value of a and c for the APO–NCM sample respectively increase to 2.875135 Å and 14.224755 Å, and the hexagonal ordering indicator of c/a is increased from 4.938 to 4.947. By comparing the calculated Rietveld refinements, the Li+/Ni2+ mixing of the APO–NCM sample is greatly reduced from 9.18% to 4.54%, which is coincide with the results of the peak ratio of (003) to (104) (I(003)/I(104)).25 This significant improvement can be attributed to the higher electronegativity of PO43− and the strong bonding energy of Al–O, which can inhibit the mobility of Ni2+ into Li layer during the high-temperature calcination. This can be further proved by the subsequent in situ HT-XRD experiments (Fig. 2) and HRTEM (Fig. S5†) measurement.
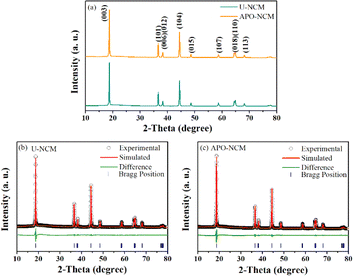 | ||
| Fig. 1 The XRD patterns of U-NCM and APO–NCM (a) samples, and the corresponding Rietveld refinements (b and c). | ||
| Sample | Lattice parameters | Li+/Ni2+ mixing | I(003)/I(104) | Rwp (%) | ||
|---|---|---|---|---|---|---|
| a (Å) | c (Å) | c/a | ||||
| U-NCM | 2.87508(8) | 14.19979(2) | 4.938 | 9.18% | 1.59 | 2.33 |
| APO–NCM | 2.87513(5) | 14.22475(5) | 4.947 | 4.54% | 1.74 | 2.39 |
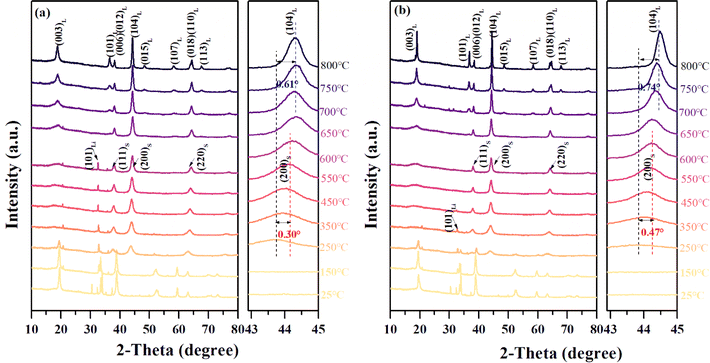 | ||
| Fig. 2 In situ HT-XRD patterns of the U-NCM (a) and APO–NCM (b) samples, collected from 25 °C to 800 °C. | ||
For better understanding the Al3+ and PO43− doping effect on the change from cationic disordering to ordering, the in situ HT-XRD is conducted to scrutinize phase transition during the calcination process (Fig. 2). Within the temperature range from 150 °C to 600 °C, the gradually decreased intensity of (101)Li reflection of LiOH and the merging of the (200/220)S reflections of spinel structure indicate the onset of the phase transition from the hydroxides to a disordered spinel structure. During this process, we find a substantially advanced phase transition after Al3+ and PO43− co-doping. As shown in Fig. 2, the (101)Li reflection of LiOH at 450 °C is barely observed in the case of ATO–NCM sample, while it is still not yet completely disappeared at 600 °C in the case of the U-NCM sample. Also, the movement of (220)S of the ATO–NCM sample is higher than that of the U-NCM sample as heating the temperature from 250 °C to 600 °C. Both the early disappeared reflection of LiOH and higher-angle reflection of intermediates suggest that co-doping with Al3+ and PO43− is favorable for promoting the fusion of lithium and oxides. Continue to raise the temperature from 600 °C to 800 °C, the phase starts to transform from the disordered spinel to a ordered layered structure as mainly reflected by the (003)L reflection of the layered structure, whose peak intensity gradually being strengthened and the FWHM becomes narrow with the temperature rise. More importantly, as for heating to 800 °C, for the U-NCM sample without doping exhibits a poor crystallization, as reflected by the (003)L reflection of the ordered layered structure that has a wide FWHM. However, as for the mixture with Al3+ and PO43− incorporation, the FWHM of (003)L reflection for the layered structure is smaller and the (104)L shifts to higher angle. Moreover, as compared with the U-NCM sample, the splitting of (006)/(012)L and (008)/(110)L reflections of the APO–NCM sample become more visible when heated to 800 °C (Fig. S1†), which are the important indicator of an ordered layered structure.26 Additionally, the HRTEM (Fig. S5†) also proves that the APO–NCM sample has a higher ordering structure as its diffraction spots are brighter and arranged more orderly as compared to the U-NCM sample. Those results provide direct evidences of the more fluent phase transitions of the APO–NCM sample during the high-temperature calcination, highlighting the substantially improvements of crystallinity after Al3+ and PO43− co-doping.
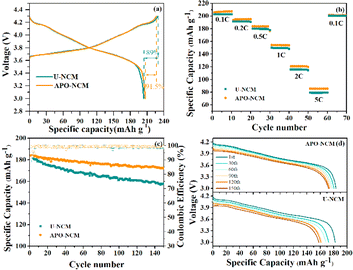
The electrochemical properties of the U-NCM and APO–NCM samples are evaluated by using 2025 coin cells with lithium metal as the anode (Fig. 3). Fig. 3a compares the first charge/discharge behavior in the voltage range of 3–4.3 V at a current density of 0.1C. The APO–NCM sample provides higher capacity of 206.7 mA h g−1 and coulombic efficiency of 91.5% than that of the U-NCM sample (204.0 mA h g−1 with 89.0% coulombic efficiency). This can be ascribed to the advantage of the crystal structure of the APO–NCM sample (Fig. 1), the lower Li+/Ni2+ mixing provides larger amount of Li+ that can be intercalated/deintercalated in the Li layer, and the increased cell volume that improves the Li+ diffusion coefficient is beneficial for reducing the polarization. But another factor that cannot be ignored is that the improvement in the capacity and coulombic efficiency is minor. This is because that the doped Al3+ is electrochemically inert, and the substitution of transition metals by Al3+ can also reduce the capacity of the material.27 Therefore, the inert characteristics of Al3+ to some extent offset the gain in capacity enhancement caused by crystal structure enhancement.
Additionally, the rate capability is slightly improved after Al3+ and PO43− doping (Fig. 3b). Especially at high current density of 2C and 5C, the APO–NCM sample delivers a higher capacity of 120.7 mA h g−1 and 85.4 mA h g−1, respectively, compared to that of the U-NCM sample (115.6 mA h g−1 and 78.9 mA h g−1).
The cycling performance of the doped and undoped materials is presented in Fig. 3c. The cycling life of the APO–NCM sample that evaluated at 0.5C is prominently higher than that of the U-NCM sample. The APO–NCM sample shows an enhanced cycling stability with a capacity retention of 94.1% after 150 cycles, compared to that of 86.2% for the U-NCM sample. In addition, the degradation of working voltage during cycling is also alleviated after co-doping (Fig. 3d). The average working voltage of the U-NCM sample rapidly drops to 3.74 V (60th cycle) and 3.66 V (150th cycle), while that of the APO–NCM sample can still retain 3.78 V (60th cycle) and 3.71 V (150th cycle).
To exam the differences of the electrode polarization and Li+ reversibility between the U-NCM and APO–NCM samples, the CV that mainly reflects the reactivity of particle surface are depicted in Fig. 4. The typical pair of anodic/cathodic peaks in the 1st and 2nd cycles for the U-NCM sample are at around 3.56/4.03 V and 3.56/3.99 V, respectively, suggesting that the polarization between the oxidation and the reduction reaction of the U-NCM sample is prominent (Fig. 4a). Besides, it is found that all the cathodic peaks of the two samples gradually shift to low potential with successive scans, indicating a drastic surface structural reconstruction that occurs upon the first few cycles.14 Finally, after the 4th cycle, the mainly anodic/cathodic peaks remain fixed, respectively locates around 3.59 and 3.87 V, suggesting the initial nonequilibrium state has transformed to an equilibrium state. In the case of APO–NCM sample, the electrode polarization in the 1st cycle is less than that of the U-NCM sample (as the main pair of anodic/cathodic peak locates at 3.60/3.97 V), and then become negligible in the 2nd cycle with anodic/cathodic peak at 3.57/3.86 V. Also, the particle surface of the APO–NCM sample exhibits obviously less structural reconstruction as compared to the U-NCM sample, as the cathodic peak of APO–NCM exhibits a smaller displacement from the 1st to 2nd cycle, and more importantly the position of cathodic peak remains almost fixed in the following the 3rd to 5th cycle. As a consequent, the incorporation of Al3+ and PO43− could substantially reduce the electrode polarization, improving the surface stability and reaction reversibility.
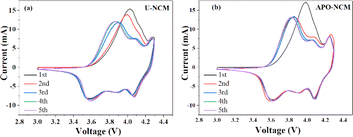 | ||
| Fig. 4 The CV curves in the first 5 cycles for the U-NCM (a) and APO–NCM (b) samples, conducted between 3 and 4.3 V at a scan rate of 0.5 mV s−1. | ||
To clearly unravel the discrepancies of structural stability between the doped and undoped samples, in situ XRD examination during charge and discharge is performed for the first cycle (3–4.3 V) at 0.05C (Fig. 5 and S6†). The charge–discharge curves and variation of diffraction peak (mainly for the (003), (101), and (107) reflections) with time depicted by contour plots are shown in Fig. 5a–d. The continuous shift of (003) peak toward lower angle when charged the cell from 3 V to 4.0 V, demonstrating the lattice c expansion and the phase transition of H1 to H2.22 Nevertheless, when the cathode passing through a long platform about 4.1 V, the (003) peak abruptly moves to higher angle, indicating a phase evolution occurs from H2 to H3 phase along with the contraction of lattice c.16 It is worth noting that the amplitude of the (003) movement of the APO–NCM sample is smaller than that of the U-NCM sample above 4.0 V, suggesting less phase transformation of H2 to H3 as well as less contraction of the lattice c. This result meshes well with dQ/dV measurement. As shown in Fig. S7,† there are four redox couples within the tested voltage in the range of 2.8–4.3 V, which are assigned to the oxidation/reduction of Ni and Co ions along with a series of phase transitions. It should be noted that a pair of peaks at around 4.2 V can be attributed to the undesirable phase transition from H2 to H3. This peak intensity of the ATO–NCM sample is also smaller than that of the U-NCM sample. The c-axis shrinkage is the result of the oxidation from Ni2+ to Ni4+, severely shortening the interlayer distances of Li layer and TM layer. Meanwhile, Ni2+ in the Li layer induced by anti-site mixing is oxidized to Ni4+, causing the generation of NiO2 sheets at a highly charged state.28 Therefore, the effective inhibition of Ni2+ migration from the blocking effect of Al3+ and PO43− can sustain the structure without severe interslab collapse, which significantly enhances the structural stability and thus extends the cycle life. The corresponding lattice parameters evolution upon the initial cycle is also calculated and further validates the above observation (Fig. 5e and f). There are almost no differences in the voltage of the lattice expansion or contraction between the two samples. But the maximum shrinkage of lattice c(Δc) and a(Δa) of the APO–NCM sample is much smaller than that of the U-NCM sample, showing −2.11% Δa and −1.80% Δc during charge, compared to that of −2.15% Δa and −3.03% Δc for the U-NCM sample. This result meshes well with the reflection variation upon charge, the movements of the typical reflection of (003), (101) and (107) is reduced after Al3+ and PO43− incorp-oration (Fig. 5c and d). Moreover, the APO–NCM sample exhibits better structural reversibility as the lattice change of APO–NCM sample returns closer to initial state at the end of discharge as compare with that of the pristine one. In total, co-doping with Al3+ and PO43− efficiently limits the variation of crystal structure, leading to less intergranular crack and better cyclability.
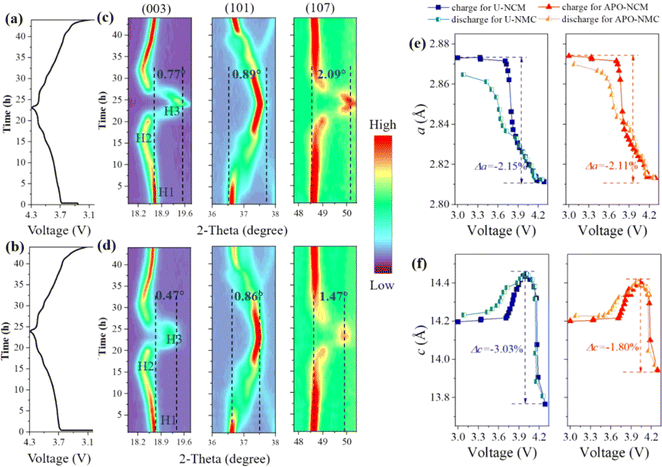 | ||
| Fig. 5 In situ XRD results of the U-NCM (a, c and e) and APO–NCM (b, d and f) samples: the charge–discharge profiles at 0.05C (a and b), selected 2-theta ranges of the in situ XRD patterns (Fig. S2†) responsible for (003), (101), and (107) reflections (c and d), lattice parameters evaluation of a and c (e and f). | ||
To identify the morphology change of the particles triggered by the aforementioned H3 phase, the SEM images of two samples before and after cycling are provided in Fig. S8.† All the particles before cycling are composed of densely aggregated primary particles. But the particles of both samples underwent varying degrees damage after cycling, and the surface pulverization for the U-NCM electrode is more serious than the APO–NCM electrode. We find many cracks on the surface for U-NCM sample along with extensive fracture of particles, but few for the APO–NCM sample. Upon magnification, the original aggregated primary particle of the U-NCM sample is smashed, leading to various microcracks. The cracks of the electrode are also observed in APO–NCM sample. But the generation of microcracks during the cycling is significantly suppressed in the APO–NCM sample.
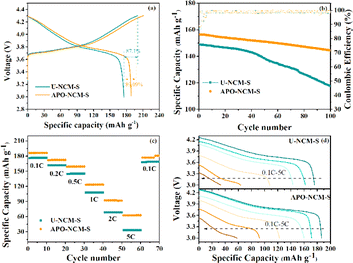
In addition to remarkable cyclability for the freshly APO–NCM sample, the electrochemical performance of the APO–NCM-S sample achieves overall enhancement after being exposed to the air for 30 days as compared to that of the U-NCM-S sample (Fig. 6). Fig. 6a presents the initial charge/discharge profiles of the aged U-NCM-S and APO–NCM-S samples at 0.1C within 3–4.3 V. The aged APO–NCM-S sample maintains 188.6 mA h g−1 with coulombic efficiency of 89.1%, significantly surpassing that of the U-NCM-S sample (175.4 mA h g−1 with coulombic efficiency of 87.1%). Additionally, the poor storage stability of the U-NCM-S sample undergoes drastic degradation of cyclability and rate capability after exposing in ambient air (Fig. 6b). The undoped one delivers a capacity retention of 73.6% after 100 cycles, which corresponds to only 67.7% capacity retentions in the comparison to the fresh one. After Al3+ and PO43− incorporation, the U-NCM-S sample shows excellent chemical stability against air, still maintaining a capacity retention of 91.2% after 100 cycles, corresponding to 81.3% as compared to the fresh one. After 30 days of storage, the rate capability of the U-NCM-S sample decreases from 107.5 mA h g−1 to 33.4 mA h g−1 as increasing the rate from 1C to 5C, while the aged APO–NCM-S sample remains 123.3 mA h g−1 and 62.5 mA h g−1 at 1C and 5C, respectively (Fig. 6c and d).
To obtain more details of the chemical reaction during storage, a comparison of the EIS of the fresh and aged samples is displayed in Fig. 7. The values of charge-transfer resistance (Rct, characterized by the medium-frequency) and surface film resistance (Rf, characterized by the high-frequency) are fitted by the Nyquist plots, and the equivalent circuit for fitting is inserted in Fig. 7a. In the case of un-doped samples, the Rf and Rct before storage is 26.7 Ω and 148.6 Ω for the fresh U-NCM sample, while that markedly rise to 36.9 Ω and 223.4 Ω after 30 day storage, respectively. This EIS data is the result of the surface degradation that induces a lot of residual lithium and NiO, causing the increment of cathode electrolyte interface (CEI) and the resistances for both electrons and Li+. On the contrary, the aged co-doped sample show a trivial resistance variation compared to the fresh one. After 30 day storage, the resistance increases from 18.2 to 97.5 Ω for Rf and 24.5 to 124.9 Ω for Rct. Furthermore, GITT measurements of the U-NCM and ATO–NCM samples are used to directly probe the lithium diffusion coefficient (DLi+) during charge and discharge (Fig. S9†). Upon the early stage of delithiation, the Li layer space expands to promote faster Li-ion migration because of the increased electrostatic repulsion between the TM–O layers. When the x = 0.6, the DLi+ of the ATO–NCM sample is 1.71 × 10⁻⁹ cm2 s−1, which is much larger than that of the U-NCM sample (9.11 × 10⁻¹⁰ cm2 s−1). As Li-ion is reinserted, the DLi+ decreases because of the gradually vanished vacancies in the crystal lattice. As compared to the U-NCM sample, higher DLi+ of the ATO–NCM sample is also obtained at any given state of discharge. This result suggests that Al3+ and PO43− co-doping can improve the electrochemical behavior not only from the inhibited lattice contraction but also from the suppression of byproducts of the surface degradation. The strong Al–O bonding and strong electronegativity can inhibit the loss of lattice oxygen from the surface structure, which significantly increase the chemical stability against ambient air. Thus, the APO–NCM sample shows lower internal resistance and higher reversible Li+ content, due to the reduction of generation of the NiO-like and residual lithium species, which is further proved in the following XPS. To further illustrate the variation of surface composition before and after storage, Fig. 8 presents the XPS of the fresh and aged samples. As shown Fig. 8a–d, for the fresh samples, the Ni 2p3/2 peak located at around 854.6 eV, exhibiting similar XPS curves for the two samples. However, after 30 day air exposure, the main peak of Ni 2p3/2 curve of the two samples shifts to higher binding energy around 853.5 eV, and can be separated to two peaks of 852.8 eV featured Ni2+ and 854.5 eV featured Ni3+. It should be noted that the proportion ratio of Ni2+ to Ni3+ of the APO–NCM-S sample is much lower than that of the U-NCM sample. This result confirms that Al3+ and PO43− incorporating notably decreases the content of NiO, which is the products of unfavorable reaction of Ni-rich layered oxides with moisture or carbon dioxide.28 Furthermore, as shown Fig. 8e–h, three main peaks are observed in the C 1s XPS profile, which can be ascribed to the graphitic material (C–C), polycarbonates (C–O), and Li2CO3 (C![[double bond, length as m-dash]](https://www.rsc.org/images/entities/char_e001.gif) O), respectively located at 288.9 eV, 286.4 eV, 284.7 eV. In the case of undoped samples, the proportion of C
O), respectively located at 288.9 eV, 286.4 eV, 284.7 eV. In the case of undoped samples, the proportion of C![[double bond, length as m-dash]](https://www.rsc.org/images/entities/char_e001.gif) O peak exhibits sharp increase after being exposed to the air for 30 days (Fig. 8e and g). Suggesting a high quantity of residual lithium species are formed due to the moisture and carbon dioxides contamination. But for the co-doped APO–NCM-S sample, the peak intensity of C
O peak exhibits sharp increase after being exposed to the air for 30 days (Fig. 8e and g). Suggesting a high quantity of residual lithium species are formed due to the moisture and carbon dioxides contamination. But for the co-doped APO–NCM-S sample, the peak intensity of C![[double bond, length as m-dash]](https://www.rsc.org/images/entities/char_e001.gif) O after air-exposure is relatively lower than that of the U-NCM-S sample (Fig. 8f and h). We believe the difference of the C 1s after exposure provides an unequivocal proof that the surface chemical reactivity towards air is significantly reduced by Al3+ and PO43−co-doping.
O after air-exposure is relatively lower than that of the U-NCM-S sample (Fig. 8f and h). We believe the difference of the C 1s after exposure provides an unequivocal proof that the surface chemical reactivity towards air is significantly reduced by Al3+ and PO43−co-doping.
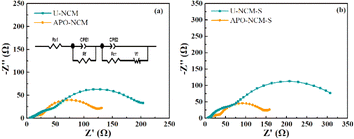 | ||
| Fig. 7 EIS results of the fresh U-NCM and APO–NCM samples (a), 30 day stored U-NCM-S and APO–NCM-S samples (b). | ||
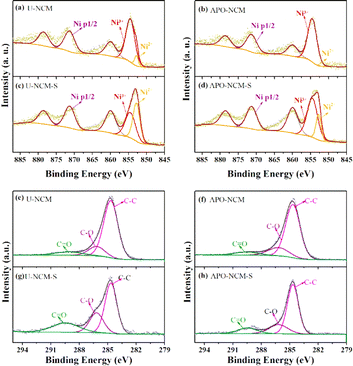 | ||
| Fig. 8 XPS results of Ni 2p (a–d) and C 1s (e–h) for the fresh U-NCM (a and e) and APO–NCM (b and f) samples, 30 day stored U-NCM-S (c and g) and APO–NCM-S (d and h) samples. | ||
Conclusions
In summary, the structural and moisture stability of the Ni-rich layered materials is greatly enhanced through Al3+ and PO43− co-doping via a simple solid-state method. Despite the electrochemically inactive property of Al3+, the sample with synergistic incorporation exhibits slightly higher capacity and rate capability, which can be ascribed to the alleviated the Li/Ni mixing and enlarged the interlayer spacing during the calcination process. Combined in situ XRD and CV characterizations evidence that the co-doped materials undergo less H2–H3 phase transfer and better Li+ intercalation reversibility, resulting greatly enhanced cycle life. As a result of the co-doping, the APO–NCM sample exhibits a higher capacity of 206.7 mA h g−1 at 0.1C, and remarkable capacity retention of 94.1% at 0.5C after 150 cycles. Moreover, Al3+ with higher oxygen-binding and PO43− with strong electronegativity are favorable for suppressing the oxygen evolution from lattice, stabilizing the particle surface structure upon air exposure. Compared with the 30 day stored U-NCM-S sample, the co-doped APO–NCM-S exhibits improved cycling stability (73.6% retention after 100 cycles at 0.5C) and rate capability (123.3 mA h g−1 and 62.5 mA h g−1 at 1C and 5C, respectively).Author contributions
Yan Mo and Yingke Wu conceived the idea, synthesized materials and wrote the original draft. ZiKun Li: and Meng Zhang carried out the electrochemical measurements and data analysis. Yingke Wu conducted the insitu XRD test and data analysis. Guohui Yuan charged with financing, reviewed and edited the manuscript.Conflicts of interest
The authors declare no conflict of interest.Acknowledgements
The authors thank Prof. Chen Yong for fruitful discussions. This study was financially supported by National Key Research and Development Projects (2021YFC2902903).Notes and references
- W. Liu, P. Oh, X. Liu, M. J. Lee, W. Cho, S. Chae, Y. Kim and J. Cho, Angew. Chem., Int. Ed., 2015, 54, 4440–4457 CrossRef CAS PubMed.
- A. Manthiram, J. C. Knight, S. T. Myung, S. M. Oh and Y. K. Sun, Adv. Energy Mater., 2016, 6, 1501010 CrossRef.
- J. C. Zhang, Z. Z. Yang, R. Gao, L. Gu, Z. B. Hu and X. F. Liu, ACS Appl. Mater. Interfaces, 2017, 9, 29794–29803 CrossRef CAS PubMed.
- B. B. Lim, S. T. Myung, C. S. Yoon and Y. K. Sun, ACS Energy Lett., 2016, 1, 283–289 CrossRef CAS.
- P. Y. Hou, X. Q. Wang, D. G. Wang, D. W. Song, X. X. Shi, L. Q. Zhang, J. Guo and J. Zhang, RSC Adv., 2014, 4, 15923–15929 RSC.
- Y. Cho, P. Oh and J. Cho, Nano Lett., 2013, 13, 1145–1152 CrossRef CAS PubMed.
- B. Pei, H. Zhou, A. Goel, M. Zuba, H. Liu, F. Xin and M. S. Whittingham, J. Electrochem. Soc., 2021, 168, 050532 CrossRef CAS.
- J. Kim, J. Lee, C. Bae and B. Kang, ACS Appl. Mater. Interfaces, 2020, 12, 11745–11752 CrossRef CAS PubMed.
- Y. Mo, B. Hou, D. Li, X. B. Jia, B. K. Cao, L. H. Yin and Y. Chen, RSC Adv., 2016, 6, 88713–88718 RSC.
- W. Zhang, L. Liang, F. Zhao, Y. Liu, L. Hou and C. Yuan, Electrochim. Acta, 2020, 340, 135871 CrossRef CAS.
- J. Choi, S. Y. Lee, S. Yoon, K. H. Kim, M. Kim and S. H. Hong, Chemsuschem, 2019, 12, 2439–2446 CrossRef CAS PubMed.
- H. Chen, Q. Y. Hu, Z. M. Huang, Z. J. He, Z. X. Wang, H. J. Guo and X. H. Li, Ceram. Int., 2016, 42, 263–269 CrossRef CAS.
- D. Liu, S. Y. Liu, C. C. Zhang, L. Z. You, T. Huang and A. S. Yu, ACS Sustainable Chem. Eng., 2019, 7, 10661–10669 CrossRef CAS.
- D. Kong, J. Hu, Z. Chen, K. Song, C. Li, M. Weng, M. Li, R. Wang, T. Liu, J. Liu, M. Zhang, Y. Xiao and F. Pan, Adv. Energy Mater., 2019, 9, 1901756 CrossRef CAS.
- M. Jeong, H. Kim, W. Lee, S. J. Ahn, E. Lee and W. S. Yoon, J. Power Sources, 2020, 474, 230 CrossRef.
- Z. C. Liu, H. H. Zhen, Y. Kim and C. D. Liang, J. Power Sources, 2011, 196, 10201–10206 CrossRef CAS.
- H. Kondo, Y. Takeuchi, T. Sasaki, S. Kawauchi, Y. Itou, O. Hiruta, C. Okuda, M. Yonemura, T. Kamiyama and Y. Ukyo, J. Power Sources, 2007, 174, 1131–1136 CrossRef CAS.
- Y. You, H. Celio, J. Li, A. Dolocan and A. Manthiram, Angew. Chem., Int. Ed., 2018, 57, 6480–6485 CrossRef CAS PubMed.
- B. Li, H. Yan, J. Ma, P. Yu, D. Xia, W. Huang, W. Chu and Z. Wu, Adv. Funct. Mater., 2014, 24, 5112–5118 CrossRef CAS.
- H. Z. Zhang, Q. Q. Qiao, G. R. Li and X. P. Gao, J. Mater. Chem. A, 2014, 2, 7454–7460 Search PubMed.
- H.-Z. Zhang, F. Li, G.-L. Pan, G.-R. Li and X.-P. Gao, J. Electrochem. Soc., 2015, 162, A1899 CrossRef CAS.
- Y. Mo, L. J. Guo, B. K. Cao, Y. G. Wang, L. Zhang, X. B. Jia and Y. Chen, Energy Storage Mater., 2019, 18, 260–268 CrossRef.
- K. Mizushima, P. C. Jones, P. J. Wiseman and J. B. Goodenough, Solid State Ionics, 1981, 3–4, 171–174 CrossRef CAS.
- D. Aurbach, O. Srur-Lavi, C. Ghanty, M. Dixit, O. Haik, M. Talianker, Y. Grinblat, N. Leifer, R. Lavi, D. T. Major, G. Goobes, E. Zinigrad, E. M. Erickson, M. Kosa, B. Markovsky, J. Lampert, A. Volkov, J. Y. Shin and A. Garsuch, J. Electrochem. Soc., 2015, 162, A1014–A1027 CrossRef CAS.
- W. S. Yoon, K. W. Nam, D. Jang, K. Y. Chung, J. Hanson, J. M. Chen and X. Q. Yang, J. Power Sources, 2012, 217, 128–134 CrossRef CAS.
- J. M. Zheng, P. F. Yan, L. Estevez, C. M. Wang and J. G. Zhang, Nano Energy, 2018, 49, 538–548 CrossRef CAS.
- T. Weigel, F. Schipper, E. M. Erickson, F. A. Susai, B. Markovsky and D. Aurbach, ACS Energy Lett., 2019, 4, 508–516 CrossRef CAS.
- H. Yu, Y. Cao, L. Chen, Y. Hu, X. Duan, S. Dai, C. Li and H. Jiang, Nat. Commun., 2021, 12, 237 CrossRef PubMed.
Footnotes |
| † Electronic supplementary information (ESI) available. See DOI: https://doi.org/10.1039/d4ra00879k |
| ‡ The first and second authors contributed equally. |
| This journal is © The Royal Society of Chemistry 2024 |

