 Open Access Article
A high-performance room-temperature NH3 gas sensor based on WO3/TiO2 nanocrystals decorated with Pt NPs†
Zhixuan Wuab,
Zhengai Chenb,
Zhixiang Dengb,
Ning Dai b,
Yan Sun
 *b and
Meiying Ge*c
aSchool of Physical Science and Technology, ShanghaiTech University, Shanghai 201210, China. E-mail: wuzhx1@shanghaitech.edu.cn
bState Key Laboratory of Infrared Physics, Shanghai Institute of Technical Physics, Chinese Academy of Sciences, Shanghai 200083, China. E-mail: sunny@mail.sitp.ac.cn
cNational Engineering Research Center for Nanotechnology, Shanghai 200241, PR China. E-mail: meiyingge@163.com
First published on 16th April 2024
Abstract
In this work, a high-performance room-temperature ammonia (NH3) gas sensor based on Pt-modified WO3–TiO2 nanocrystals was synthesized via a two-step hydrothermal method. The structural properties were characterized by scanning electron microscopy, transmission electron microscopy, X-ray diffraction, and X-ray photoelectron spectroscopy. The 10 at% Pt@WO3–TiO2 nanocrystals present the highest NH3 sensing performance at room temperature. Compared with the nanocrystals without Pt modification, the sensitivity of the Pt@WO3–TiO2 sensor is tenfold higher, with the lowest concentration threshold reaching the 75 ppb level. The response is approximately 92.28 to 50 ppm, and response and recovery times are 23 s and 8 s, respectively. The improved sensing was attributed to a synergetic mechanism involving the space charge layer effect and Pt metal sensitization, enhancing the electron transfer efficiency, oxygen vacancy and specific surface area. This study is expected to guide the development of high-performance room-temperature ammonia sensors for clinical breath testing.
1 Introduction
Ammonia (NH3) is a colorless, water-soluble, and toxic gas with a pungent odor, presenting in industrial, agricultural, and automobile emissions. Many studies have confirmed that the concentration of NH3 in human exhaled breath can be used as a specific biomarker for end-stage renal disease (ESRD).1 The NH3 gas content in the exhaled breath of healthy people is approximately 0.4–1.8 ppm, but it can exceed 14.7 ppm in patients with ESRD.2 Furthermore, NH3 is utilized to evaluate the freshness of meat since natural enzymes and microorganisms break down proteins and amino acids containing sulfur to release NH3.3 Thus, real-time and effective NH3 detection at low ppm levels is urgently needed.4 Metal oxide semiconductor (MOS) materials, such as WO3, ZnO,5 SnO2,6 and CuO,7 have high sensitivity and low cost, so they are often used for the sensing of low-concentration target gases.8 Tungsten oxide (WO3), as a typical n-type gas-sensing material, has attracted considerable attention owing to its excellent performance in gas monitoring.9–11Nevertheless, MOS-based gas sensors are still dependent on high operating temperatures.12 According to the surface depletion model,13 the optimal operating temperature for gas sensors based on WO3 nanostructures is usually in the 150–350 °C range, when adsorption and desorption processes reach dynamic equilibrium.9–11 However, sensors that require high temperatures are not suitable for some Internet of Things devices with no power supply. Consequently, NH3 sensors that work at room temperature with very low power consumption are needed. Many strategies have been devised to enhance the gas-sensing properties of MOS, including heterojunction doping,14 oxygen vacancy injection,15 and metal quantum dot modification.16 For instance, Yan et al. synthesized WO3/CuO core–shell nanorod arrays through a hydrothermal method. The synergistic effect of the p–n heterojunction achieved enhanced gas-sensing performance for NH3;17 Thai et al. synthesized Pt-metal-modified SnO2 films via chemical vapor deposition, and owing to the sensitization effect of metal quantum dots, NH3 gas-sensing properties were significantly improved.18 Regrettably, the device showed excellent performance only at high temperatures.
In recent years, titanium dioxide (TiO2) materials, characterized by low baseline resistance and stable electron transfer, have been increasingly employed in constructing nanoscale heterostructures to improve gas sensor performance.19 To date, some progress has been made with WO3–TiO2 composites for the detection of gases such as hydrogen,20,21 acetone,22 ammonia,9 and ethanol.23 However, the poor sensitivity and recovery process are thorny issues, and the detection of ppb-level concentrations of NH3 at room temperature still remains challenging. Further enhancing the MOS-based NH3 sensitivity may be possible by incorporating noble metal modifications and leveraging the synergistic effects between metal nanoparticles and heterojunctions. However, according to our research, there is limited literature documenting the influence of co-modifying noble metals nanoparticles (NPs) and other MOS materials for room-temperature NH3 gas sensors.
In this work, NH3 gas sensors that work at room temperature were prepared based on WO3–TiO2 composite nanoparticles modified with Pt NPs. The sensors augment surface reactivity through the synergistic effects of heterojunctions and noble metal enhancement. Pt@WO3–TiO2 hybrids were synthesized using a secondary hydrothermal method, and various characterization techniques were utilized to explore the impact of different concentrations of Pt decoration on the nanostructure. We also assessed the sensing response to NH3 under room-temperature conditions. Compared to previously reported investigations, platinum-modified WO3–TiO2 gas sensors effectively meet the requirements of ambient-temperature operation and high sensitivity. This success is attributed to the synergism between platinum metal sensitization and heterojunction space charge layer effects, which has received limited attention in previous reports.
2 Experimental
2.1 Materials
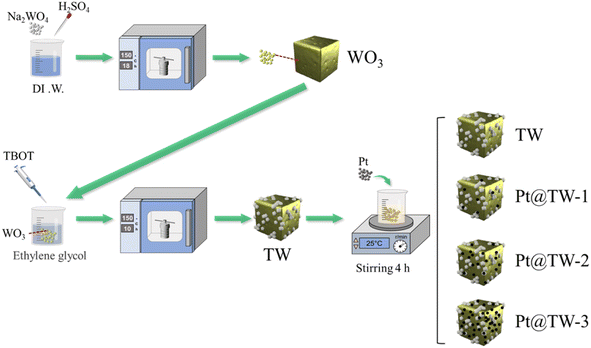
Sodium tungstate dihydrate (Na2WO4·2H2O), concentrated sulfuric acid (98%, H2SO4), ethanol (C2H5OH), tetra-n-butyl titanate (C16H36O4Ti), glacial acetic acid (CH3COOH), nitric acid (68%, HNO3), potassium chloroplatinate (K2PtCl6), and ethylene glycol (C2H6O2) were all purchased from Aladdin Reagents. All chemicals were of analytical grade and were used with no further purification. The preparation process for composite samples is depicted in Fig. 1 and outlined in following sections.2.2 Fabrication of WO3–TiO2
Before experiments, powdered WO3 nanocubes (Ncs) were obtained using a previously reported method.24 WO3–TiO2 hybrids were synthesized by a simple acid-based hydrothermal method. 0.232 g (0.001 mol) of prepared WO3 was added to 10 mL of CH3COOH. With stirring until fully mixed, 0.102 mL (30 at%) of TBOT and 60 mL of deionized water were sequentially added to the solution. After stirring for 30 min at room temperature, the mixture was transferred to a 100 mL polytetrafluoroethylene (PTFE)-lined autoclave and further hydrothermally treated at 150 °C for 10 h. Finally, the reaction product was purified by washing with deionized water and ethanol at least three times. After being air-dried at 80 °C, the composite sample of WO3–TiO2 was obtained via annealing at 400 °C in a muffle furnace. The prepared sample was marked as TW.2.3 Fabrication of Pt@WO3–TiO2
Pt NPs were decorated on the TW surface using a water bath after synthesizing the Pt NPs by a hydrothermal method. 30 mg of K2PtCl6 was dispersed in 30 mL of deionized water and 10 mL of C2H6O2 by ultrasonication. After ultrasonication for 0.5 h, the mixture was continuously magnetically stirred for 2 h at 80 °C in a water bath. Subsequently, the solution was transferred to a hydrothermal reactor and heated to 180 °C for 12 h. After cooling to room temperature, the solution was centrifuged for 10 min, and resulting Pt nanoparticles were stored in ethanol. Next, 0.1 g of as-provided TW powder and the Pt NPs were combined, and ethanol was added to the solution until the volume reached 40 mL. After stirring magnetically for 4 h, the precipitate was purified by washing with deionized water and ethanol at least three times to obtain the TW samples decorated with Pt NPs. Nanomaterials with different Pt contents (1.95 mg, 19.5 mg, and 78 mg) were labeled as Pt@TW-1, Pt@TW-2, and Pt@TW-3, respectively.2.4 Characterization
The morphology and crystallographic structure were determined using scanning electron microscopy (SEM, FEI Sirion 200) and transmission electron microscopy (TEM, JEM-2100F). X-ray diffraction (XRD, Bruker D8 Advance) was used to characterize the chemical compositions. X-ray photoelectron spectroscopy (XPS, ESCALAB 250Xi, Thermo Scientific) was employed to determine the valence states of ions, using monochromatic Al Kα Alpha 1486.6 eV radiation. The BET specific surface area and BJH pore size distribution were recorded using an ASAP2460 surface area analyzer, with nitrogen adsorption at liquid nitrogen temperature.2.5 Sensor manufacture and gas detection
A certain amount of the prepared samples was dispersed into 5 mL of ethanol to form a paste. Then, the paste was coated onto an alumina tube as a sensing element. Physical images of composite materials and a tubular element are presented in ESI Fig. S1.† The gas-sensing tests were performed using a testing system (WS-30A, Weisheng Electronic Technology Co. Ltd, PR China). After NH3 gas was injected into the closed chamber, the resistance change of the gas sensor was recorded. The response of the gas sensor was calculated as follows:where Ra represents the end voltage of the sensor in air, and Rg represents the end voltage of the sensor in the target gas environment. The response and recovery times refer to the time required for a 90% change in total voltage. All testing results were obtained at 65% relative humidity.
3 Results and discussion
3.1 Sample characterization
The morphology and structure of WO3, TW, and Pt@TW-2 samples were characterized systematically through SEM, TEM and EDS images. Fig. 2(a) shows that pure WO3 Ncs feature cubic or quasi-cubic shapes with sizes ranging from 80 to 150 nm and have smooth and flat surfaces. TiO2 NPs are dispersed randomly and anchored on the surface of the WO3 Ncs, as shown in Fig. 2(b). The combination of the WO3 Ncs and TiO2 NPs implies that the WO3 Ncs could provide more defects and chemically active sites for the adsorption of surface gas molecules.9 After being decorated with the Pt NPs, the Pt@TW-2 sample shown in Fig. 2(c) exhibits little distinction under SEM characterization compared to the TW sample in Fig. 2(b). We attribute this lack of differentiation to the low Pt content.25 The SEM images of the Pt@TW-1 and Pt@TW-3 samples, as well as TEM results for the pure WO3 and TW materials, are shown in ESI Fig. S2.†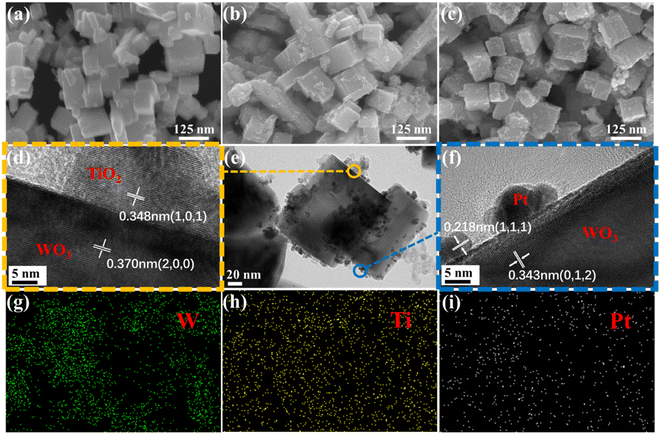 | ||
| Fig. 2 SEM images of (a) WO3, (b) TW, and (c) Pt@TW-2. (d–f) TEM images of Pt@TW-2 and (g–i) EDS elemental mapping of Pt@TW-2. | ||
To further observe their structural features, we selected the Pt@TW-2 sample to obtain TEM and element mapping images (see Fig. 2(d–i)). In Fig. 2(e), TiO2 and Pt nanoparticles enriched on the crystal surface can be observed on the WO3 Ncs, which is consistent with SEM results in Fig. 2(b). Simultaneously, Pt attachment to the surface of the material is evidenced by quantum dots, as indicated in Fig. 2(f). In Fig. 2(d) and (f), the interplanar distances of 0.370 nm and 0.343 nm precisely correspond to bulk WO3 (200) and (012), respectively, while fringe spacings of 0.348 nm and 0.218 nm match well with the (101) crystal face of TiO2 and (111) crystal face of Pt, respectively. Furthermore, Fig. 2(d) illustrates the close integration of WO3 and TiO2, facilitating the formation of a heterojunction. Semiconductor heterojunction structures can enhance the separation and transfer performance of electrons and holes, contributing to improved sensitivity for the gas sensors.
Moreover, energy-dispersive spectroscopy (EDS) spectra were used for the elemental analysis of the Pt@TW-2 sample, as shown in ESI Fig. S3.† The results confirm the coexistence of Ti, W, and Pt elements. The EDS elemental maps clearly delineate the distribution of W, Ti, and Pt elements within the Pt@TW-2 sample (see Fig. 2(g–i)). These findings unequivocally demonstrate the uniform adsorption of the Pt NPs on the surface of the TW composite structure.
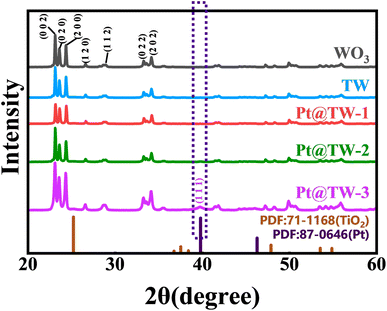
The crystal structure and composition of the prepared WO3, TW, Pt@TW-1, Pt@TW-2 and Pt@TW-3 samples were characterized using X-ray diffraction (XRD), as depicted in Fig. 3. All of the samples exhibit diffraction peaks for WO3 (JCPDS no. 71-2141).26 The Pt@TW-3 sample displays diffraction peaks at 25.21° corresponding to the (101) crystal face of anatase TiO2 (JCPDS no. 71-1168).27 In Fig. 3, the peaks of anatase TiO2 cannot be found for the TW, Pt@TW-1 and Pt@TW-2 samples, which is likely due to the peak being overwhelmed by the strong peak from the WO3 Ncs. Simultaneously, diffraction peaks observed at 39.79°, 46.28°, 67.53°, and 81.34° in the Pt@TW-1, Pt@TW-2, and Pt@TW-3 samples, respectively, correspond to the (111), (200), (220), and (311) crystal planes of the Pt NPs (JCPDS no. 87-0646),28 and the intensity of the crystal face (111) of Pt increased with increasing Pt content. The Pt@TW samples have diffraction peaks attributable to WO3, anatase TiO2, and the Pt NPs, indicating that the phase composition of the Pt@TW samples consists of a mixture of TiO2, WO3, and Pt. At the same time, no additional impurity peaks were detected in the XRD analysis, suggesting chemical compatibility among all components.24
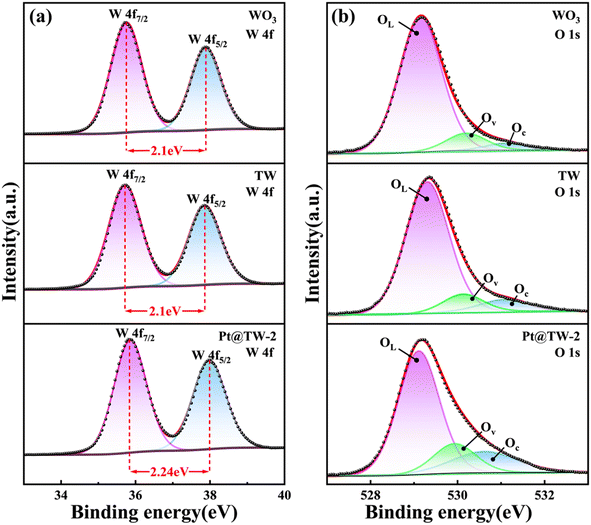
The chemical states of elements (W, Ti, and O) in the WO3, TW and Pt@TW-2 samples were analyzed using X-ray photoelectron spectroscopy (XPS), as shown in Fig. 4 and ESI Fig. S4.† The black dotted lines represent raw XPS curves, while red lines depict smoothed fitting results. From comprehensive XPS survey spectra (see Fig. S4(b–e)),† elements C, W, Ti, and O are observed in the TW and Pt@TW samples. In addition, the Pt@TW samples reveal the additional presence of Pt. The appearance of the C element is attributed to exposure to ambient air.29 The W 4f binding energy curve consists of three pairs of characteristic peaks, as shown in Fig. 4(a). For WO3, the W 4f7/2 and W 4f5/2 doublet components are located at 35.75 eV and 37.85 eV, respectively, with a peak separation of approximately 2.1 eV. While the peak separation for the TW sample does not significantly differ from WO3, the Pt@TW-2 sample demonstrates a slightly increased peak separation of 2.24 eV, and the doublet centers are at 35.78 eV and 38.02 eV, respectively. These indicate the presence of W6+ in all the samples,30 with the small difference in peak separation between the WO3 and Pt@TW-2 samples attributed to the surface modification by the Pt NPs.31 Ti 2p binding energy curves exhibit two pairs of double peaks, as shown in Fig. S4(f) and (g).† These double peaks correspond to Ti 2p3/2 and Ti 2p1/2 orbitals of TiO2, indicating the presence of Ti4+ in the TW and Pt@TW-2 samples.32 In Fig. 4(b), the O 1s spectra of all the samples are decomposed into three characteristic peaks, where OL, Ov, and Oc represent lattice oxygen, oxygen vacancies or defects, and surface oxygen free radicals, respectively.33 Compared to the WO3 Ncs, the concentrations of OL, Ov, and Oc in Pt@TW-2 have changed from 84.7%, 11%, and 4.3% to 70.9%, 17%, and 12.1%, respectively. This suggests that the Pt@TW-2 sample contains more surface oxygen, which is conducive to the adsorption of target gas molecules and enhanced performance of the gas sensor.34 The well-dispersed Pt NPs effectively enhance the oxygen dissociation capability on the surface of the WO3 Ncs.
3.2 Gas-sensing properties
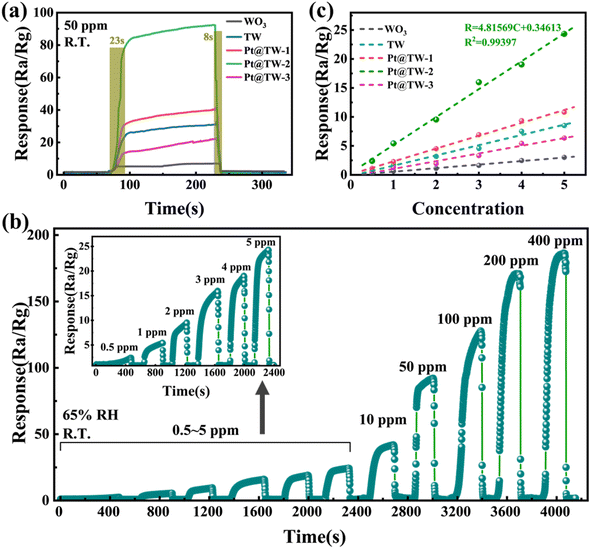
The dynamic sensing properties of the different sensors in the presence of 50 ppm NH3 are compared in Fig. 5(a). The results indicate that the resistance sharply decreases when the gas sensors are exposed to NH3 vapor. Subsequently, the current sharply recovers to the initial value when NH3 is rapidly exhausted. This behavior is consistent with the sensing characteristics of n-type semiconductor sensors.35 From detection results, the Pt@TW-2 gas sensor exhibits the highest response to NH3, with a maximum value of approximately 92.28 in the presence of 50 ppm NH3 at room temperature. Additionally, the response/recovery time of the Pt@TW-2 sensor was evaluated under same conditions. The Pt@TW-2 gas sensor demonstrated an improved speed (23 s/8 s) towards 50 ppm NH3 at room temperature. The enhanced sensing properties of Pt@TW are attributed to the synergistic effects of oxide heterojunctions and noble metals.36 Notably, the response of the Pt@TW-3 sensor is lower than that of the TW sensor, which is attributed to the excessive metal modification, which probably reduces the contact area between the material and target gas.25The real-time response variation of the Pt@TW-2 gas sensor at room temperature under different NH3 concentrations is shown in Fig. 5(b). The gas sensor exhibits a stable response from 0.5 to 400 ppm NH3, possibly benefitting from the small particle size effect.20 Additionally, the Pt@TW-2 sensor reaches a response of 2.4 in the presence of 0.5 ppm NH3 at room temperature. The fitting curves depicting the sensing response under 0.5–5 ppm NH3 for all the samples at room temperature are presented in Fig. 5(c). The results indicate that all of the sensors exhibit high sensitivity for NH3 gas detection and fine linearity, which favor quantitative analysis of gas concentrations.37 Specifically, the curve for Pt@TW-2 clearly demonstrates the steepest slope with the relationship R = 4.81569C + 0.34613 (R2 = 0.99397), where R2 represents the degree of fit of a linear regression model to the data variation. According to the fitting curve in Fig. 5(c), the detection limit of the Pt@TW-2 sensor is 75 ppb. The extremely low detection limit is advantageous for the practical application of the NH3 gas sensor in real-world environments.
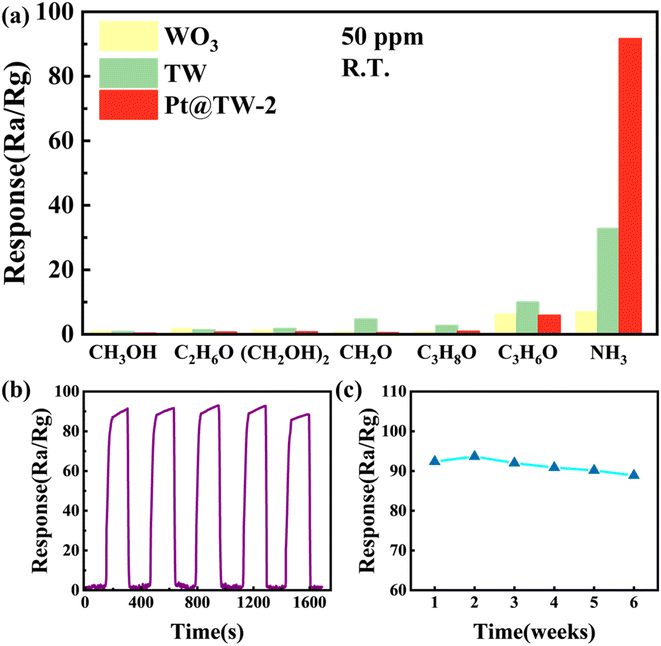
The selectivity of the WO3, TW and Pt@TW-2 sensors was studied by measuring their responses to NH3 and five interfering gases, including methanol (CH3OH), ethanol (C2H6O), ethylene glycol ((CH2OH)2), formaldehyde (CH2O), isopropanol (C3H8O) and acetone (C3H6O), as illustrated in Fig. 6(a). Besides, test results for the Pt@TW-1 and Pt@TW-3 samples are displayed in ESI Fig. S5.† At room temperature, the sensor's response to 50 ppm NH3 is approximately 92.28, which significantly exceeds its response to 50 ppm of the other gases. Therefore, compared to the other gases, the Pt@TW-2 sensor demonstrates higher sensitivity to NH3, and its selectivity for NH3 surpasses that of the WO3 and TW samples, indicating that Pt@TW-2 exhibits enhanced selectivity towards NH3 in the presence of interfering gases. These results suggest that WO3–TiO2 modified with the Pt NPs could play a significant role in future NH3 gas detection scenarios.38
Fig. 6(b) displays the real-time dynamic response curve of the Pt@TW-2 sensor to 50 ppm NH3. Over five cycles, the Pt@TW-2 sensor maintains a consistent maximum response value of approximately 90, indicating its exceptional repeatability. In Fig. 6(c), the long-term stability testing of the Pt@TW-2 sensor's response to 50 ppm NH3 at room temperature is shown over 6 weeks with weekly testing intervals. The results reveal that the response of the Pt@TW-2 sensor fluctuates by less than 3% relative to the initial peak value over 6 weeks, confirming its long-term stability. Such repeatability and stability further enhance the practical applicability of the Pt@TW material.39
The performance of some previously reported NH3 gas sensors at room temperature is compared in Table 1. In contrast to prior studies, this paper introduces an NH3 sensor based on Pt-doped WO3–TiO2 material, offering a reduced detection limit (0.075 ppm) and faster response/recovery times (23 s/8 s). Hence, it stands as a promising contender for practical room-temperature NH3 sensing applications.40–43
| Materials | Temperature (°C) | Concentration (ppm) | Response (Ra/Rg) | Response/recovery time (s) | Reference |
|---|---|---|---|---|---|
| Ti3C2Tx–TiO2 | RT | 10 | 1.03 | 33/277 | 40 |
| SnO2–MoS2 | RT | 100 | 8.6 | 6/121 | 7 |
| CuSbS2QDs/rGO | RT | 50 | 1.22 | 50/115 | 41 |
| Amino acids-PANI | RT | 16 | 6.23 | ND | 3 |
| MoO3−x/E Galn | RT | 50 | 1.22 | ND | 42 |
| CeO2 | RT | 500 | 22 | 3/116 | 43 |
| Ce–TiO2 | RT | 20 | 23.99 | 25/272 | 32 |
| PtNps@TiO2–WO3 | RT | 50 | 92.28 | 23/8 | This work |
3.3 Gas-sensing mechanism
The enhanced sensing mechanism of the WO3 Ncs modified with the Pt and TiO2 NPs is discussed, based on comprehensive testing results. For the pure WO3 Ncs, the change of resistance in NH3 is induced by the absorption of oxygen to the material surface.44 When air is purged on the gas sensor at room temperature, oxygen molecules bind to the surface of the WO3 Ncs and are then ionized to Oδ− (e.g., O2−, O−, and O2−).45 The adsorption process for Oδ− traps a significant number of electrons from the conduction band of the semiconductor material and forms positively charged ionized donors, which establishes space charge layers at grain boundaries.46 Grain boundary potential barriers will prevent electrons from transferring, leading to an increase in the WO3 resistance.47 When the sensor is exposed to NH3 gas by static volumetric method, Oδ− on the surface interacts with NH3 in a redox reaction, releasing captured electrons back into WO3.48 The electrons are transported smoothly out as the thickness of the space charge layers and barrier height decrease, thereby recovering the resistance of the material.49,50 NH3 molecules react with oxygen ions on the surface according to the following reaction:| 2NH3 (gas) + 5Oδ− (ads) → 3H2O (gas) + 2NO (gas) + 5δe− | (1) |
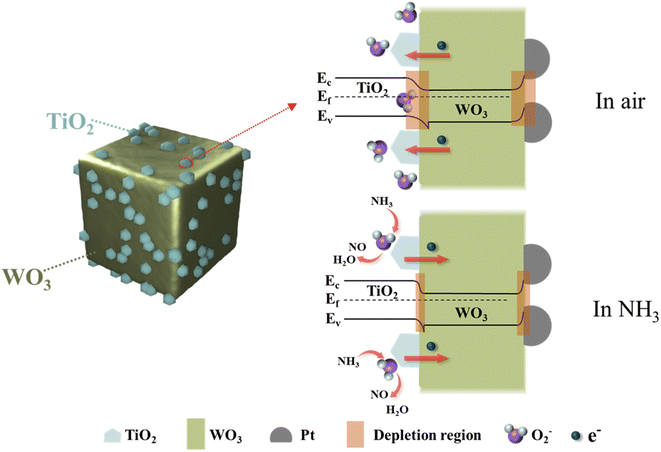
For the TW sensor, the enhancement of the NH3 sensing performance due to TiO2 decoration is attributed to the heterojunction effect between different semiconductor materials.14 As shown in Fig. 7, when the WO3 Ncs are in contact with TiO2 NPs, electrons are transferred from the region with a higher Fermi level (TiO2) to that with a lower Fermi level (WO3) until equilibrium is attained. Simultaneously, energy bands on each side of the interface are bent, forming a potential barrier. Consequently, the electron transport channel narrows, and a depletion region is generated at the interface (highlighted in orange in Fig. 7), which results in a heterojunction.51 Upon oxygen adsorption by the heterojunction material surface from air, the effective cross-sectional area for charge radial transport decreases significantly, which causes the electron transport channel to be obstructed, resulting in a pronounced increase in the baseline resistance of the sensor. When the heterojunction is exposed to NH3 gas, NH3 reacts with TiO2 to form TiNxO1−x directly,52 which breaks down the WO3–TiO2 heterojunction. The phase transformation during the entire reaction process proceeds in the following order: TiO2 → TiNxO1−x. These factors indirectly contribute to the reduction in the material's resistance upon NH3 exposure, thereby enhancing the sensor's response.37
Despite achieving an enhanced response to NH3 through TiO2 doping, the response of the TW sensor remains relatively poor. In comparison, a significant improvement in the NH3 gas-sensing response was observed after modification with the Pt NPs. The sensitizing effect of the Pt NPs on the material is analogous to that of TiO2 and can be explained by the space charge layer theory.38 As illustrated in Fig. 7, when the Pt NPs and TiO2 are modified on the surface of WO3, electrons transfer from WO3 to TiO2 and Pt, forming Schottky barriers and space charge layers.53 As mentioned before, the oxygen adsorption process in air further widens the depletion layer. Owing to the hindering effect of the Schottky barrier, the initial resistance of the sensor increases correspondingly. Upon exposure to NH3, the electrons will return to the conduction band after a reaction occurs between NH3 and O2−. As a result, the space charge layer narrows, leading to a rapid decrease in resistance.49
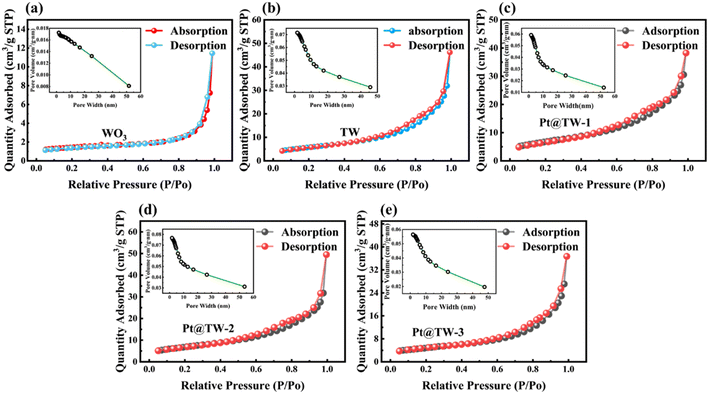
Fig. 8 and Table 2 present BET and BJH analysis results for all of the prepared samples. The plots indicate that the BET surface area of the materials increases by approximately five-to-six times after modification, increasing from 4.79 m2 g−1 to 24.49 m2 g−1. Moreover, the BJH desorption cumulative volume of pores expands from 0.017 cm3 g−1 to 0.071 cm3 g−1 and 0.077 cm3 g−1, approximately four times that of the pure WO3 sample. Additionally, decoration with TiO2 and the Pt NPs increased the specific surface area of the material and quantity of oxygen vacancies. The increased specific surface area facilitates a greater proportion of adsorbed oxygen content, offering more active sites for redox reactions.40 Oxygen vacancies are also pivotal in the gas-sensing process and performance, as they facilitate gas adsorption and activation in nanoscale metal oxides, thereby improving room-temperature gas-sensing properties.54 Simultaneously, the TW and Pt@TW-2 samples exhibit more surface oxygen vacancies compared to pure WO3, as confirmed by XPS spectra.
| Sample | BET surface area (m2 g−1) | BJH volume (cm3 g−1) |
|---|---|---|
| WO3 | 4.79 | 0.017 |
| TW | 20.55 | 0.071 |
| Pt@TW-1 | 23.192 | 0.059 |
| Pt@TW-2 | 24.49 | 0.077 |
| Pt@TW-3 | 16.98 | 0.057 |
4 Conclusions
A high-performance gas sensor for detecting NH3 gas at room temperature has been achieved on nanocubic WO3 modified with TiO2 and Pt NPs through a two-step hydrothermal method. The enhancement of the room-temperature NH3 gas-sensing performance of the Pt@TW sensor is caused by the spatial charge layer effect and oxygen vacancy defects on the WO3 surface. Following modification with 10 at% Pt, the sensing material exhibits a response of 92.28 to 50 ppm NH3 and a good linear relationship between response and concentration at room temperature, with a rapid response and recovery time (23 s/8 s) and great gas selectivity, featuring a detection limit below 0.1 ppm. The Pt@WO3–TiO2 material demonstrates enhanced performance and ambient-temperature response compared to previously reported sensors, but further efforts are needed to integrate and miniaturize gas-sensing modules. It is expected that excellent sensing properties at room temperature are promising for practical NH3 gas detection and offer a constructive approach for furthering the development of Internet of Things (LOT) sensors.Author contributions
Zhixuan Wu: data curation: lead; investigation: lead; writing – original draft: equal; writing – review & editing: equal. Zhengai Chen: data curation: supporting; investigation: supporting. Zhixiang Deng: data curation: supporting. Ning Dai: funding acquisition: supporting; writing – review & editing: supporting. Yan Sun: data curation: equal; funding acquisition: lead; supervision: equal; writing – review & editing: lead. Meiying Ge: data curation: equal; visualization: supporting; writing – review & editing: equal.Conflicts of interest
There are no conflicts to declare.Acknowledgements
This research was funded by the National Natural Science Foundation of China (11933006 and U2141240) and Shanghai Science and Technology Committee (23ZR1473300).References
- A. T. Güntner, M. Righettoni and S. E. Pratsinis, Sens. Actuators, B, 2016, 223, 266–273 CrossRef.
- C. Liu, H. Tai, P. Zhang, Z. Yuan, X. Du, G. Xie and Y. Jiang, Sens. Actuators, B, 2018, 261, 587–597 CrossRef CAS.
- B. Li, Y. Li and P. Ma, Org. Electron., 2023, 122, 106907 CrossRef CAS.
- Y. Wang, J. Liu, X. Cui, Y. Gao, J. Ma, Y. Sun, P. Sun, F. Liu, X. Liang, T. Zhang and G. Lu, Sens. Actuators, B, 2017, 238, 473–481 CrossRef CAS.
- W. Lu and D. Zhu, Appl. Phys., 2019, 125, 68 CrossRef.
- J. Bai, Y. Shen, S. Zhao, Y. Chen, G. Li, C. Han, D. Wei, Z. Yuan and F. Meng, Sens. Actuators, B, 2022, 353, 131191 CrossRef CAS.
- H. T. Nha, P. Van Tong, N. Van Duy, C. M. Hung and N. D. Hoa, J. Electron. Mater., 2021, 50, 2767–2778 CrossRef CAS.
- M. V. Nikolic, V. Milovanovic, Z. Z. Vasiljevic and Z. Stamenkovic, Sensors, 2020, 20, 6694 CrossRef CAS PubMed.
- C. Cheng, H. Zhang, F. Li, S. Yu and Y. Chen, Mater. Chem. Phys., 2021, 273, 125098 CrossRef CAS.
- P. K. Anusha, P. Poornesh, S. Chattopadhyay, A. Rao and S. D. Kulkarni, Micromachines, 2023, 14, 732 CrossRef PubMed.
- K. P. Yuan, L. Y. Zhu, J. H. Yang, C. Z. Hang, J. J. Tao, H. P. Ma, A. Q. Jiang, D. W. Zhang and H. L. Lu, J. Colloid Interface Sci., 2020, 568, 81–88 CrossRef CAS PubMed.
- C. Dong, R. Zhao, L. Yao, Y. Ran, X. Zhang and Y. Wang, J. Alloys Compd., 2020, 820, 153194 CrossRef CAS.
- Y. Cai and H. Fan, CrystEngComm, 2013, 15, 9148–9153 RSC.
- J. Hu, X. Xiong, W. Guan, H. Long, L. Zhang and H. Wang, Sens. Actuators, B, 2022, 361, 131705 CrossRef CAS.
- C. Zhang, G. Liu, X. Geng, K. Wu and M. Debliquy, Sens. Actuators, A, 2020, 309, 112026 CrossRef CAS.
- M. Pi, L. Zheng, H. Luo, S. Duan, C. Li, J. Yang, D. Zhang and S. Chen, J. Phys. D: Appl. Phys., 2021, 54, 155107 CrossRef CAS.
- W. J. Yan and M. Hu, Nano, 2018, 13, 6 Search PubMed.
- N. X. Thai, N. Van Duy, N. Van Toan, C. M. Hung, N. Van Hieu and N. D. Hoa, Int. J. Hydrogen Energy, 2020, 45, 2418–2428 CrossRef CAS.
- Y. Wang, T. Wu, Y. Zhou, C. Meng, W. Zhu and L. Liu, Sensors, 2017, 17, 1971 CrossRef PubMed.
- H. Li, C.-H. Wu, Y.-C. Liu, S.-H. Yuan, Z.-X. Chiang, S. Zhang and R.-J. Wu, Sens. Actuators, B, 2021, 341, 130035 CrossRef CAS.
- M. Kumaresan, M. Venkatachalam, M. Saroja and P. Gowthaman, Inorg. Chem. Commun., 2021, 129, 108663 CrossRef CAS.
- V. Galstyan, N. Poli, V. Golovanov, A. D’Arco, S. Macis, S. Lupi, E. Bolli, S. Kaciulis, A. Mezzi and E. Comini, Adv. Mater. Technol., 2022, 7, 2201751 CrossRef CAS.
- B. Abdikadyr, A. Kilic, O. Alev, S. Buyukkose and Z. Z. Ozturk, Turk. J. Chem., 2021, 45, 295–306 CrossRef CAS PubMed.
- F. Peng, Y. Sun, W. Yu, Y. Lu, J. Hao, R. Cong, J. Shi, M. Ge and N. Dai, Nanomaterials, 2020, 10, 1162 CrossRef CAS PubMed.
- H. Zhang, L. Wang, Y. Zou, Y. Li, J. Xuan, X. Wang, F. Jia, G. Yin and M. Sun, Nanotechnology, 2023, 34, 205501 CrossRef PubMed.
- K. Sun, Q. Lu, C. Ma and M. Wei, Mater. Lett., 2019, 236, 267–270 Search PubMed.
- Z. Yang, L. Li, X. Liu, X. Yang, H. Xiong, R. Zhang, Z. Jiang and T. Fang, Chem. Eng. J., 2023, 474, 145896 CrossRef CAS.
- H. Peng, J. Ren, Y. Wang, Y. Xiong, Q. Wang, Q. Li, X. Zhao, L. Zhan, L. Zheng, Y. Tang and Y. Lei, Nano Energy, 2021, 88, 106307 CrossRef CAS.
- J. Hwang, H. Jung, H.-S. Shin, D.-S. Kim, D. S. Kim, B.-K. Ju and M. Chun, Appl. Sci., 2021, 11, 4903 CrossRef CAS.
- Z. Shen, Z. Zhao, J. Qian, Z. Peng and X. Fu, J. Mater. Res., 2016, 31, 1065–1076 CrossRef CAS.
- J. Xuan, G. Zhao, Q. Gong, L. Wang, J. Ren, M. Sun, T. Zhou, F. Xing, G. Yin and B. Liu, J. Alloys Compd., 2021, 860, 158499 CrossRef CAS.
- N. Mintcheva, P. Srinivasan, J. B. B. Rayappan, A. A. Kuchmizhak, S. Gurbatov and S. A. Kulinich, Appl. Surf. Sci., 2020, 507, 145169 CrossRef CAS.
- K. Wu, M. Debliquy and C. Zhang, Chem. Eng. J., 2022, 444, 136449 CrossRef CAS.
- J. Zhou, M. Ikram, A. U. Rehman, J. Wang, Y. Zhao, K. Kan, W. Zhang, F. Raziq, L. Li and K. Shi, Sens. Actuators, B, 2018, 255, 1819–1830 CrossRef CAS.
- H. Chai, Z. Zheng, K. Liu, J. Xu, K. Wu, Y. Luo, H. Liao, M. Debliquy and C. Zhang, IEEE Sens. J., 2022, 22, 5470–5481 CAS.
- L.-Y. Gai, R.-P. Lai, X.-H. Dong, X. Wu, Q.-T. Luan, J. Wang, H.-F. Lin, W.-H. Ding, G.-L. Wu and W.-F. Xie, Rare Met., 2022, 41, 1818–1842 CrossRef CAS.
- Q. Wang, X. Kou, C. Liu, L. Zhao, T. Lin, F. Liu, X. Yang, J. Lin and G. Lu, J. Colloid Interface Sci., 2018, 513, 760–766 CrossRef CAS PubMed.
- J. Liu, L. Zhang, J. Fan, B. Zhu and J. Yu, Sens. Actuators, B, 2021, 331, 129425 CrossRef CAS.
- S. Zhang, M. Yang, K. Liang, A. Turak, B. Zhang, D. Meng, C. Wang, F. Qu, W. Cheng and M. Yang, Sens. Actuators, B, 2019, 290, 59–67 CrossRef CAS.
- H. Tai, Z. Duan, Z. He, X. Li, J. Xu, B. Liu and Y. Jiang, Sens. Actuators, B, 2019, 298, 126874 CrossRef CAS.
- Y. Liu, H. Wang, K. Chen, T. Yang, S. Yang and W. Chen, ACS Appl. Mater. Interfaces, 2019, 11, 9573–9582 CrossRef CAS PubMed.
- X. X. Wang, Z. Li, Y. Yang, T. Tang, Y. F. Cheng, K. Xu, H. G. Xie, Y. L. Chen, L. Cheng, X. W. Tao, B. Y. Zhang, B. Y. Ren and J. Z. Ou, J. Alloys Compd., 2023, 939, 168690 CrossRef CAS.
- P. Li, B. Wang, C. Qin, C. Han, L. Sun and Y. Wang, Ceram. Int., 2020, 46, 19232–19240 CrossRef CAS.
- Z. Wang, L. Zhu, J. Wang, R. Zhuang, P. Mu, J. Wang and W. Yan, RSC Adv., 2022, 12, 24614–24632 RSC.
- D. Kohl, Sens. Actuators, 1989, 18, 71–113 CrossRef CAS.
- M. Gupta, H. F. Hawari, P. Kumar, Z. A. Burhanudin and N. Tansu, Nanomaterials, 2021, 11, 623 CrossRef CAS PubMed.
- M. Gupta, N. Athirah and H. Fahmi Hawari, Indones. J. Electrical Eng. Comput. Sci., 2020, 18, 1279–1286 Search PubMed.
- N. Hikmah, H. F. Hawari and M. Gupta, Indones. J. Electrical Eng. Comput. Sci., 2020, 19, 119–125 Search PubMed.
- C. A. Betty, S. Choudhury and A. Shah, Surf. Interfaces, 2023, 36, 102560 CrossRef CAS.
- M. Gupta, H. Hawari, P. Kumar and Z. Burhanudin, Crystals, 2022, 12, 264 CrossRef CAS.
- S. Qin, P. Tang, Y. Feng and D. Li, Sens. Actuators, B, 2020, 309, 127801 CrossRef CAS.
- Y. Liu, Y. Wang, Y. Zhang, Z. You and X. Lv, J. Am. Ceram. Soc., 2020, 103, 3905–3916 CrossRef CAS.
- G. Zhao, J. Xuan, X. Liu, F. Jia, Y. Sun, M. Sun, G. Yin and B. Liu, Nanomaterials, 2019, 9, 435 CrossRef CAS PubMed.
- J. Wang, C. Hu, Y. Xia and B. Zhang, Sens. Actuators, B, 2021, 333, 129547 CrossRef CAS.
Footnote |
| † Electronic supplementary information (ESI) available. See DOI: https://doi.org/10.1039/d4ra00881b |
| This journal is © The Royal Society of Chemistry 2024 |

