
 Open Access Article
 This Open Access Article is licensed under a Creative Commons Attribution-Non Commercial 3.0 Unported Licence
A novel fluorescence probe for simultaneous detection of mitochondrial viscosity in hepatic ischemia reperfusion injury models†
Xue Chen‡
,
Zhelu Jiang‡,
Ziyu Wang,
Fenglin He,
Manlin Fu,
Zhenda Xie* and
Jin-Feng Hu *
*
Institute of Natural Medicine and Health Products, School of Pharmaceutical Sciences, Zhejiang Provincial Key Laboratory of Plant Evolutionary Ecology and Conservation, Taizhou University, Zhejiang 318000, China
First published on 8th April 2024
Abstract
Acute liver failure caused by hepatic ischemia reperfusion injury (HIRI) poses a severe threat to life, emphasizing the urgent need for precise and timely early diagnosis. Viscosity, a key parameter reflecting active analyte levels at the cellular level, remains underexplored in relation to HIRI. To address this gap, we have developed a groundbreaking near-infrared molecule rotator, PN, exhibiting exceptional characteristics. PN demonstrates remarkable sensitivity, with a 32-fold change in response to viscosity, ranging from PBS to glycerol solution. PN's distinctive features include maximum emission wavelength 790 nm, as well as an impressive Stokes shift 190 nm. Moreover, PN exhibits the ability to sensitively and selectively differentiate nystatin-induced viscosity changes within living cells, and can be used for the detection of viscosity changes in the HIRI mouse model. This capability enhances our understanding of cellular responses, opening avenues for potential applications within disease models. The versatility of PN extends to its potential role in guiding timely monitoring and imaging of viscosity, offering valuable insights into disease progression.
Viscosity stands as a pivotal parameter within the intracellular microenvironment, wielding significant influence over biomolecular interactions, chemical signal propagation, and metabolite diffusion.1,2 Alterations in viscosity from standard values are closely linked with various cellular dysfunctions, as well as initiation of conditions including Alzheimer's disease, hypertension, diabetes, even cancer.3–5 Hepatic ischemia–reperfusion injury (HIRI) serves as commonly encountered and almost inevitable alteration in pathophysiology, happening in the transplantation and resection of partial liver, necessitating blood flow temporary cessation to liver.6,7 HIRI can induce a range of intracellular stress responses, comprising endoplasmic reticulum/oxidative/metabolic stresses.8,9 These reactions heighten liver cells susceptibility, increasing the risk of injury and death, contributing to liver diseases including inflammatory and fibrosis alterations.10–12 In this context, HIRI early diagnosis can help to accomplish comprehensive prevention, treatment, and further reduction liver damage. Mitochondria, serving as the primary powerhouse within cells, holds a crucial responsibility in energy production.13–15 Mitochondrial dysfunction results in aberrant metabolism and macromolecular malfunction, culminating in heightened mitochondrial viscosity.16,17 Therefore, understanding the connection between mitochondrial viscosity involved in HIRI occurrence and progression is contributive for clinical research and treatment.
Currently, fluorescent imaging has garnered notable interest owing to its capability for relatively straightforward operation, high sensitivity, and real-time visualization.18–21 Therefore, the detection of intracellular viscosity with the aid of a fluorescence spectrometer may become a new-established method, potentially being used for HIRI early diagnosis. To date, considerable and outstanding results have been achieved in imaging viscosity alteration in vivo.22–26 In 2023, Zhang group reported a near-infrared fluorescence probe, designated as DPXBI. The probe demonstrated a significant increase about 10-fold in response to changes in viscosity from 1.7 cP to 965 cP.27 In 2022, Huo group reported a series of viscosity probe based on benzopyrylium unit. The Stokes shift of probe BP-III is not long as 100 nm.28 However, these probes have some limitations, such as shorter wavelengths in ultraviolet or visible light ranges, shorter stoke shift, thus could not meet the need for monitoring viscosity in living organisms. Significantly, a near-infrared probe sensitive to viscosity, featuring a substantial Stokes shift, offers the benefits of minimal background interference and negligible light damage to biological samples, making it exceptionally desirable.
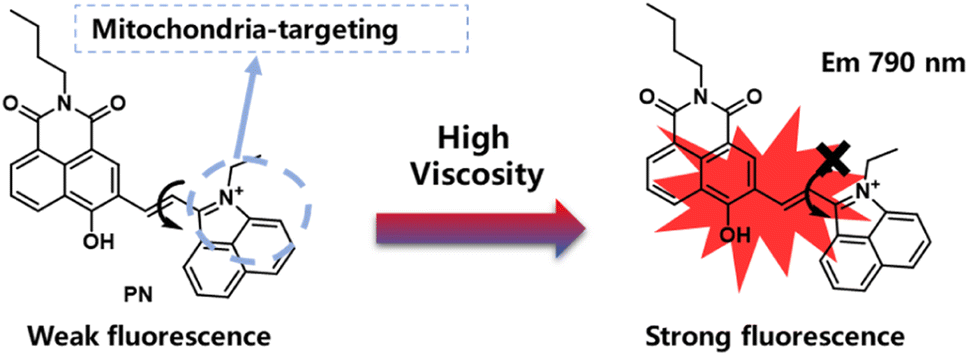
In this study, we developed a highly-sensitive near-infrared probe denoted as PN, by utilizing 1,8-naphthalimide derivative to serve as strong donor and rotor simultaneously, with benzo[c,d] indolium salt acting as electron acceptor (Scheme 1). PN showcases an impressive Stokes shift of 190 nm and displays remarkably sensitive turn-on signal responses (32-fold at 790 nm) in reaction to viscosity variations. It proves adept at accurately detecting viscosity changes even in other interfering ions. Employing PN as chemical helper, viscosity fluctuations were successfully monitored in HepG2 cells. Moreover, we validated PN practical applicability in mouse liver tissue within HIRI model. These findings indicate that PN could present a convenient and effective method with promising clinical applications.
 | ||
| Scheme 1 The structure of probes used in previous work and this work. | ||
Experimental section
Materials and apparatus
The materials and instruments utilized in this study are detailed in the ESI.†Synthesis of PN
The synthetic route of probe PN shows in Scheme S1,† the final steps are as follows: compound 1 and compound 2 were synthesized according to the previous methods.29,30 The detailed information of instruments used in this work were provided in ESI.†Compound 1 (196 mg, 1 mmol), compound 2 (297 mg, 1 mmol) and EtOH (5 mL) refluxed for 6 h at 80 °C in a 25 mL round bottomed flask with a few drops of piperidine. After cooling to room temperature, the solvent was removed under reduced pressure. Then, the crude product was purified by column chromatography using CH2Cl2/MeOH (v/v = 8![[thin space (1/6-em)]](https://www.rsc.org/images/entities/char_2009.gif) :1) to obtain PN, a purple solid (175 mg, yield 37%). 1H NMR (400 MHz, DMSO-d6): δ 10.39 (s, 1H), 8.71 (d, J = 7.3 Hz, 1H), 8.58–8.46 (m, 2H), 8.35 (d, J = 9.4 Hz, 1H), 8.17–8.04 (m, 3H), 7.84 (t, J = 7.8 Hz, 1H), 7.63 (d, J = 15.3 Hz, 1H), 6.85 (d, J = 9.3 Hz, 1H), 6.74 (s, 1H), 5.78 (s, 1H), 4.71 (d, J = 7.2 Hz, 2H), 3.57 (d, J = 7.1 Hz, 2H), 3.07 (d, J = 2.8 Hz, 7H), 1.46 (t, J = 7.1 Hz, 3H). 13C NMR (101 MHz, DMSO-d6): δ 169.46, 159.88, 154.62, 154.15, 146.59, 139.61, 135.10, 132.97, 132.35, 131.21, 130.26, 129.52, 128.56, 127.61, 124.03, 116.30, 116.02, 111.30, 108.78, 106.39, 55.45, 45.77, 45.38, 21.67, 21.58, 15.30, 13.16, 8.90. HRMS (ESI, positive ion mode) calcd for C31H27N2O3+: 475.2016, found: 475.2017.
:1) to obtain PN, a purple solid (175 mg, yield 37%). 1H NMR (400 MHz, DMSO-d6): δ 10.39 (s, 1H), 8.71 (d, J = 7.3 Hz, 1H), 8.58–8.46 (m, 2H), 8.35 (d, J = 9.4 Hz, 1H), 8.17–8.04 (m, 3H), 7.84 (t, J = 7.8 Hz, 1H), 7.63 (d, J = 15.3 Hz, 1H), 6.85 (d, J = 9.3 Hz, 1H), 6.74 (s, 1H), 5.78 (s, 1H), 4.71 (d, J = 7.2 Hz, 2H), 3.57 (d, J = 7.1 Hz, 2H), 3.07 (d, J = 2.8 Hz, 7H), 1.46 (t, J = 7.1 Hz, 3H). 13C NMR (101 MHz, DMSO-d6): δ 169.46, 159.88, 154.62, 154.15, 146.59, 139.61, 135.10, 132.97, 132.35, 131.21, 130.26, 129.52, 128.56, 127.61, 124.03, 116.30, 116.02, 111.30, 108.78, 106.39, 55.45, 45.77, 45.38, 21.67, 21.58, 15.30, 13.16, 8.90. HRMS (ESI, positive ion mode) calcd for C31H27N2O3+: 475.2016, found: 475.2017.
Fluorescence (FL) intensity imaging of viscosity in HepG2 cells
The culture of HepG2 cells relied on RPMI 1640 medium combined with fetal bovine serum (FBS, 10%), as well as 1% (v/v) penicillin–streptomycin within humidified atmosphere (37 °C, 5% CO2). Subsequently, cells were plated within culture dishes at 2.0 × 10⁴ cells per dish in growth medium. For stimulation experiments, the cells were pre-treated with nystatin at varying concentration, followed by incubation with PN (5 μM) for 30 minutes at 37 °C, respectively. Finally, the cells were washed twice with PBS, and FL imaging was captured using a confocal fluorescence microscope.Live subject statement
All experiments conducted adhered to pertinent laws and institutional protocols. Animal procedures were executed following Guidelines for Care and Use of Laboratory Animals of Taizhou University and were approved by Animal Ethics Committee of Taizhou University. Throughout all the experimental processes, diligent measures were taken to minimize any distress or suffering experienced by the animals.Results and discussion
Design strategy of PN
Probe designed for sensitivity to viscosity typically encompassed fluorophore and a rotor connected by a C![[double bond, length as m-dash]](https://www.rsc.org/images/entities/char_e001.gif) C bond, utilizing the Twisted Intramolecular Charge Transfer (TICT) mechanism. In this particular case, we expanded conjugated system to induce a red-shift in the fluorescence wavelength. Benzo[c,d]indolium was used to construct 1-ethyl-2-methylbenzo[c,d]indol-1-ium (compound 2 in Scheme S1†).31,32 Vinyl linked to naphthalimide derivatives through σ-bonds, functions as a viscosity-dependent cohort, allowing PN to signal variations in viscosity.33,34 A near-infrared with a large stroke shift (190 nm) fluorescent probe, PN, was successfully prepared and applied for bioimaging. In settings with low or non-viscous characteristics, donor cohort freely rotates around C–C bond, leading to excited state non-radiative quenching. As the solution viscosity rises, rotation becomes restricted, triggering fluorescence activation.
C bond, utilizing the Twisted Intramolecular Charge Transfer (TICT) mechanism. In this particular case, we expanded conjugated system to induce a red-shift in the fluorescence wavelength. Benzo[c,d]indolium was used to construct 1-ethyl-2-methylbenzo[c,d]indol-1-ium (compound 2 in Scheme S1†).31,32 Vinyl linked to naphthalimide derivatives through σ-bonds, functions as a viscosity-dependent cohort, allowing PN to signal variations in viscosity.33,34 A near-infrared with a large stroke shift (190 nm) fluorescent probe, PN, was successfully prepared and applied for bioimaging. In settings with low or non-viscous characteristics, donor cohort freely rotates around C–C bond, leading to excited state non-radiative quenching. As the solution viscosity rises, rotation becomes restricted, triggering fluorescence activation.
The response of PN to viscosity
Probe PN, possessing molecular rotor characteristics indicative of viscosity sensitivity, was investigated for its spectral behavior within PBS–glycerol mixtures. PN absorption maxima (λabs) at 600 nm exhibited gradual increase depending on glycerol addition (Fig. 1a). Excitation at 600 nm resulted in a turn-on fluorescence emission peak (λem) at approximately 790 nm as illustrated in Fig. 1b. Notably, PN displayed a significant viscosity-dependent response spanning from PBS (∼0.893 cP) to glycerol (∼945 cP). Fluorescent intensity at longwave of 790 nm experienced a remarkable ∼32-fold increase (upon excitation at 600 nm). Utilizing a logarithmic scale for both fluorescence intensity (log(I790nm)) and viscosity, a linear relationship (R2 = 0.9872) emerged across viscosity range of 1–458 cP (glycerol content 0–60%), as depicted in Fig. 1c. In terms of fluorescence quantum yield, a remarkable enhancement of approximately 41-fold was observed in glycerol (Φ = 0.084) in comparison with PBS (Φ = 0.002), utilizing reference rhodamine B. The enhancement augments the probe's applicability owing to its low background fluorescence. In summary, as evidenced by the data presented, PN exhibits strong and reliable response to variations within viscosity.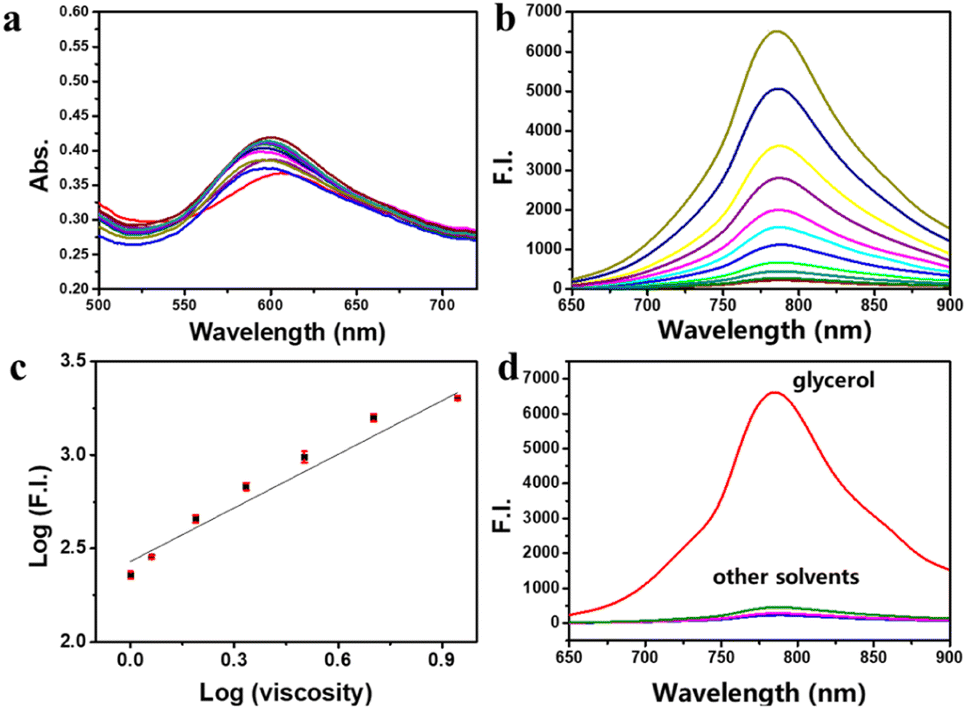 | ||
| Fig. 1 (a) and (b) The absorption and emission spectra of probe PN (10 μM) in different ratios of PBS/glycerol mixtures. (c) The linear relationship among log(I790) and log(viscosity) plot (glycerol content 0–60%). R2 = 0.9872. (d) The fluorescence spectra of probe PN (10 μM) in various solvents with different polarities. Ex = 600 nm. | ||
Evaluating the selectivity of PN towards viscosity
Selectivity evaluation is imperative for assessing fluorescent probe performance, addressing both probe specificity and potential interference from diverse cellular parts. Subsequently, researchers tested solvent polarity impact on PN probe using different solvents (glycerol, DMF, DCM, THF, ACN, dioxane, MeOH, DMSO). As depicted in Fig. 1d, fluorescence intensity of PN significantly surpassed glycerol at 790 nm compared to lower-polarity solvents, such as DCM. These results underscore solvent polarity's negligible influence on probe PN's fluorescence properties.To ascertain probe PN selectivity for viscosity detection, we systematically explored its response at varying pH levels. The probe was introduced into PBS buffer in pH 4.1–10.2, and the resulting fluorescence intensity changes were illustrated in Fig. S1† (with 600 nm excitation and 790 nm emission). Notably, fluorescence intensity remained nearly constant across entire pH spectrum, signifying the robust photostability of PN in the face of pH fluctuations. Furthermore, photobleaching behavior of PN in glycerol was investigated under continuous irradiation with 660 nm (300 mW cm−2) for 1200 s (Fig. S2†). Even after continuous exposure to 660 nm laser irradiation, PN showed no significant photobleaching, indicating its excellent photostability.
Further investigations were conducted to evaluate the probe's response to high concentrations of interfering ions and disruptors, encompassing biological reactive sulfur species (RSS) such as Hcy, Cys, SO32−, GSH, and reactive oxygen species (ROS), such as HOCl, H2O2 (concentration at 1 mM), along with various anions. Fig. S3† demonstrates that probe PN fluorescence intensity within PBS solution remained consistent, even in increased concentrations of interfering ions, suggesting minimal interference with the probe's performance. Remarkably, within PBS/glycerol (v:v = 1:1) mixture, probe PN exhibited remarkable stability to corresponding ions. This suggests the potential of probe PN for monitoring viscosity changes in complex cellular environments, thereby broadening its applicability.
Intracellular fluorescence imaging
To evaluate PN biological safety, we conducted 2,5-diphenyl-2H-tetrazolium bromide (MTT) test initially to assess HepG2 cells cytotoxicity. As depicted in Fig. S4,† HepG2 cells exhibited sustained higher viability even after 24 hours of exposure to PN at varying densities (0, 1, 2, 5, 10, and 20 μM). This result underscores the outstanding biocompatibility of the PN probe, making it well-suited for applications in live cell imaging.Considering the remarkable properties of PN outlined above, we explored fluorescence imaging utility for detecting subcellular viscosity alterations. HepG2 cells were co-stained with PN and mitochondrial tracking green/lysosomal tracking green, respectively (Fig. 2a). The fluorescence spectrum of PN exhibited a notable overlap with that of MitoTracker Green, demonstrating a high Pearson's correlation coefficient of 0.97 (Fig. 2d). In contrast, the correlation coefficient between PN and LysoTracker Green was comparatively lower at 0.24. This enhanced specificity towards mitochondria renders PN particularly appealing for imaging applications aimed at comprehending HIRI-associated mitochondrial dysfunction.
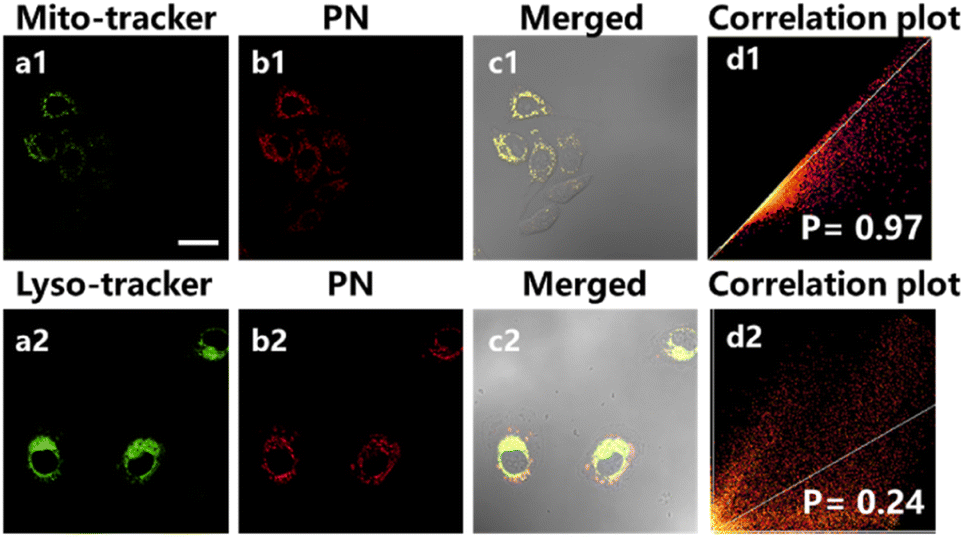 | ||
| Fig. 2 Subcellular localization in HepG2 cells using PN is depicted as follows: (a) organelle targeting dyes for the green channel (Mito-Tracker Green, 200 nM; Lyso-Tracker Green, 200 nM, Ex = 488 nm, Em = 500–550 nm), (b) co-localization images of HepG2 cells incubated with PN for the red channel (5 μM, Ex = 588 nm, Em = 700–800 nm), (c) merged images of (a) and (b). (d) Correlation plot of PN and the corresponding organelle targeting dyes. Scale bar: 20 μm. | ||
To further elucidate the capability of probe PN in monitoring intracellular viscosity changes, nystatin, being recognized as an ionophore inducing mitochondrial malfunction and subsequent increase in intracellular viscosity, was employed.35,36 HepG2 cells were segregated into 2 distinct cohorts: control and nystatin-induced group. As depicted in Fig. 3a, control group, treated exclusively with PN probe (5 μM), displayed minimal background fluorescence within red channel (700–800 nm). Oppositely, upon exposure to nystatin for 30 minutes, followed by additional 30-minute incubation with PN probe, a notable escalation in fluorescence intensity within red channel was observed. Furthermore, the quantification of mean fluorescence intensity in cell regions within red channel (Fig. 3) was conducted through Region of Interest (ROI) measurements. Nystatin-treated (20 μM) cells displayed a 1.9-fold higher fluorescence compared to non-treated cells. When the content of nystatin increased to 100 μM, the intensity of red fluorescence increased 2.68-fold. These findings unequivocally indicate that probe PN can effectively respond to viscosity alterations induced by nystatin within living cells.
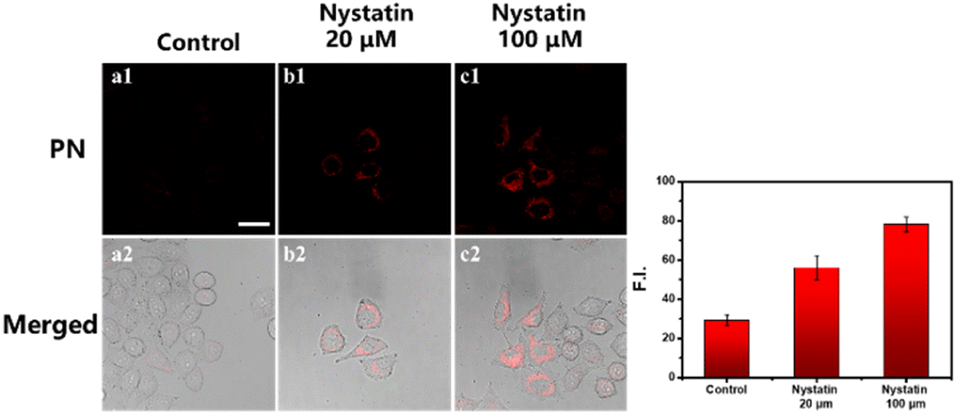 | ||
| Fig. 3 Imaging of viscosity respectively using HepG2 cells. (a) As control group, the cells are only dyed with PN (5 μM) for 30 min. (b) The cells were treated with nystatin (20 μM) for 30 min, then dyed with PN (5 μM). (c) The cells were treated with nystatin (100 μM) for 30 min, then dyed with PN (5 μM). (1) Red channel (Ex = 588 nm, Em = 700–800 nm); (2) bright field; (3) merged images of (1) and (2). Scale bar: 20 μm. | ||
Intracellular fluorescence imaging in cell model of HIRI
Inspired by the remarkable intracellular imaging prowess of PN, we delved into exploration of dynamic fluctuations in mitochondrial viscosity throughout HIRI progression. To establish the HIRI cell model, we employed a previously reported method, which involved subjecting the cells to oxygen–glucose–serum deprivation for 0–30 minutes followed by reperfusion for 41–60 minutes. As shown in Fig. 4, control group, labeled with PN, displayed minimal intensity in the red fluorescence signal with no apparent alterations. In contrast, the HIRI cohort revealed a time-dependent escalation in the red fluorescence signal, signifying an increase in mitochondrial viscosity. Particularly, cells were sent for ischemia 30 min and a subsequent 30-min reperfusion exhibited a noteworthy 2.05-fold rise in fluorescence signal compared to the control cohort. This finding indicates a significantly higher mitochondrial viscosity in HIRI hepatocytes compared to normal hepatocytes. Our observations aligned with previous reports linking hepatic oxidative stress to mitochondrial degradation dysfunction, as well as consequent hepatocellular damage. Additionally, the sensitivity of mitochondrial microenvironmental viscosity to biomacromolecule accumulation in mitochondria has been highlighted. Our results propose mitochondrial viscosity as a crucial parameter in distinguishing normal liver cells from those undergoing HIRI. PN emerges as a valuable tool for viscosity alterations real-time visual detection within HIRI, offering potential applications in clinical assessments.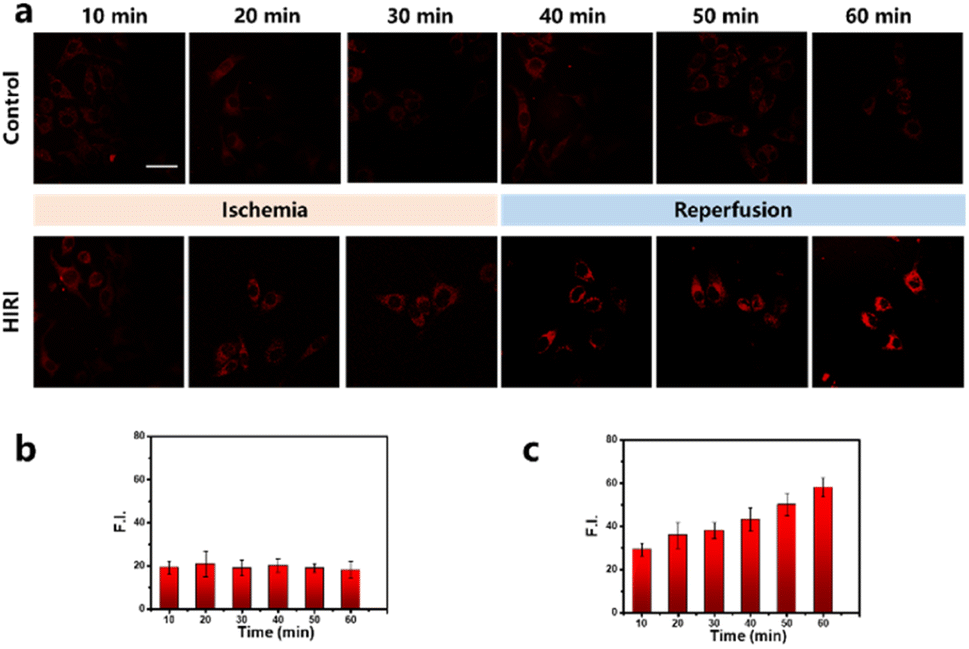 | ||
| Fig. 4 Real-time fluorescence imaging of mitochondrial viscosity in HepG2 cells during the HIRI process. (a) Fluorescence images of mitochondrial viscosity in the 5 μM PN loaded control group and the HIRI group at 10, 20, 30, 40, 50 and 60 min. Ex = 588 nm, Em = 700–800 nm. Scale bar: 20 mm. (b) Mean FL intensity output of the control group. (c) Mean FL intensity output of the HIRI group. Scale bar: 20 μm. | ||
Intracellular fluorescence imaging in mouse model of HIRI
To validate mitochondrial viscosity as HIRI diagnosis indicator, PN application for in vivo imaging and lesion localization was basing on viscosity alterations. Mice that received intravenous injections of PN were randomly assigned to HIRI and normal cohorts. Establishment of HIRI models relied on clamping hepatic arteries and portal veins with hemostatic clips for ischemia 1 h, 1 h subsequent reperfusion upon clip release.37 Both cohorts underwent NIR fluorescence in vivo imaging. Fluorescence imaging revealed a significant increase in NIR fluorescence intensity within HIRI cohort's livers compared to control cohort (Fig. 5a). Viscosity imaging allowed for differentiation of HIRI mice from normal mice based on significant fluorescence differences. H&E staining illustrated no pathological alterations within lungs, intensity notably surpassed HIRI cohort in comparison with PBS-treated mice (control cohort), indicating heightened liver viscosity in kidneys, tissues within control mice (Fig. 5b). Furthermore, fluorescence, heart, spleen, while hepatocytes of HIRI mice were significantly swollen compared to aligned PBS-treated normal liver the HIRI model cohort, correlating with severe liver damage. These findings affirm PN's capability to detect viscosity in imaging mouse HIRI model, highlighting its promising clinical potential for accurately navigating HIRI liver lesions and distinguishing HIRI tissues from normal tissues.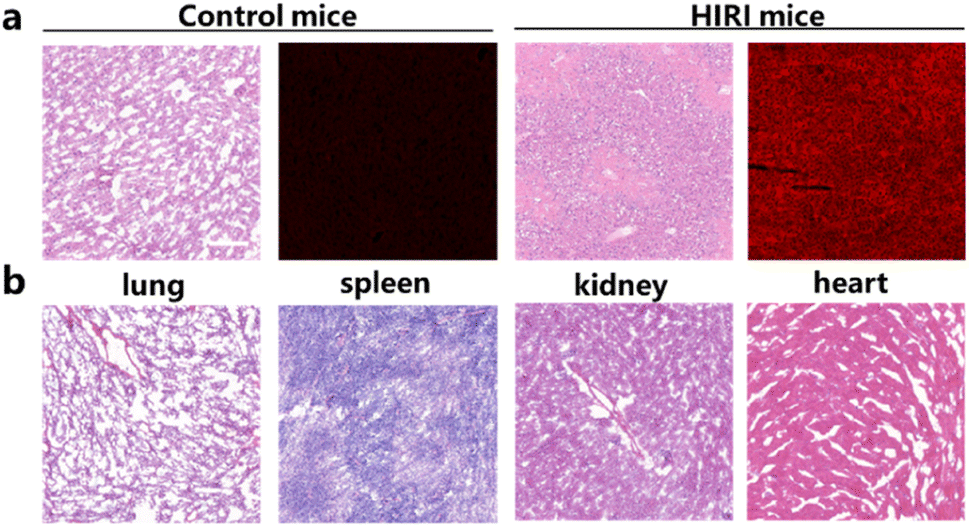 | ||
| Fig. 5 (a) H&E staining and fluorescence imaging of normal and HIRI model in mice. (b) H&E staining of lungs, spleen, kidneys, and heart tissues in HIRI mice. Scale bar: 100 μm. Red channel (Ex = 588 nm, Em = 700–800 nm). Scale bar: 100 μm. | ||
Conclusion
In summary, PN, a viscosity-activated near-infrared fluorescent probe, has been designed for viscosity monitoring. PN presents significant benefits, featuring a 32-fold fluorescence sensitivity to viscosity, strong NIR emission, precise mitochondrial targeting, as well as outstanding biocompatibility. Its superior brightness makes PN well-suited for meticulous HIRI liver lesions resection and navigation in vivo, as supported by histopathological examination. The proposed strategy based on mitochondrial viscosity holds promise for broader applications in hepatology research, providing insights into HIRI occurrence and progression. Furthermore, PN is envisioned to work pivotally in evaluating the in vivo therapeutic efficacy of HIRI drugs.Author contributions
Xue Chen: design and synthesis of the probe; Zhelu Jiang: data curation; Ziyu Wang: synthesis; Fenglin He: writing – original draft; Manlin Fu: writing; Zhenda Xie: synthesis; Jin-Feng Hu: supervision.Conflicts of interest
The authors declare no competing financial interest.Acknowledgements
We gratefully acknowledge the National Natural Science Foundation of China (No. 21937002) and the Zhejiang Provincial Natural Science Foundation of China (No. LY23H300001 and LTGD24C040004).References
- H. Li, W. Shi, X. Li, Y. Hu, Y. Fang and H. Ma, J. Am. Chem. Soc., 2019, 141, 18301–18307 CrossRef CAS PubMed.
- N. Laan, K. G. de Bruin, D. Bartolo, C. Josserand and D. Bonn, Phys. Rev. Appl., 2014, 2, 044018 CrossRef.
- I. Ferrer, J. Bioenerg. Biomembr., 2009, 41, 425–431 CrossRef CAS PubMed.
- G. V. Maksimov, O. G. Luneva, N. V. Maksimova, E. Matettuchi, E. A. Medvedev, V. Z. Pashchenko and A. B. Rubin, Bull. Exp. Biol. Med., 2005, 140, 510–513 CrossRef CAS PubMed.
- R. Mungmunpuntipantip and V. Wiwanitkit, Journal of Taibah University Medical Sciences, 2022, 17, 343–344 CrossRef PubMed.
- M. Cannistra, M. Ruggiero, A. Zullo, G. Gallelli, S. Serafini, M. Maria, A. Naso, R. Grande, R. Serra and B. Nardo, Int. J. Surg., 2016, 33, S57–S70 CrossRef PubMed.
- C. Peralta, M. B. Jimenez-Castro and J. Gracia-Sancho, Int. J. Hepatol., 2013, 59, 1094–1106 CrossRef PubMed.
- Y. Guan, W. Yao, K. Yi, C. Zheng, S. Lv, Y. Tao, Z. Hei and M. Li, Small, 2021, 17, 2007727 CrossRef CAS PubMed.
- B. Mao, W. Yuan, F. Wu, Y. Yan and B. Wang, Cell Death Discovery, 2023, 9, 115 CrossRef PubMed.
- R. G. Bardallo, A. Panisello-Rosello, S. Sanchez-Nuno, N. Alva, J. Rosello-Catafau and T. Carbonell, FEBS J., 2022, 289, 5463–5479 CrossRef PubMed.
- J. Bi, J. Zhang, Y. Ren, Z. Du, Q. Li, Y. Wang, S. Wei, L. Yang, J. Zhang, C. Liu, Y. Lv and R. Wu, Redox Biol., 2019, 20, 296–306 CrossRef CAS PubMed.
- S. Duarte, J. Saber, T. Fujii and A. J. Coito, Matrix Biol., 2015, 44, 147–156 CrossRef PubMed.
- Y. Yang, S. Karakhanova, W. Hartwig, J. G. D'Haese, P. P. Philippov, J. Werner and A. V. Bazhin, J. Cell. Physiol., 2016, 231, 2570–2581 CrossRef CAS PubMed.
- M. J. Devine and J. T. Kittler, Nat. Rev. Neurosci., 2018, 19, 63–80 CrossRef CAS PubMed.
- J. R. Friedman and J. Nunnari, Nature, 2014, 505, 335–343 CrossRef CAS PubMed.
- S. Miwa, S. Kashyap, E. Chini and T. von Zglinicki, J. Clin. Invest., 2022, 132, e158447 CrossRef CAS PubMed.
- J. S. S. Harrington, S. W. W. Ryter, M. Plataki, D. R. R. Price and A. M. K. Choi, Physiol. Rev., 2023, 103, 2349–2422 CrossRef CAS PubMed.
- Q. Zhu, Y. Sun, M. Fu, M. Bian, X. Zhu, K. Wang, H. Geng, W. Zeng, W. Shen and Y. Hu, ACS Sens., 2023, 8, 51–60 CrossRef CAS PubMed.
- M. Fu, F. He, Z. Jiang, X. Chen, Z. Xie and J.-F. Hu, RSC Adv., 2023, 13, 26247–26251 RSC.
- Z. Xie, Y. Zhou, M. Fu, L. Ni, Y. Tong, Y. Yu, N. Li, Z. Yang, Q. Zhu and J. Wang, Talanta, 2021, 231, 122365 CrossRef CAS PubMed.
- Y. Huang, Z. Zhang, L. Ma, H. Zhang, J. Yan, J. Wu and C. Liu, Dyes Pigm., 2023, 219, 111629 CrossRef CAS.
- Y. Lai, Z. Xie, M. Fu, X. Chen, Q. Zhou and J.-F. Hu, Prog. Chem., 2022, 34, 2024–2034 CAS.
- M. Fu, Y. Sun, Kenry, M. Zhang, H. Zhou, W. Shen, Y. Hu and Q. Zhu, Chem. Commun., 2021, 57, 3508–3511 RSC.
- W. Du, J. Q. Wang, H. X. Fang, W. H. Ji, Y. Liu, Y. W. Qu, D. T. Zhang, T. Shao, X. Y. Hou, Q. Wu and L. Li, Sens. Actuators, B, 2022, 370, 132456 CrossRef CAS.
- Y.-F. Wei, X.-Q. Zhang, R. Sun, Y.-J. Xu and J.-F. Ge, Dyes Pigm., 2021, 194, 109559 CrossRef CAS.
- Z. Zhang, L. Ma, Y. Huang, Y. Zhou, H. Zhang, J. Yan and C. Liu, Anal. Methods, 2023, 15, 3420–3425 RSC.
- J. Ge, W. Cai, N. Niu, Y. Wen, Q. Wu, L. Wang, D. Wang, B. Z. Tang and R. Zhang, Biomaterials, 2023, 300, 122190 CrossRef CAS PubMed.
- H. Song, W. Zhang, Y. Zhang, C. Yin and F. Huo, Chem. Eng. J., 2022, 445, 136448 CrossRef CAS.
- W. Shen, P. Wang, Z. Xie, H. Zhou, Y. Hu, M. Fu and Q. Zhu, Talanta, 2021, 234, 122621 CrossRef CAS PubMed.
- P. Xiao, W. Xie, J. Zhang, Q. Wu, Z. Shen, C. Guo, Y. Wu, F. Wang, B. Z. Tang and D. Wang, J. Am. Chem. Soc., 2023, 145, 334–344 CrossRef CAS PubMed.
- J. Miao, M. Miao, Y. Jiang, M. Zhao, Q. Li, Y. Zhang, Y. An, K. Pu and Q. Miao, Angew. Chem., Int. Ed., 2022, 29, 1549–1554 Search PubMed.
- H. Jia, Y. Liu, W. Tang, C. Liu and X. Duan, Sens. Actuators, B, 2023, 396, 134595 CrossRef CAS.
- N. Singh, S. Sharma, R. Singh, S. Rajput, N. Chattopadhyay, D. Tewari, K. B. Joshi and S. Verma, Chem. Sci., 2021, 12, 16085–16091 RSC.
- Y. Shiraishi, K. Yomo and T. Hirai, ACS Phys. Chem. Au, 2023, 3, 290–298 CrossRef CAS PubMed.
- A. Markowska, J. Kaysiewicz, J. Markowska and A. Huczyński, Bioorg. Med. Chem. Lett., 2019, 29, 1549–1554 CrossRef CAS PubMed.
- C. S. Helrich, J. A. Schmucker and D. J. Woodbury, Biophys. J., 2006, 91, 1116–1127 CrossRef CAS PubMed.
- J. Liu, W. Zhang, C. Zhou, M. Li, X. Wang, W. Zhang, Z. Liu, L. Wu, T. D. James, P. Li and B. Tang, J. Am. Chem. Soc., 2022, 144, 13586–13599 CrossRef CAS PubMed.
Footnotes |
| † Electronic supplementary information (ESI) available. See DOI: https://doi.org/10.1039/d4ra00959b |
| ‡ X. Chen and Z. L. Jiang contributed equally to this article. |
| This journal is © The Royal Society of Chemistry 2024 |