 Open Access Article
Synthesis and electrochemical evaluation of nickel hydroxide nanosheets with phase transition to nickel oxide†
Minjeong Lee‡
a,
Yeongeun Jang‡ b,
Gayoung Yoonc,
Seonghwa Lee
 *b and
Gyeong Hee Ryu
 *ac
*ac
aDepartment of Materials Engineering and Convergence Technology, Gyeongsang National University, Jinju 52828, Republic of Korea. E-mail: gh.ryu@gnu.ac.kr
bDepartment of Chemical Engineering, Changwon National University, 51140 Changwon, Republic of Korea. E-mail: seunghwa@changwon.ac.kr
cSchool of Materials Science and Engineering, Gyeongsang National University, Jinju, 52828, Republic of Korea
First published on 27th March 2024
Abstract
Transition metal hydroxides are commonly used to develop nanostructures with desired functionalities by controlling their size, morphology, and structure. In this study, nickel hydroxide nanosheets with a hexagonal island shape are synthesized via a surfactant-assisted method. Using this method, nickel hydroxide nanosheets can be easily achieved in a quick manner. The synthesized nanosheets are 3–6 nm thick and exhibit a curly and wrinkled morphology with increasing surfactant concentration. These nanosheets demonstrate superior catalytic properties for the oxygen evolution reaction activity compared to nickel oxide sheets obtained via a simple heat treatment. Furthermore, we conduct surface enhanced Raman scattering analysis to confirm that the nickel hydroxide nanosheets serve as active species for NiOOH during the oxygen evolution reaction, and we propose an electrochemical mechanism for this system. This study not only presents the detailed synthesis process but also proposes a straightforward approach, offering valuable insights into the structural and electrochemical properties of the resulting nanosheets.
Introduction
Transition metal hydroxides (TMHs) are among the most commonly used electrochemical materials because of their wide accessibility and favorable electrochemical stability.1–3 Further, they have attracted considerable research attention as promising oxidation catalysts, resulting in extensive theoretical and experimental research on their atomic structure evolution and electron transformation during catalysis.4–11 In addition, TMHs are commonly used to develop new nanostructures with desired functionalities by controlling their size, morphology, and structures; therefore, they are often synthesized as nanoparticles, nanorods, nanotubes, and nanoplates.12–17Thus far, many approaches have been developed to control the size and shape of these nanostructures. One of the most functionally efficient nanostructures is the nanosheet structure, which has a large surface area. TMHs synthesized as a nanosheet structure exhibit improved catalytic activity because of the alignment of specific exposed crystal planes. Further, lattice matching between crystal grains can help improve carrier mobility and increase the number of active sites by incorporating oxygen vacancies at grain boundaries.18–21
TMHs have gained considerable attention for synthesizing two-dimensional (2D) sheets and as anion exchange materials.22,23 They can also be converted to oxide nanostructures easily, without the need for post-treatments.12,13,24–27
TMHs contain a single metal species with the chemical formula M(OH)2 (M = Ni, Co, Zn, etc.28,29), which can be transformed into transition metal oxides with a variety of stoichiometries,30–34 including α-Ni(OH)2 and β-Ni(OH)2.35,36 Among these metal species, nickel is of great interest due to its high activity, sufficient natural abundance, and low cost.37–39 The latter naturally exists as a layered structure with oxide anions and nickel cations on octahedrally coordinated sites, with the hydrogen of the hydroxide on the tetrahedral sites directed toward the adjacent layer.40,41 Ni(OH)2 nanosheets can be transformed into NiO nanosheets with a [111] preferred orientation via a simple heat treatment.42
Ni-based oxides/hydroxides have emerged as some of the most competitive materials offering low overpotential and high current density that can be attributed to the active species of NiIII/IV involved in the oxygen evolution reaction (OER).8,43–53 Based on these characteristics, Ni-based materials will be steadily introduced into new technologies.37–39 Therefore, synthetic approaches must be explored for the development of Ni(OH)2 nanosheets with a large surface area and uniform thickness for their application as OER catalysts with improved performance.
In this study, we synthesized Ni(OH)2 nanosheets and analyzed their morphological and crystallographic structures. The synthesized Ni(OH)2 nanosheets were converted to NiO through a simple heat treatment, and the mechanism underlying their high electrocatalytic performance was confirmed. Further, a versatile approach for catalyst development through the phase transition of Ni(OH)2 and NiO was presented, and the important role of the crystal structure in promoting electrocatalytic processes was highlighted.
Experimental
Preparation of Ni(OH)2 sheet
An aqueous nutrient solution containing 3 mM nickel nitrate hexahydrate and 12 mM hexamethylenetetramine was gently added to a glasslock for synthesizing NiO nanosheets (size: 74 × 74 × 63.5 mm). A pre-determined amount of chloroform solution with sodium hexadecyl sulfate (SHS) was added at the water–air interface in the opening area of the glasslock. A target concentration of the surfactant solution (2.2 mg oleylamine in 10 g chloroform) was used for a glasslock with an opening area of 5476 mm2. After ∼30 min, the glasslock was capped and placed in a convection oven at 60 °C for 180 min. The nanosheets synthesized at the water–air interface of the glasslock were scooped using an arbitrary substrate for characterization and device fabrication.54,55 The as-synthesized nanosheet was Ni(OH)2; after annealing in an air atmosphere at 500 °C for 3 h, it converted to NiO.Characterization
The morphological and chemical properties of the nanosheets were analyzed through scanning electron microscopy (SEM, COXEM), atomic force microscopy (AFM, Veeco Multimode V), and X-ray photoemission (XP) spectroscopy (XPS, Thermofisher K-alpha). The XPS data were obtained from the nanosheets transferred on the 50 nm-thick platinum-coated Si substrates to minimize the signal from the native oxide of the Si substrates. Peak deconvolution was performed after background subtraction using a Shirley background. The specimens were analyzed using TF30ST, Thermo Fisher operated at 300 kV. The electron energy loss (EEL) spectra were acquired using an aberration-corrected Thermo Fisher Titan Cubed system for transmission electron microscopy (TEM, FEI Titan3 G2 60-300) operated at 80 kV.Electrochemical tests
All electrochemical experiments were conducted in Fe-free KOH solutions to prevent the effect of Fe promotion on catalytic performance. A multichannel potentiostat (VSP, Bio-Logic) with a three-electrode system comprising a Pt wire as the counter electrode and a Hg/HgO electrode (1 M KOH, E (Hg/HgO) = 0.098 V vs. standard hydrogen electrode) as the reference electrode was used to determine the electrocatalytic activity. An Au foil was used as the working electrode for both the electrochemical tests and in situ surface-enhanced Raman scattering (SERS). Before use, Au substrates were immersed in a sulfuric acid solution and washed with deionized water and ethanol several times. The catalyst ink containing Ni(OH)2 or NiO samples was drop-casted on an electrochemically roughened gold substrate. Catalyst-deposited Au was dried and subjected to electrochemical analysis and Raman spectroscopy. Infrared (IR) compensation was conducted at a rate of 90% using the Bio-Logic EC-Lab software. All obtained electrochemical data were referred to the reversible hydrogen electrode (RHE) scale using the following:| E (V vs. RHE) = E (V vs. Hg/HgO) + 0.098 + 0.0592 × pH |
In situ surface-enhanced Raman scattering (SERS)
In situ SERS experiments were conducted in a custom-made Teflon cell by using a Raman microscope (XperRAM S, Nanobase) coupled with a 60× water immersion objective lens (Olympus). A 633 nm excitation light source was operated at a grating of 600 L mm−1. Each spectrum was measured with a resolution of 1 cm−1 through 30 consecutive scans, with a 0.5 s exposure time per scan. Prior to measurement, the peak shift was calibrated to acetaminophen standard peaks for ensuring the high reproducibility of the measured spectra. A double-junction Ag/AgCl electrode in a 3 M KCl solution (+0.22 V vs. NHE at 25 °C) was used as the reference electrode, whereas a Pt wire was used as the counter electrode. The Raman spectra were obtained in situ by varying the applied potential from the open-circuit potential (OCP) to 1.55 V vs. RHE at intervals of 0.05 V.Results
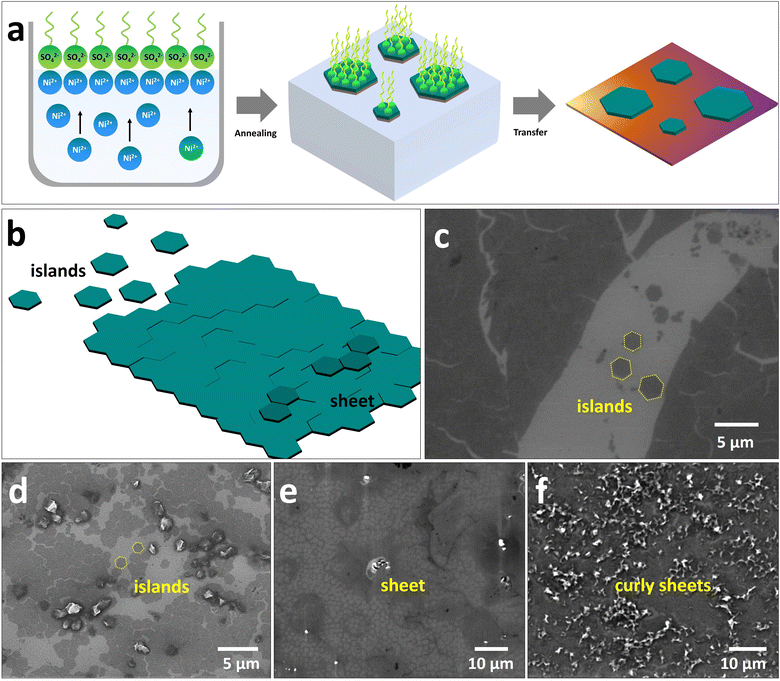
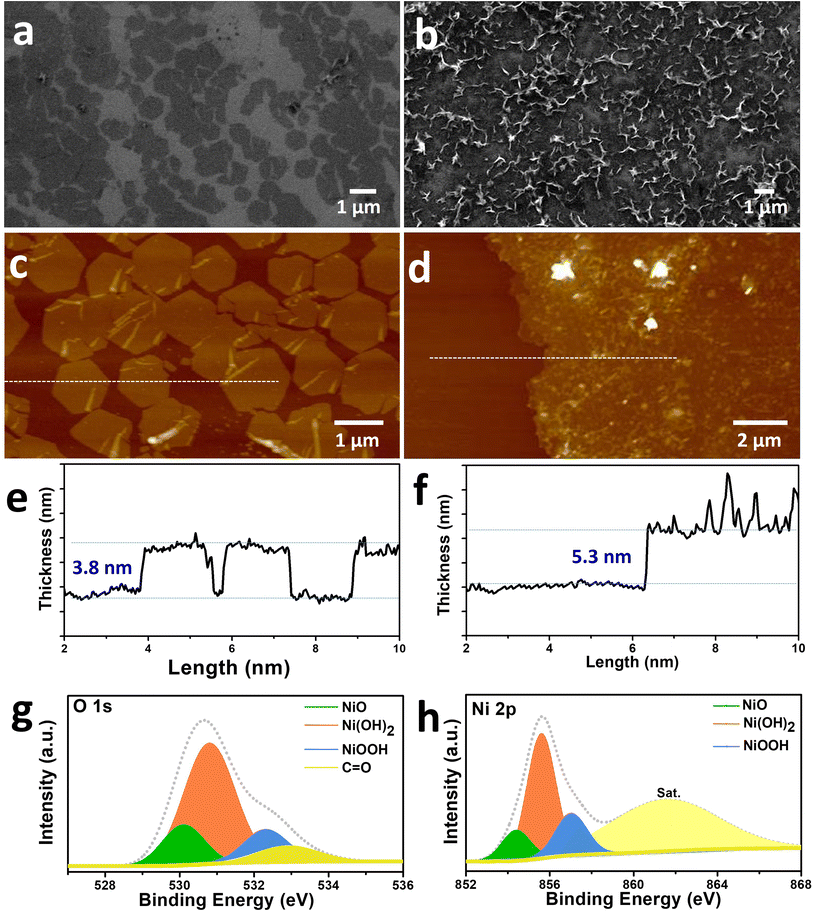
Ni(OH)2 nanosheets in which ionized molecules of sulfates self-assemble at the water–air interface were synthesized. Consequently, during the growth of the nanosheets, the ionized molecules self-assembled to a highly packed monolayer at the surface of water, forming a negatively charged ionic layer. Therefore, positive Ni2+ cations were attracted to the interface, forming the nanosheets. Fig. 1a illustrates the synthesis process of the Ni(OH)2 nanosheets. In the growth process, the nanosheets were scooped out of the water–air interface using an arbitrary substrate for synthesizing islands and nanosheets. The morphology of the synthesized nanosheets is illustrated through the diagram shown in Fig. 1b, which is created on the basis of SEM images. Fig. 1c–f show the SEM images of the nanosheets transferred onto a SiO2/Si substrate. Ni(OH)2 is preferentially formed as hexagonal islands, and single or clustered hexagonal islands are observed near the nanosheets synthesized with a large area (Fig. 1c). They become large-area nanosheets when they are densely connected laterally (Fig. 1d). The density of the islands increases gradually with an increase in the concentration of the surfactant, and they expand into nanosheets (Fig. 1e). Further, laterally extended nanosheets become curly and wrinkled upon the extension of the reaction time (Fig. 1f).The features of the hexagonal and curly Ni(OH)2 nanosheets (Fig. 2a and b) are confirmed via the AFM images shown in Fig. 2c and d. The AFM topography images revealed that the surfaces of the hexagonal islands were smooth. The line profile across the islands is extracted and shown in Fig. 2c, which confirms that it has a uniform thickness of 3.8 nm throughout the entire islands (Fig. 2e). The rough feature of the wrinkled sheet is revealed by the AFM topography image with a corresponding line profile extracted from the line across the wrinkled sheet (Fig. 2d and f). XPS was conducted to investigate the elemental composition and bonding states of the nanosheets. The peak corresponding to the binding energy of nickel oxide/nickel hydroxide/nickel oxyhydroxide was determined, and nickel hydroxide exhibited the main peak in the synthesized nickel-based nanosheet. The XP spectra showed the Ni, O, and C peaks detected from the as-transferred nanosheet on a 50 nm-thick Pt-coated Si wafer. Fig. 2g shows the O 1s state at a binding energy of 530.9 eV after deconvolution, indicating that the peaks attributed to NiO, Ni(OH)2, and NiOOH at binding energies of 530.2, 531, and 532.5 eV, respectively, were allocated at Ni(OH)2. Elements such as C were present because of the precursors. The Ni 2p XPS peak of the nanosheet was individually scanned and deconvoluted to confirm the chemical state of the Ni atom (Fig. 2h). The peak at 855.8 eV was attributed to Ni2+ in Ni(OH)2, which confirmed that the bulk component of this nanosheet was Ni(OH)2.
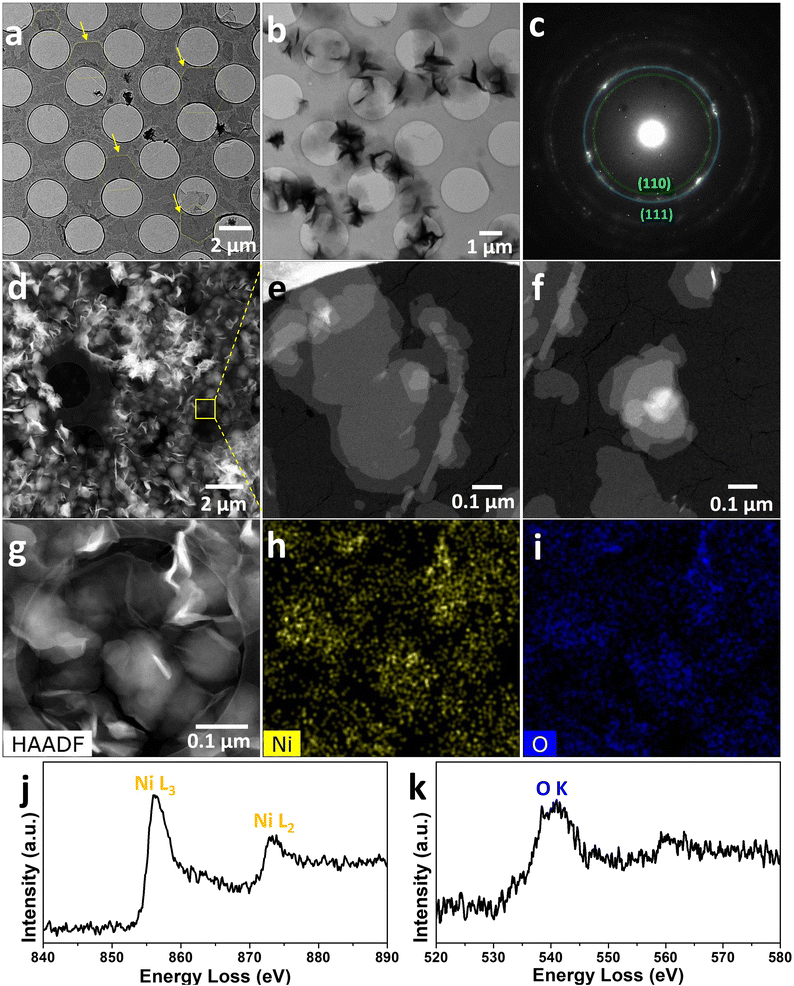
TEM was performed to analyze the morphology and crystal structure of the synthesized Ni(OH)2 nanosheets. The presence of hexagonal islands at the beginning of nanosheet formation is confirmed by the morphology of the sample transferred to the TEM grid (Fig. 3a). In addition, wrinkled sheets are visualized as clusters of overlapping islands (Fig. 3b). The diffraction pattern was attributed to the (111) and (110) planes of Ni(OH)2, as confirmed by the electron diffraction in the region where these sheets are present. Although high-intensity dominance is confirmed, the randomly oriented grains are aligned when the overall ring pattern is maintained. The scanning transmission electron microscopy-high-angle annular dark field (STEM-HAADF) image shows that the curly and wrinkled areas can be easily identified because of the sharp contrast (Fig. 3d). The enlarged images show that the nanosheets have high contrast in the partially overlapped region (Fig. 3e and f). The presence of Ni and O is confirmed when elemental mapping is performed through energy-dispersive X-ray spectroscopy (EDS) on the wrinkled sheets (Fig. 3g and h). The EEL spectra were also acquired, which showed Ni L2,3-edges at 856 and 872 eV. Even at the O 1s edge, the OK near-edge structure was observed at 531 eV, corresponding to the binding energy of the Ni(OH)2 peak identified via XPS.
The synthesized Ni(OH)2 and post-annealed NiO nanosheets were subjected to electrocatalytic activity tests. The catalytic activity was measured in a 1 M Fe-free KOH solution to prevent Fe incorporation into the samples during the OER.51 Fig. 4a exhibits cyclic voltammograms of the Ni(OH)2 nanosheets obtained at a scan rate of 20 mV s−1 before and after annealing. All measured potentials were referred to the RHE scale unless explicitly stated otherwise. A redox event is observed for both samples (see the dotted box in Fig. 4a) commonly attributed to Ni-related reactions according to previous literature.51,56,57 In the anodic scan, the Ni(II) to Ni(III) oxidation peak started increasing at ∼1.35 V for Ni(OH)2 and at 1.4 V for NiO. During the reverse scan, reduction peaks were observed at ∼1.35 V for NiO and 1.31 V for Ni(OH)2. The redox peaks exhibited by Ni(OH)2 were notably more intense than those by NiO, implying a stronger prevalence of the Ni(II) sites undergoing oxidation to Ni(III)OOH at the applied potential. This stronger prevalence of the Ni(II) sites contributes substantially to the observed electrocatalytic performance. At potentials of ≥1.45 V, Ni(OH)2 demonstrated higher activity for the OER than NiO.
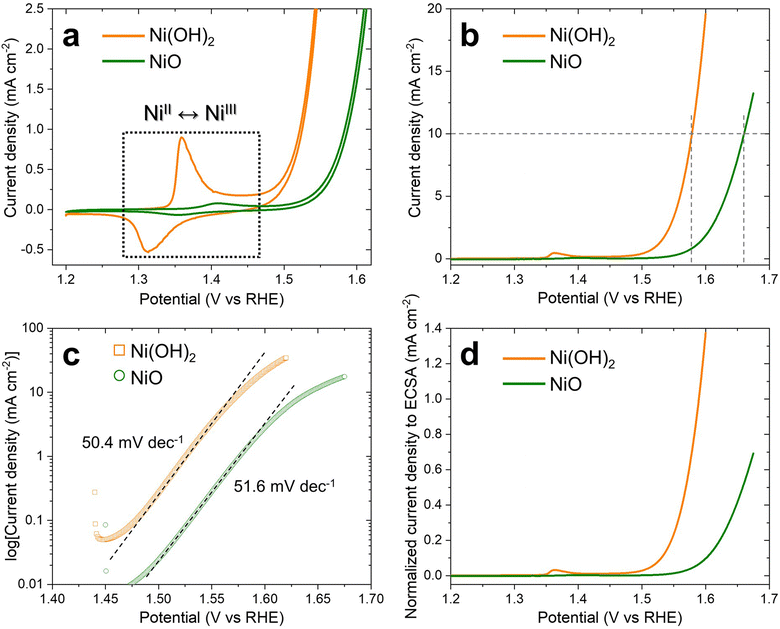 | ||
| Fig. 4 (a) Cyclic voltammetry (CV) and (b) linear sweep voltammetry (LSV) curves of Ni(OH)2 (orange) and NiO (green). (c) Tafel slopes, derived from the LSV data in Fig. 4b, of Ni(OH)2 (orange) and NiO (green). (d) Normalized current density and electrochemically active surface area (ECSA) of Ni(OH)2 (orange) and NiO (green). All tests were performed in a 1 M Fe-free KOH solution. | ||
Fig. 4b shows the OER activity of the samples measured via linear sweep voltammetry (LSV) at a scan rate of 1 mV s−1. Chronopotentiometry (CP) was performed at 10 mA cm−2 for 24 h (Fig. S4†). The overpotential, as indicated by current densities of 10 mA cm−2, was 80 mV lower for Ni(OH)2 than for NiO. This trend is consistent with the Tafel slopes, as seen in Fig. 4c; Ni(OH)2 exhibits a slope of 50.4 mV dec−1, which is slightly lower than that of NiO (51.6 mV dec−1). Double-layer capacitance (Cdl) was measured through cyclic voltammetry (CV) at various scan rates to estimate the electrochemical surface area (ECSA) (Fig. S5†). The calculated capacitance was divided by the known specific capacitance (Cs) for Ni(OH)2 to obtain the ECSA.58 A double-layer-capacitance-normalized activity is shown in Fig. 4d, which indicates that the OER activity of Ni(OH)2 remains considerably higher than that of NiO even after normalizing the data to Cdl.
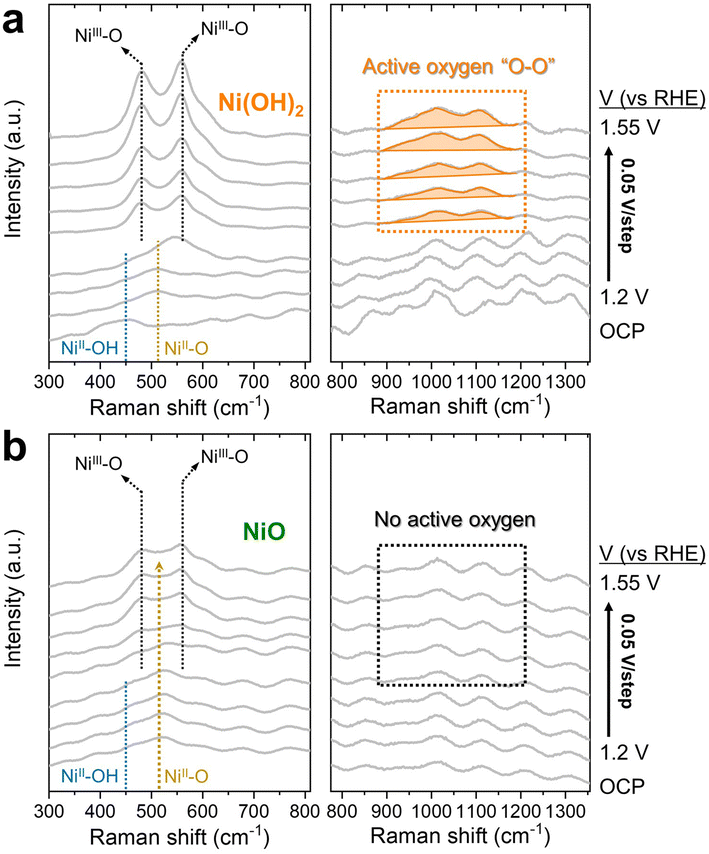
In situ SERS was conducted to explore potential factors contributing to the observed performance difference between the two samples. SERS was employed to enhance the Raman signal by at least an order of magnitude, thereby enabling the observation of bands linked to NiII–O and NiII–OH.57,59,60 Further, the broad band in the spectral region of 850–1250 cm−1, i.e., active oxygen species (O–O), was resolved with high precision.57,61–63 The potential-dependent Raman spectra of the samples are presented in Fig. 5a and b. At the OCP, two prominent peaks corresponding to NiII–OH and NiII–O were evident at ∼450 and 505 cm−1,57,59–62 respectively, for both Ni(OH)2 and NiO. As the potential increased to 1.35 V, both samples underwent spectral evolution, with peak growth observed at ∼480 and 560 cm−1. The former peak growth is attributed to the bending mode of NiIII–O in NiOOH, whereas the latter is associated with the stretching mode of NiIII–O in NiOOH.57,59–62 With the simultaneous emergence of NiOOH peaks, the broad band indicative of active oxygen was observable for Ni(OH)2, whereas NiO exhibited no active oxygen. Although this spectral feature, i.e., active oxygen species in the 850–1250 cm−1 range, is commonly observed in Ni-based OER catalysts, its origin remains unresolved. Some researchers attribute this to the negatively charged ‘NiOO−’ species at the surface,61,62,64,65 whereas others associate it with oxygen atoms (‘O0 (1/2O2)’) or peroxide-related species.63,66 Various superoxide groups have been widely proposed as relevant contributors to this broad band.57,67 Despite the yet-to-be-revealed uncertainties, two assumptions regarding active oxygen have found broad acceptance: (i) prevalence in higher-oxidation-state Ni oxides, either in the bulk or surface region of the sample, and (ii) involvement in the lattice oxygen mechanism, gaining significant attention as a reaction mechanism that diverges from the conventional volcano correlation. Furthermore, recent observations have suggested the mediation of a robust interaction between FeOxHy active sites and their corresponding metal oxyhydroxide substrate.68
The comparative analysis of Ni(OH)2 and NiO revealed notable distinctions in their OER activity. In terms of the ECSA, in relation to NiO, Ni(OH)2 demonstrated a larger value, underwent a more substantial transformation to NiOOH, and possessed a catalytically active phase for the OER. The substantial generation of NiOOH is consistent with the higher oxidation state, i.e., the presence of a large amount of Ni(III), which correlates with the abundance of active oxygen. Active oxygen can serve as a reliable indicator for efficient OER activation for both samples containing only Ni (in the absence of Fe). Furthermore, in the low-frequency region for NiO, the spectral feature of NiII–O was observed even in the higher potential range where NiOOH begins to form and persist. This observation contributes to the overall spectrum profile of the NiO sample and aligns with the CV results, thereby indicating a smaller degree of Ni(II) oxidation to Ni(III). These electrochemical and spectroscopic data unequivocally confirm that Ni(OH)2 exhibits higher OER activity than NiO.
Conclusion
In this study, Ni(OH)2 nanosheets were successfully synthesized using a method involving surfactants. The synthesized nanosheets were converted to NiO nanosheets through simple heat treatment, and their morphology, crystal structure and electrochemical properties were analysed. The hexagonal nanosheets grew laterally and became curly as the concentration of the surfactant increased. The nanosheets were electrochemically analysed considering their OER activity. The redox reaction of the nickel hydroxide nanosheets was found to occur more actively than that of nickel oxide nanosheets, and the overpotential value was lower. This difference resulted from the transformation of Ni(II) sites in Ni(OH)2 to Ni(III)OOH during the oxidation process, from which active oxygen is generated. This study systematically explored the effect of compositional changes in the 2D sheets of the same material, thereby contributing to the field of 2D-material-based catalysis. Further, this study provides an in-depth understanding of the synthesis, morphological transformations, and phase transition of the as-synthesized nanosheets and thus expands their application scope in catalysis and electrochemistry. Therefore, the research findings offer valuable insights into the diverse utilization of nanosheets and suggest future research directions.Author contributions
G. H. Ryu and S. Lee contributed as co-corresponding authors. M. Lee. and Y. Jang contributed as co-first authors. M. Lee. conducted synthesis of the sample and performed data analysis. G. Yoon conducted synthesis of the sample and the experiments. S. Lee and Y. Jang conducted OER tests and in situ Raman analysis. G. H. Ryu wrote the manuscript with contributions from all authors.Conflicts of interest
There are no conflicts to declare.Acknowledgements
This work was supported by the National Research Foundation of Korea (NRF) grant funded by the Korean government (MSIT) (No. RS-2023-00277414 and No. RS-2023-00244851) and Regional Innovation Strategy through the NRF funded by the Ministry of Education (No. 2021RIS-003).Notes and references
- P. Poizot, S. Laruelle, S. Grugeon, L. Dupont and J. M. Tarascon, Nature, 2000, 407, 496–499 CrossRef CAS PubMed.
- W. Li, E. M. Erickson and A. Manthiram, Nat. Energy, 2020, 5, 26–34 CrossRef CAS.
- X. Yu, S. Yun, J. S. Yeon, P. Bhattacharya, L. Wang, S. W. Lee, X. Hu and H. S. Park, Adv. Energy Mater., 2018, 8, 1702930 CrossRef.
- J. Kang, Y. Xue, J. Yang, Q. Hu, Q. Zhang, L. Gu, A. Selloni, L. M. Liu and L. Guo, J. Am. Chem. Soc., 2022, 144, 8969–8976 CrossRef CAS PubMed.
- C. Bozal-Ginesta, R. R. Rao, C. A. Mesa, X. Liu, S. A. J. Hillman, I. E. L. Stephens and J. R. Durrant, ACS Catal., 2021, 11, 15013–15025 CrossRef CAS.
- S. Corby, M.-G. Tecedor, S. Tengeler, C. Steinert, B. Moss, C. A. Mesa, H. F. Heiba, A. A. Wilson, B. Kaiser, W. Jaegermann, L. Francàs, S. Gimenez and J. R. Durrant, Sustainable Energy Fuels, 2020, 4, 5024–5030 RSC.
- C. A. Mesa, L. Francàs, K. R. Yang, P. Garrido-Barros, E. Pastor, Y. Ma, A. Kafizas, T. E. Rosser, M. T. Mayer, E. Reisner, M. Grätzel, V. S. Batista and J. R. Durrant, Nat. Chem., 2020, 12, 82–89 CrossRef CAS PubMed.
- M. B. Stevens, C. D. M. Trang, L. J. Enman, J. Deng and S. W. Boettcher, J. Am. Chem. Soc., 2017, 139, 11361–11364 CrossRef CAS PubMed.
- H. C. Nguyën, F. A. Garcés-Pineda, M. de Fez-Febré, J. R. Galán-Mascarós and N. López, Chem. Sci., 2020, 11, 2464–2471 RSC.
- Y. Zhou and N. López, ACS Catal., 2020, 10, 6254–6261 CrossRef CAS.
- F. A. L. Laskowski, M. R. Nellist, J. Qiu and S. W. Boettcher, J. Am. Chem. Soc., 2019, 141, 1394–1405 CrossRef CAS PubMed.
- G. H. Jeong, H. S. Jang, J. C. Yoon, Z. Lee, J. Yang, A. R. Jang and G. H. Ryu, ACS Omega, 2022, 7, 35834–35839 CrossRef CAS PubMed.
- M. Lee, G. Yoon, M. K. Kim, J. Hong, S. Lee and G. H. Ryu, J. Alloys Compd., 2024, 976, 173282 CrossRef CAS.
- T. Guo, M.-S. Yao, Y.-H. Lin and C.-W. Nan, CrystEngComm, 2015, 17, 3551–3585 RSC.
- S. Xu and Z. L. Wang, Nano Res., 2011, 4, 1013–1098 CrossRef CAS.
- I. Concina, Z. H. Ibupoto and A. Vomiero, Adv. Energy Mater., 2017, 7, 1700706 CrossRef.
- R. S. Devan, R. A. Patil, J. H. Lin and Y. R. Ma, Adv. Funct. Mater., 2012, 22, 3326–3370 CrossRef CAS.
- R. O. Da Silva, R. H. Gonçalves, D. G. Stroppa, A. J. Ramirez and E. R. Leite, Nanoscale, 2011, 3, 1910–1916 RSC.
- Q. Zhang, K. Zhang, D. Xu, G. Yang, H. Huang, F. Nie, C. Liu and S. Yang, Prog. Mater. Sci., 2014, 60, 208–337 CrossRef CAS.
- O. Elbanna, M. Fujitsuka and T. Majima, ACS Appl. Mater. Interfaces, 2017, 9, 34844–34854 CrossRef CAS PubMed.
- C. N. Van, T. H. Do, J.-W. Chen, W.-Y. Tzeng, K.-A. Tsai, H. Song, H.-J. Liu, Y.-C. Lin, Y.-C. Chen and C.-L. Wu, NPG Asia Mater., 2017, 9, e357 CrossRef.
- H. Yin and Z. Tang, Chem. Soc. Rev., 2016, 45, 4873–4891 RSC.
- Q. Wang and D. O'Hare, Chem. Rev., 2012, 112, 4124–4155 CrossRef CAS PubMed.
- D. Carriazo, C. Domingo, C. Martín and V. Rives, Inorg. Chem., 2006, 45, 1243–1251 CrossRef CAS PubMed.
- F. Li, J. Liu, D. G. Evans and X. Duan, Chem. Mater., 2004, 16, 1597–1602 CrossRef CAS.
- S. Morandi, F. Prinetto, M. Di Martino, G. Ghiotti, O. Lorret, D. Tichit, C. Malagù, B. Vendemiati and M. C. Carotta, Sens. Actuators, B, 2006, 118, 215–220 CrossRef CAS.
- A. Yoon, G. Kim, M. Lee, Z. Lee and G. H. Ryu, Nanoscale Horiz., 2022, 7, 1210–1216 RSC.
- G. G. C. Arizaga, K. G. Satyanarayana and F. Wypych, Solid State Ionics, 2007, 178, 1143–1162 CrossRef CAS.
- L. Trotochaud, J. K. Ranney, K. N. Williams and S. W. Boettcher, J. Am. Chem. Soc., 2012, 134, 17253–17261 CrossRef CAS PubMed.
- K. Petrov, A. Lyubchova and L. Markov, Polyhedron, 1989, 8, 1061–1067 CrossRef CAS.
- L. Poul, N. Jouini and F. Fiévet, Chem. Mater., 2000, 12, 3123–3132 CrossRef CAS.
- N. Guillou, M. Louër and D. Louër, J. Solid State Chem., 1994, 109, 307–314 CrossRef CAS.
- T. Shinagawa, M. Watanabe, T. Mori, J. I. Tani, M. Chigane and M. Izaki, Inorg. Chem., 2018, 57, 13137–13149 CrossRef CAS PubMed.
- T. Shinagawa, M. Watanabe, J.-i. Tani and M. Chigane, Cryst. Growth Des., 2017, 17, 3826–3833 CrossRef CAS.
- D. S. Hall, D. J. Lockwood, C. Bock and B. R. MacDougall, Proc. R. Soc. A, 2015, 471(2174), 20140792 CrossRef PubMed.
- K. Lawson, S. P. Wallbridge, A. E. Catling, C. A. Kirk and S. E. Dann, J. Mater. Chem. A, 2023, 11, 789–799 RSC.
- Y. Li, J. Zhang, Z. Chen and M. Chen, Sustainable Mater. Technol., 2022, 33, e00479 CrossRef CAS.
- I. Rakhimbek, N. Baikalov, A. Konarov, A. Mentbayeva, Y. Zhang and Z. Bakenov, Nanoscale Adv., 2024, 6, 578–589 RSC.
- J. Huang, H. Wang, G. Ma, H. Wan, Y. Rao, L. Shen and H. Wang, Electronics, 2024, 13, 1042 CrossRef.
- R. S. McEwen, J. Phys. Chem., 1971, 75, 1782–1789 CrossRef CAS.
- M. Mookherjee and L. Stixrude, Am. Mineral., 2006, 91, 127–134 CrossRef CAS.
- C. W. Kim, Y. S. Son, A. U. Pawar, M. J. Kang, J. Y. Zheng, V. Sharma, P. Mohanty and Y. S. Kang, J. Mater. Chem. A, 2014, 2, 19867–19872 RSC.
- K. Fominykh, J. M. Feckl, J. Sicklinger, M. Döblinger, S. Böcklein, J. Ziegler, L. Peter, J. Rathousky, E. W. Scheidt and T. Bein, Ultrasmall dispersible crystalline nickel oxide nanoparticles as high-performance catalysts for electrochemical water splitting, Adv. Funct. Mater., 2014, 24(21), 3123–3129 CrossRef CAS.
- O. Diaz-Morales, D. Ferrus-Suspedra and M. T. M. Koper, Chem. Sci., 2016, 7, 2639–2645 RSC.
- Z. Lu, L. Qian, Y. Tian, Y. Li, X. Sun and X. Duan, Chem. Commun., 2016, 52, 908–911 RSC.
- Z. Liu, N. Li, H. Zhao, Y. Zhang, Y. Huang, Z. Yin and Y. Du, Chem. Sci., 2017, 8(4), 3211–3217 RSC.
- J. Zhang, X. Zhen, P. K. Upputuri, M. Pramanik, P. Chen and K. Pu, Adv. Mater., 2017, 29, 1604764 CrossRef PubMed.
- K. Fominykh, G. C. Tok, P. Zeller, H. Hajiyani, T. Miller, M. Döblinger, R. Pentcheva, T. Bein and D. Fattakhova-Rohlfing, Adv. Funct. Mater., 2017, 27, 1605121 CrossRef.
- F. Malara, S. Carallo, E. Rotunno, L. Lazzarini, E. Piperopoulos, C. Milone and A. Naldoni, ACS Catal., 2017, 7, 4786–4795 CrossRef CAS.
- M. Gong, Y. Li, H. Wang, Y. Liang, J. Z. Wu, J. Zhou, J. Wang, T. Regier, F. Wei and H. Dai, J. Am. Chem. Soc., 2013, 135, 8452–8455 CrossRef CAS PubMed.
- L. Trotochaud, S. L. Young, J. K. Ranney and S. W. Boettcher, J. Am. Chem. Soc., 2014, 136, 6744–6753 CrossRef CAS PubMed.
- J. W. D. Ng, M. García-Melchor, M. Bajdich, P. Chakthranont, C. Kirk, A. Vojvodic and T. F. Jaramillo, Nat. Energy, 2016, 1, 1–8 Search PubMed.
- J. Bak, T. G. Yun, J.-S. An, H. B. Bae and S.-Y. Chung, Energy Environ. Sci., 2022, 15, 610–620 RSC.
- F. Wang, Y. Yu, X. Yin, P. Tian and X. Wang, J. Mater. Chem. A, 2017, 5, 9060–9066 RSC.
- X. Yin, Q. Chen, P. Tian, P. Zhang, Z. Zhang, P. M. Voyles and X. Wang, Chem. Mater., 2018, 30, 3308–3314 CrossRef CAS.
- S. Klaus, Y. Cai, M. W. Louie, L. Trotochaud and A. T. Bell, J. Phys. Chem. C, 2015, 119, 7243–7254 CrossRef CAS.
- S. Lee, Y.-C. Chu, L. Bai, H. M. Chen and X. Hu, Chem Catal., 2023, 1, 100475 CrossRef.
- C. C. McCrory, S. Jung, J. C. Peters and T. F. Jaramillo, J. Am. Chem. Soc., 2013, 135, 16977–16987 CrossRef CAS PubMed.
- B. S. Yeo and A. T. Bell, J. Phys. Chem. C, 2012, 116, 8394–8400 CrossRef CAS.
- M. W. Louie and A. T. Bell, J. Am. Chem. Soc., 2013, 135, 12329–12337 CrossRef CAS PubMed.
- B. J. Trześniewski, O. Diaz-Morales, D. A. Vermaas, A. Longo, W. Bras, M. T. Koper and W. A. Smith, J. Am. Chem. Soc., 2015, 137, 15112–15121 CrossRef PubMed.
- S. Lee, K. Banjac, M. Lingenfelder and X. Hu, Angew. Chem., 2019, 131, 10401–10405 CrossRef.
- M. Merrill, M. Worsley, A. Wittstock, J. Biener and M. Stadermann, J. Electroanal. Chem., 2014, 717–718, 177–188 CrossRef CAS.
- A. C. Garcia, T. Touzalin, C. Nieuwland, N. Perini and M. T. M. Koper, Angew Chem. Int. Ed. Engl., 2019, 58, 12999–13003 CrossRef CAS PubMed.
- S. Lee, L. Bai and X. Hu, Angew. Chem., 2020, 132, 8149–8154 CrossRef.
- R. D. Smith and C. P. Berlinguette, J. Am. Chem. Soc., 2016, 138, 1561–1567 CrossRef CAS PubMed.
- C. Hu, Y. Hu, C. Fan, L. Yang, Y. Zhang, H. Li and W. Xie, Angew Chem. Int. Ed. Engl., 2021, 60, 19774–19778 CrossRef CAS PubMed.
- Q. Jiang, S. Wang, C. Zhang, Z. Sheng, H. Zhang, R. Feng, Y. Ni, X. Tang, Y. Gu, X. Zhou, S. Lee, D. Zhang and F. Song, Nat. Commun., 2023, 14, 6826 CrossRef CAS PubMed.
Footnotes |
| † Electronic supplementary information (ESI) available. See DOI: https://doi.org/10.1039/d4ra01120a |
| ‡ They are equally contributed. |
| This journal is © The Royal Society of Chemistry 2024 |

