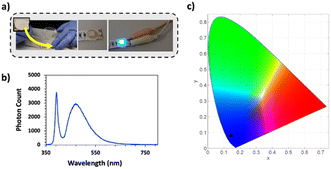
 Open Access Article
Sustainable next-generation color converters from P. harmala seed extracts for solid-state lighting†
Talha Erdem *a,
Ali Orencb,
Dilber Akcanc,
Fatih Duman
 bd and
Zeliha Soran-Erdem
 *ce
*ce
aDepartment of Electrical-Electronics Engineering, Abdullah Gül University, Kayseri, Turkey. E-mail: erdem.talha@agu.edu.tr
bNanotechnology Research Center (ERNAM), Erciyes University, Kayseri, Turkey
cBioengineering Program, Graduate School of Engineering and Science, Abdullah Gül University, Kayseri, Turkey. E-mail: zeliha.soranerdem@agu.edu.tr
dDepartment of Biology, Erciyes University, Kayseri, Turkey
eDepartment of Engineering Sciences, Abdullah Gül University, Kayseri, Turkey
First published on 10th June 2024
Abstract
Traditional solid-state lighting heavily relies on color converters, which often have a significant environmental footprint. As an alternative, natural materials such as plant extracts could be employed if their low quantum yields (QYs) in liquid and solid states were higher. With this motivation, here, we investigate the optical properties of aqueous P. harmala extract, develop efficient color-converting solids through a cost-effective and environmentally friendly method, and integrate them with light-emitting diodes (LEDs). To achieve high-efficiency solid hosts for P. harmala-based fluorophores, we optically and structurally compare two crystalline and two cellulose-based platforms. Structural analyses reveal that sucrose crystals, cellulose-based cotton, and paper platforms enable a relatively homogeneous distribution of fluorophores compared to KCl crystals. Optical characterization demonstrates that the extracted solution and the extract-embedded paper possess QYs of 75.6% and 44.7%, respectively, whereas the QYs of the cotton, sucrose, and KCl crystals remain below 10%. We demonstrated that the paper host with the highest efficiency causes a blueshift in the P. harmala fluorescence, whereas the cotton host induces a redshift. We attribute this to the passivation of nonradiative transitions related to the structure of the hosts. Subsequently, as a proof-of-concept demonstration, we integrate the as-prepared efficient solids of P. harmala for the first time with a light-emitting diode (LED) chip to produce a color-converting LED. The resulting blue-emitting LED achieves a luminous efficiency of 21.9 lm Welect−1 with CIE color coordinates of (0.139, 0.070). These findings mark a significant step toward the utilization of plant-based fluorescent biomolecules in solid-state lighting, offering promising environmentally friendly organic color conversion solutions for future lighting applications.
1. Introduction
Solid-state lighting (SSL) based on light-emitting diodes (LEDs) offers high-quality lighting with higher efficiency, lower energy consumption, and a substantially longer lifetime.1 Current SSL technology mainly employs a blue LED chip integrated with color-converting materials.2 Phosphors made of rare-earth metal ions are the most widely used material system forming the color converting films.3 Despite their high photoluminescence quantum yields (QY), alternatives are in demand due to (i) the difficulty in tuning their colors limiting their performance, (ii) the concerns regarding their supply, and (iii) the environmental footprint of mining the rare-earth metals4 that are used to synthesize the phosphors. Among the alternatives, quantum dots (QDs) have stepped forward as they enable easy color-tuning of the LEDs5 and are less vulnerable to the supply crises.6 Nevertheless, the efficient QDs are toxic due to their cadmium content while their synthesis is far from being environmentally friendly.7 Although organic semiconductors could be promising despite their stability issues,8 their syntheses possess a substantial environmental footprint similar to the QDs. In this work, we explore the possibility of using plant extracts as sustainable alternatives to phosphors, QDs, and organic semiconductors, with an emphasis on Peganum harmala.Plants have been traditionally used for curation owing to various biomolecules that they have, such as alkaloids, flavonoids, phenols, anthocyanins, etc.9–12 extraction of these molecules has been studied intensively in the literature, mainly for pharmacologic and therapeutic purposes.12 On the other hand, some of these plants possess autofluorescent biomolecules which absorb the light and reemit at longer wavelengths.13 This feature enables imaging certain plant parts without tagging with a reporter molecule.13,14 However, the potential of these autofluorescent biomolecules has not been evaluated as alternatives to synthetic fluorescent probes including semiconducting polymers, their nanoparticles, or quantum dots (QDs). Despite their availability, sustainability, eco-friendly nature, bio-compatibility, and low cost,15 a limited number of studies report their use in applications other than pharmacology and biotechnology. These include flexible electronics (e-skins),16 solar cells,17 and energy storage.18 For lighting applications, Roy et al.19 synthesized green-emitting graphene quantum dots from plant extracts obtained from neem (Azadirachta indica) and fenugreek (Trigonella foenum-graecum), and employed them to obtain white LEDs. In another study conducted by Singh and Mishra,20 fluorescent polymer films were prepared using red pomegranate and turmeric extracts to generate white light on a blue LED. In this work, the QYs of the fluorescent molecules in the extract were reported as <10% whereas the QY of the films, which are likely less than the in-solution-QYs due to aggregation effects, were not reported. Therefore, the research efforts need to be directed toward obtaining their efficient solids to use the plant extracts in solid-state lighting (SSL).
With this motivation, we studied the potential of water extract of Peganum harmala, also known as Syrian rust or African rue, for utilization in SSL. Phytochemically, this plant is rich in β-carbolines alkaloids such as harmine, harmaline, harmalol, and harman and quinazoline derivatives such as vasicine, vasicinone, and deoxyvasicinone21,22 and has several applications, particularly for therapeutic purposes such as antibacterial, antifungal and antiviral effects,23–25 anti-tumour effect26 and, insecticidal effect.12 Although its blue-green fluorescence is known,27 the literature lacks sufficient information about its optical characterizations and their application in SSL. With this motivation, here, we prepared the water extract of P. harmala and characterized its optical features. Its quantum yield beyond 75% shows that this extract can be a good candidate for SSL if it can sustain these QYs at reasonable levels in solid form. For this purpose, we prepared solids of Peganum harmala by embedding the biomolecules into two crystalline matrices, sucrose and KCl, and into two fibrous matrices, cotton and paper. Then, we integrated the solid matrix having the highest QY with a UV LED chip to prepare color-converting LEDs.
2. Experimental methods
2.1 Extraction and chemical characterization of P. harmala
P. harmala was purchased from a local store in Kayseri, Türkiye. P. harmala seeds were ground using a mortar, and then 5 g of this powder was mixed with 50 mL of double distilled water (ddH2O). The solution was kept dark at room temperature for 24 hours. The mixture was first filtered for cleaning using Whatman filter paper (No. 1). Then, the solution was centrifuged at 5000 rpm for 10 min and filtered using a 0.2 μm cellulose acetate hydrophilic filter (Minisart, Sartorius). The aqueous solution of P. harmala seeds was stored at 4 °C for further use in our experiments. The extraction yield of the P. harmala was calculated using the following equation:
 | (1) |
2.2 Fabrication of fluorescent solid composites
| Volume of P. harmala extract (mL) | Volume of stock sucrose solution (mL) | Volume of stock KCl solution (mL) | Volume of water (mL) | |
|---|---|---|---|---|
| P. harmala in sucrose crystals | 1 mL | 2 mL | — | 2 mL |
| P. harmala in KCl crystals | 1 mL | — | 2 mL | 2 mL |
| Sucrose crystals (control group) | — | 2 mL | — | 3 mL |
| KCl crystals (control group) | — | — | 2 mL | 3 mL |
After the crystals were formed, samples were powdered using a mortar. Sucrose and KCl pellets (monoliths) were prepared by applying high pressure to these powders in a hydraulic press (Specac, Atlas Manual). Briefly, 125 mg of the powders were placed between two stainless steel disks, and a pressure of 0.75 GPa was applied using a hydraulic press for 10 min at room temperature.
The chemical characterization of the phytochemicals in Peganum harmala was carried out using a QP2010 gas chromatography with a Thermal Desorption System, TD 20 coupled with Mass Spectroscopy (GC-MS) (Shimadzu, Japan). The ionization voltage was used as 70 eV, and gas chromatography was conducted in the temperature programming mode with a Restek column (0.25 mm, 30 m, 5 MS). The initial column temperature was set at 40 °C and then gradually increased to 100 °C before holding for 1 minute. Subsequently, it was raised to 270 °C and maintained for 5 minutes. The injection port temperature was kept at 280 °C, and the GC-MS interface was also maintained at 280 °C. Sample introduction was carried out using an all-glass injector operating in splitless mode, with a helium carrier gas flow rate of 1.2 mL min−1. Compound identification was achieved by comparing retention times and fragmentation patterns, along with the mass spectra obtained from GC-MS analysis.
2.3 Optical and structural characterizations
Optical characterization of aqueous P. harmala extract was performed by absorption, photoluminescence, and quantum yield measurements. UV-Vis absorption spectrum of P. harmala extract was acquired with a UV-1800 UV-Vis spectrophotometer (Shimadzu) between 250 and 700 nm. The photoluminescence (PL) spectrum was recorded with an Agilent-Cary Eclipse fluorescence spectrophotometer at an excitation wavelength of 382 nm. The quantum yield (QY) of the solution was measured using a reference dye, coumarin 153, which has a quantum yield of 54.2%. Briefly, the absorbance of the P. harmala extract and the coumarin 153 dye was acquired. Then, the PL spectra of both extract and dye were measured at the excitation wavelength where both absorbance spectra cross. Using the PL data, the QY of the extract was calculated according to eqn (2):
 | (2) |
Structural characterizations were conducted using fluorescence microscopy, scanning electron microscopy (SEM), and scanning transmission electron microscopy (STEM) to understand the effect of morphological variations on the optical properties. Fluorescence microscopy images were recorded using a Nikon Eclipse Ni fluorescence microscope. Electron microscopy images were taken using ZEISS-Gemini SEM/STEM 300 Scanning Electron Microscopy. SEM images were taken at 3 kV or 5 kV, and before the imaging, a 5 nm Au layer was sputtered on the sample. Image J program was utilized to measure the sizes of only KCl, only sucrose, KCl including Peganum harmala and sucrose including Peganum harmala crystal powders obtained from STEM images.
2.4 Light-emitting diode (LED) application
The paper sample having the highest QY was used for LED measurement. The paper was placed on a commercially available low-power LED having a peak emission wavelength of 400 nm after a small volume of epoxy resin was added onto the LED to fix the sample on the LED. The luminance was recorded using a Hamamatsu integrating sphere and spectrometer. Colorimetric and photometric characterizations were carried out employing in-house written codes.3. Results and discussion
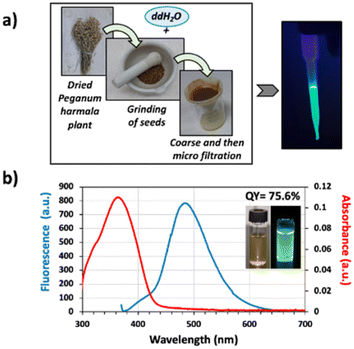
The green-fluorescent extract used in this study was obtained by brewing the powdered P. harmala seeds in double distilled water for 24 h (Fig. 1a), and the extraction yield was calculated as 17.16% using eqn (1). Then, the absorbance and fluorescence spectra of the aqueous P. harmala extract were examined to reveal the optical properties of the extract (Fig. 1b). Results demonstrated that P. harmala has a very prominent absorption peak at 365 nm. In the literature, although a couple of studies report the absorption spectra of green synthesized nanoparticles using P. harmala extracts as reducing agent,28,29 there is only one report about the absorption spectrum of P. harmala extract in water.30 Interestingly, the absorbance spectrum reported by Azizi et al.30 has no strong peaks but weaker shoulders around 460 and 640 nm. On the other hand, our extract possesses a clear and strong absorbance peak of around 365 nm, which is similar to the report of Bhattacharjee et al. on harmaline.31 The difference in the spectra between our extract and Azizi et al.30 may stem from different extraction conditions employed. Furthermore, the similarity between our absorbance spectra and that of Bhattacharjee et al.31 indicates that harmaline is the most prominent optically-active chemical in the extract.Peganum harmala has been reported in the literature as a plant species rich in fluorescent phytochemicals such as harmaline, harmalol, harmine, and norharman, which are β-carboline alkaloids.21 To identify the phytocompounds found in our aqueous Peganum harmala extract, we performed Gas Chromatography-Mass Spectroscopy (GC-MS) analysis (Fig. S1a–d†). Results revealed that the predominant constituents within the Peganum harmala seed extract are fatty acids, aldehydes, and alkaloids (Fig. S1b†). Notably, the GC-MS findings highlighted the prevalence of several key compounds, namely harmine (48.59%), 2,3-dihydro-1H-2-isopropylcyclopenta[b]quinoxaline (17.67%), beta-carboline, 8-methoxy-1-methyl- (11.46%), and 1-ethyl-5-methyl-5-isopropylaminobabituric acid (4.05%), respectively. Aromatic β-carboline alkaloid (harmine) is well-studied among these naturally occurring alkaloids, and it emits a unique green color under UV light, indicating it might play a significant role in the overall emission of our plant extracts. Furthermore, our analysis identified 8-methoxy-1-methyl-9H-β-carboline, an isomer of harmine, comprising 11.46% of the extract. Although photophysical features of this specific molecule is missing in the literature, the presence of benzene rings strongly indicates a semiconductor nature. Furthermore, a detailed analysis of its chemical structure reveals that it only differs from the autofluorescent molecule harmine by the position of the oxygen. Therefore, we evaluate that this molecule is highly likely an autofluorescent molecule; nevertheless, for a definite experimental proof, isolation of 8-methoxy-1-methyl-9H-β-carboline and its optical characterization are required, which is beyond the scope of this current work.
It has been previously reported in the literature that the seeds of P. harmala emit light at 473 nm which is largely attributed to its harmalol component.32 However, more than one molecule emitting at a similar wavelength range generally contributes to the final emission color in plant extracts. To characterize the emission profile of our extract, we performed a photoluminescence (PL) measurement, and the results showed that our extract has a fluorescence peak at 490 nm when it is excited at 382 nm (Fig. 1b). Here, similar to the absorbance spectra, there is a strong similarity between the PL of our extract and the harmaline PL spectrum reported by Bhattacharjee et al.,31 which further supports our previous conclusion on the dominance of harmaline throughout the extract. However, since other alkaloids in the plant's structure carry a beta-carboline ring structure, we believe these biomolecules also contribute to the emission profile of our extract.
Quantum yield is one of the main parameters for successful implementation of a color converter in SSL applications. A decrease in quantum yield during the transition from liquid to solid state is a significant problem avoiding the use of various fluorescent materials in SSL. To overcome this problem, our group previously demonstrated that when inorganic and organic nanoparticles are incorporated into crystalline matrices, the QYs and the emission stability of these fluorophores improve,33–36 making these nanomaterials attractive for SSL applications. However, the distribution of plant-based fluorophores and their optical properties in these matrices have not been studied previously.
In order to study plant-based solid surfaces, first, we measured the QY of the P. harmala extract and found it as 75.6%. Such a high value makes it comparable to the levels that inorganic, toxic quantum dots or some fluorescent polymers provide.36,37 In the literature, Hidalgo et al.38 reported the QYs of norharman, harmane, harmalol, and harmol, which are the chemical compounds in P. harmala extract, as 16%, 17%, 39%, and 49%, respectively. These values were significantly lower than our QY results. At this point, it is worth highlighting that the QY of the extracts may be affected by the extraction procedure (e.g. solvent type, method, time, etc.) and purification processes, potentially leading to lower QYs in the study of Hidalgo et al. than the one we measured.
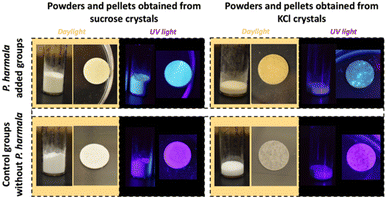
To transfer our P. harmala extracts to the solid-state, we first approached the P. harmala extract crystallization in saturated sucrose and potassium chloride (KCl) solutions. Obtained crystal structures and their preparation details are provided in Fig. 2 and Table 1, respectively. As seen in Fig. 2 and magnified images of the crystals provided in Fig. S2,† KCl crystals tend to form small crystal grains separately and P. harmala extract is localized in some parts of these grains. However, as opposed to KCl crystal, sucrose formed a large and continuous one piece of crystal and covered the Petri dish surface relatively homogeneously. Furthermore, the fluorescent molecules of the P. harmala extract are distributed more homogeneously within the whole sucrose crystal structure instead of localizing in some parts. The strong ionic forces in salt solution might cause the aggregation of luminescent molecules and prevent a homogenous distribution of the extract within the salt matrix. Additionally, although we used the same total volume (5 mL, Table 1) in both the control and P. harmala groups, we observed that P. harmala including groups covered a larger area on the dish surface than the control groups (Fig. 2). The lowered cohesive forces and, thus, the lowered surface tension of water in the presence of extract have contributed to this observation.
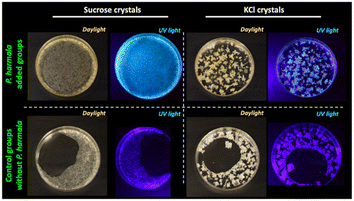 | ||
| Fig. 2 Images of sucrose and KCl crystals with and without P. harmala under ambient lighting and UV illumination. | ||
Although P. harmala extract is transferred to the solid state in these crystals, the fabrication of a pellet (monolith), which includes homogenously distributed fluorescent biomolecules and allows for easy handling, is crucial for LED studies. For this purpose, first, we ground these sucrose- and KCl-based crystals into powder forms using a mortar. Then, we obtained the pellets having a diameter of ∼1 cm by applying high pressure to these powders. The images of the powders and monoliths under daylight and UV light are presented in Fig. 3. Consistent with Fig. 2, green fluorophores aggregated at specific locations of the KCl pellet and represented a nonhomogeneous distribution. However, the homogenous distribution of the fluorophores which causes homogenous greenish emission was observed within the sucrose pellets (Fig. 3, left-top).
In addition to the crystalline matrices, we also investigated two different fibrous matrices. Using these materials, first, we aimed to avoid the aggregation of the fluorescent molecules, which is more likely to occur during drying and crystal formation. Secondly, the random distribution of P. harmala extract in different fiber structures and the effect of this distribution on the optical features were studied. In accordance with this, here we employed cellulose, which is one of the most abundant sustainable, renewable, and biocompatible natural polymers in the biosphere. Besides, thanks to their chemical structure, cellulose-based materials are known as exceptional adsorbants.39 Considering their outstanding features, we immersed the fluorescent P. harmala extract into cellulose-based materials and compared them with our crystal-based host matrices. We chose cotton pad and fibrous drying paper as cellulose-based materials because of their easy accessibility and low cost. Briefly, cotton and fiber papers were soaked into P. harmala extract, and then they were dried (Fig. 4). Although some orange shade was observed in some parts of the P. harmala-embedded cotton and paper in the daylight images, a homogenous emission was obtained under UV illumination.
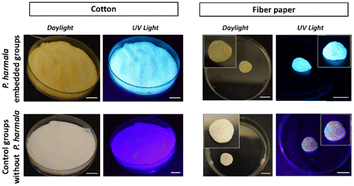 | ||
| Fig. 4 Images of cotton and fiber paper groups with and without P. harmala under daylight and UV light. Insets demonstrate the magnified pictures of the fiber paper groups. Scale bars: 1 cm. | ||
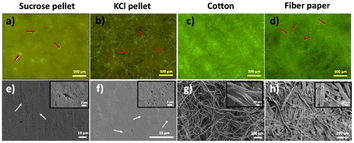
We also characterized the P. harmala embedded sucrose crystal, KCl crystal, cotton, and fibrous paper under a fluorescence microscope and scanning electron microscope (SEM) to understand the structure-extract distribution relation in detail (Fig. 5). The sucrose pellet showed a cloudy structure with mostly homogeneous emission in the fluorescence microscope images (Fig. 5a). On the other hand, the KCl pellet was not cloudy and the details were distinguishable. However, the green-emitting areas were nonhomogeneous across the monolith compared to the sucrose pellet (Fig. 5b). Small spot-like structures were observed when we looked closer at both sucrose and KCl monoliths. These structures were more prominent in the sucrose monoliths. Interestingly, the borders of these structures are fluorescent instead of their core, as indicated by the red arrows in Fig. 5a and b. This reveals that P. harmala extract surrounds the sucrose and salt molecules. In addition, the distribution and interconnection of these bead-like structures are more homogenous in the sucrose monolith than KCl monolith. As seen from SEM images given in Fig. 5e and f, both sucrose and KCl monoliths have smooth surfaces and linear lines (shown with white arrows) occurring because of the applied pressure between two steel cylinders in the hydraulic press to obtain the monolith structure. On the other hand, in the magnified images given in the insets, we observed small grape-like structures coming together, which supports our observations in Fig. 5a and b.
Compared to the crystal-based monoliths, cellulose-based cotton and fiber paper revealed fibrillar structures in both fluorescence microscopy and SEM images (Fig. 5c, d, g and h). In the fluorescence microscopy images, “fiber paper” fibers appeared more flattened compared to cotton fibers, as shown with red arrows in Fig. 5d. To understand the structural details, we performed SEM imaging. As represented in Fig. 5g and h, we observe a thicker and more flattened fiber structure in the paper in contrast to the cotton, which supports the images obtained by fluorescence microscope. Furthermore, SEM images indicated that cotton fibers have a diameter of 16.8 ± 4.6 μm and appeared to have a more helical shape. On the other hand, in fiber paper, it seems like thinner fibers come together and form these thick fibers having a diameter of 28.9 ± 8.6 μm. Also, many short extensions between the fibers are visible in SEM images. For further structural investigation, we also performed Scanning Transmission Electron Microscopy (STEM) (Fig. S3†). STEM images of P. harmala, including sucrose crystal powders and KCl crystal powders, revealed that sucrose crystals predominantly displayed spherical structures, while salt crystals exhibited cube or rectangle shapes (Fig. S3a–d†). Notably, the localized structure of salt crystals depicted in Fig. 2 was also confirmed through STEM imaging (Fig. S3b and d†). Our findings indicate that the sucrose crystal powders including P. harmala and KCl crystal powders including P. harmala have similar average sizes and standard deviations (Fig. S3a, b and Table S1†). While sucrose powder shapes and sizes are similar independent of the presence of P. harmala, adding P. harmala extract to KCl makes the shapes of the observed features more isotropic and reduces the feature size. We also would like to highlight that we did not observe any indication of the presence of a low-dimensional system that could significantly affect the emission features of the semiconducting molecules in the extract. However, it is worth noting that the electron beams accelerated under a high voltage in the STEM instrument causes melting in the organic molecules, which makes it very challenging to get high-resolution and high-magnification images.
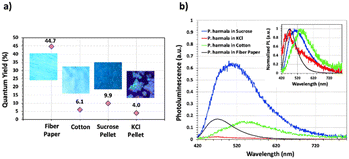
Subsequent to structural characterization, the fluorescence quantum yield (QY) and PL spectra of all P. harmala solid samples were measured and presented in Fig. 6a. QY measurements revealed that the extract-embedded paper has the highest QY measured as 44.7%, decreased from 75.6% in the liquid state, which makes it suitable for a proof-of-concept LED application. Interestingly, although cotton also has a fibrous structure, the QY of this sample remained at 6.1%. There could be two explanations for this decreased quantum efficiency. The first one is that cotton's absorption capacity of extracts is higher than that of the paper. As a result, significantly more extracts are soaked by the cotton. This means that more fluorescent biomolecules are found between solid cotton fibers and are close to each other leading to the quenching of the QY. The other possible explanation for the decreased QY is the difference in fiber structures between cotton and fiber paper. In the paper, wide, flat, and interconnected fibers increasing the surface area (Fig. 5h) might also increase the distribution of the biomolecules after embedding, which may have caused less aggregation than the cotton. However, cotton possesses helical and thinner fibers (Fig. 5g), possibly leading to a more serious aggregation and, thus, quenching.
Then we analyzed the P. harmala fluorescence spectra within all matrices. As observed in Fig. 6b, the maximum PL peaks were identified as 470 nm for P. harmala in fiber paper, 550 nm for P. harmala in cotton, 455 nm for P. harmala in KCl monoliths, and 509 nm for P. harmala in sucrose monoliths while the P. harmala extract is at 490 nm. When we specifically compare the fibrous matrices that have the highest QYs, we observe that the fiber paper (44.7% QY) has a blue shift (490 to 470 nm), while cotton (6.1% QY) has a very strong redshift (490 to 545 nm). We attribute this redshift observed in cotton to the nonradiative interaction between fluorophore molecules in close proximity due to high amount of fluorophores end up in cotton owing to its very high absorption capability. However, the blue-shift observed in fiber paper and a very high QY clearly suggest that this matrix passivates the nonradiative transitions in the extract. To evaluate the effect of the extract volume and the embedding time, we also embedded the paper in the extract for 30 min instead of 2 min and dropped the same volume (2 mL) onto the fiber paper slowly to allow the matrix to incorporate all of the extract solution. Results demonstrated that 30 minutes embedding and dropping techniques resulted in QYs of 37.6% and 34.6% as presented in Fig. S4 in ESI.† This result demonstrated that although there is a slight decrease from 46% to 34–37% with increasing embedding time or absorbed volume, we still have a very high QY compared to other groups having QYs lower than 10%. This result is interesting because cotton also has a fibrous structure; however, we do not see a similar increase in its QY. This suggests that the fiber paper's flat and highly interconnected structure might induce a more homogenous distribution within the matrix.
Finally, we prepared a proof-of-concept LED employing the sustainable, bio-based color converters. Since we obtained the highest QY with the sample in the paper host, we used it as a biocompatible and easy-to-handle color converter on the LED chip emitting at ∼400 nm. The representative image showing the fabrication of the LED setup is given in Fig. 7a, and the results are demonstrated in Fig. 7b and c. The LED we designed exhibited a blueish emission as quantified by the CIE 1931 color coordinates (0.139, 0.070). Although the extract has a cyan-green emission, the LED chip exciting the color-converting material shifted the color towards a more blueish region. We measured the luminous efficiency of our device as 21.9 lm Welect−1, which is relatively close to the performance of commercial epitaxially grown LED chips,40 showing the potential of plant extracts as color converters for SSL.
4. Conclusions
In this study, we report a natural, cost-effective, easy-to-handle paper-based color converter obtained from fluorescent P. harmala extract, which can be a promising alternative to its counterparts in solid-state lighting. Here, we wrapped fluorescent biomolecules from plant extract into crystal-based and cellulose fiber-based matrices to obtain color converters with relatively high QYs in solid state. As a crystal-based platform, we incorporated P. harmala extract into sucrose and KCl crystals. In parallel to these samples, we also studied cotton pads and drying paper (fiber paper) as fiber-based hosts containing cellulose to investigate their potential as a solid scaffold. Structural characterizations demonstrated that, except KCl crystals, the extract is relatively homogenously distributed within the host matrices. However, QY measurements revealed that the highest quantum efficiency is observed in fiber paper at 44.7%, thanks to its structural advantages. In contrast, QYs of the other matrices become less than 10%. As a proof-of-concept demonstration, we presented the use of P. harmala extract embedded fiber paper as a color converter on an LED. The obtained device possessed a blue emission and exhibited a luminous efficiency of 21.9 lm Welect−1 showing that Peganum harmala solids are excellent candidates as color converters. We believe that the results presented here may pave the way for the use of plant-based materials as environmentally-friendly, cost-effective alternatives to the currently used color converters.Author contributions
The manuscript was written through the contributions of all authors. All authors have given approval to the final version of the manuscript. Dr Talha Erdem: writing – review & editing, methodology, formal analysis, data curation, supervision, resources, funding acquisition. Ali Örenç: writing – original draft, formal analysis, data curation, conceptualization. Dilber Akcan: writing – original draft, formal analysis, data curation, conceptualization. Dr Fatih Duman: writing – review & editing, validation. Dr Zeliha Soran-Erdem: writing – review & editing, visualization, validation, supervision, resources, project administration, investigation, funding acquisition.Conflicts of interest
There are no conflicts to declare.Acknowledgements
ZSE and TE thank Abdullah Gül University for FFS funding. TE acknowledges BAGEP 2023 and TÜBA-GEBİP Awards. ZSE acknowledges the support from TÜBİTAK ARDEB Project No. 123M876.References
- E. F. Schubert, Light-Emitting Diodes, Cambridge University Press, New York, 2nd edn, 2006 Search PubMed.
- S. O. Kasap, Optoelectronics and Photonics, Principles and Practices, Prentice Hall, 1st edn, 2001 Search PubMed.
- Y. Zhang, L. Luo, G. Chen, Y. Liu, R. Liu and X. Chen, J. Rare Earths, 2020, 38, 1–12 Search PubMed.
- O. Graydon, Nat. Photonics, 2011, 5, 1 Search PubMed.
- T. Erdem and H. V. Demir, Nanophotonics, 2013, 2, 57–81 CAS.
- T. Erdem and H. V. Demir, Nat. Photonics, 2011, 5, 126 CrossRef CAS.
- B. Gidwani, V. Sahu, S. S. Shukla, R. Pandey, V. Joshi, V. K. Jain and A. Vyas, J. Drug Delivery Sci. Technol., 2021, 61(3), 102308 Search PubMed.
- Z. Soran-Erdem, T. Erdem, K. Gungor, J. Pennakalathil, D. Tuncel and H. V. Demir, ACS Nano, 2016, 10(5), 5333–5339 Search PubMed.
- R. Duval and C. Duplais, Nat. Prod. Rep., 2017, 34, 329 RSC.
- W. H. Talib, I. Alsalahat, S. Daoud, R. F. Abutayeh and A. I. Mahmod, Molecules, 2020, 25(22), 5319 Search PubMed.
- A. Kumar, S. Aswal, R. B. Semwal, A. Chauhan, S. K. Joshi and D. K. Semwal, Phytochem. Rev., 2019, 18, 1277–1298 Search PubMed.
- M. Moloudizargari, P. Mikaili, S. Aghajanshakeri, M. Asghari and J. Shayegh, Pharmacogn. Rev., 2013, 7(14), 199–212 Search PubMed.
- L. Donaldson, Molecules, 2020, 25(10), 2393 Search PubMed.
- L. Donaldson and N. Williams, Plants, 2018, 7, 1–16 Search PubMed.
- P. Singh, Y. J. Kim, D. Zhang and D. C. Yang, Trends Biotechnol., 2016, 34, 588–599 Search PubMed.
- L. Wang, K. Wang, Z. Lou, K. Jiang and G. Shen, Adv. Funct. Mater., 2018, 28, 1–16 Search PubMed.
- N. T. Mary Rosana, D. Joshua Amarnath, P. Senthil Kumar and K. L. Vincent Joseph, Environ. Prog. Sustainable Energy, 2020, 39(3), e13351 CrossRef CAS.
- Z. Bi, Q. Kong, Y. Cao, G. Sun, F. Su, X. Wei, X. Li, A. Ahmad, L. Xie and C. M. Chen, J. Mater. Chem. A, 2019, 7, 16028–16045 RSC.
- P. Roy, A. P. Periasamy, C. Chuang, Y. R. Liou, Y. F. Chen, J. Joly, C. Te Liang and H. T. Chang, New J. Chem., 2014, 38, 4946–4951 RSC.
- V. Singh and A. K. Mishra, Sci. Rep., 2015, 5, 11118 CrossRef CAS PubMed.
- A. M. Sobhani, S. A. Ebrahimi and M. Mahmoudian, J. Pharm. Pharm. Sci., 2002, 5(1), 19–23 Search PubMed.
- F. Fathiazad, Y. Azarmi and L. Khodaie, Iran. J. Pharm. Sci., 2006, 2, 81–86 Search PubMed.
- Z. N. Wu, N. H. Chen, Q. Tang, S. Chen, Z. C. Zhan, Y. B. Zhang, G. C. Wang, Y. L. Li and W. C. Ye, Org. Lett., 2020, 22, 7310–7314 CrossRef CAS PubMed.
- J. Asgarpanah, Afr. J. Pharm. Pharmacol., 2012, 6, 1573–1580 CAS.
- E. Darabpour, A. Poshtkouhian Bavi, H. Motamedi and S. M. Seyyed Nejad, EXCLI J., 2011, 10, 252–263 Search PubMed.
- H. Li, Z. Wang, Y. Wang, J. Xu and X. He, Phytochemistry, 2020, 174, 112342 CrossRef CAS PubMed.
- L. Lewerenz, T. Hijazin, S. Abouzeid, R. Hänsch and D. Selmar, Phytochemistry, 2020, 174, 112362 CrossRef CAS PubMed.
- B. Davarnia, S. A. Shahidi, H. Karimi-Maleh, A. G. H. Saraei and F. Karimi, Int. J. Electrochem. Sci., 2020, 15, 2549–2560 Search PubMed.
- S. A. Fahmy, I. M. Fawzy, B. M. Saleh, M. Y. Issa, U. Bakowsky and H. M. E. S. Azzazy, Nanomaterials, 2021, 11(4), 965 CrossRef CAS PubMed.
- M. Azizi, S. Sedaghat, K. Tahvildari, P. Derakhshi and A. Ghaemi, Green Chem. Lett. Rev., 2017, 10(4), 420–427 CrossRef CAS.
- P. Bhattacharjee, S. Sarkar, T. Ghosh and K. Bhadra, J. Appl. Biol. Biotech., 2018, 6(04), 1–8 Search PubMed.
- B. Hemmateenejad, M. Shamsipur, F. Samari, T. Khayamian, M. Ebrahimi and Z. Rezaei, J. Pharm. Biomed. Anal., 2012, 67–68, 201–208 CrossRef CAS PubMed.
- T. Erdem, Z. Soran-Erdem, Y. Kelestemur, N. Gaponik and H. V. Demir, Opt. Express, 2015, 24(2), A74–A84 CrossRef PubMed.
- Z. Soran-Erdem, T. Erdem, P. L. Hernandez-Martinez, M. Z. Akgul, N. Gaponik and H. V. Demir, J. Phys. Chem. Lett., 2015, 6(9), 1767–1772 CrossRef CAS PubMed.
- T. Erdem, Z. Soran-Erdem, P. L. Hernandez-Martinez, V. K. Sharma, H. Akcali, I. Akcali, N. Gaponik, A. Eychmüller and H. V. Demir, Nano Res., 2015, 8, 860–869 CrossRef CAS.
- Z. Soran-Erdem, T. Erdem, K. Gungor, J. Pennakalathil, D. Tuncel and H. V. Demir, ACS Nano, 2016, 10(5), 5333–5339 CrossRef CAS PubMed.
- X. Bai, F. Purcell-milton and Y. K. Gun'koYurii, J. Mater. Chem. C, 2022, 10, 11105–11118 RSC.
- J. Hidalgo, E. Roldan, D. González-Arjona, M. Sánchez, A. Pardo and J. M. L. Poyato, J. Photochem. Photobiol., A, 1987, 41, 103–110 CrossRef CAS.
- H. T. Phuong, N. K. Thoa, P. T. A. Tuyet, Q. N. Van and Y. D. Hai, Crystals, 2022, 12(1), 106 CrossRef CAS.
- AvagoTechnologies, 2010, 1–9.
Footnote |
| † Electronic supplementary information (ESI) available: GC-MS chromatogram of the plant extract, identified phytochemicals and the mass spectra of some fluorescent chemicals in the extract, images of crystals with and without Peganum harmala, STEM images and the measured size distributions of the crystals with and without Peganum harmala, quantum yields (%) of Peganum harmala dropped and embedded papers. See DOI: https://doi.org/10.1039/d4ra01150c |
| This journal is © The Royal Society of Chemistry 2024 |

