 Open Access Article
Unveiling the heavy-metal ion critical role in γ-dicalcium silicate: from solidification to early hydration†
Heyu Lua,
Zhaohui Liua,
Xiao Zhib,
Jiayuan Yec,
Jieshuo Wana,
Daizhixuan Aia and
Neng Li *a
*a
aState Key Laboratory of Silicate Materials for Architectures, Wuhan University of Technology, Wuhan 430070, China. E-mail: lineng@whut.edu.cn
bChina National Building Materials Group Corp., Beijing 100036, China
cState Key Laboratory of Green Building Materials, China Building Materials Academy, Beijing 100024, China
First published on 9th April 2024
Abstract
The heavy-metal ion critical role in γ-dicalcium silicate (γ-C2S) both in terms of solidification mechanism and hydration is still unclear. In this work, the solidification mechanism and the effect on initiating hydration of these three heavy-metal ions (Ba, Cd, and Cr) in γ-C2S is systemically studied by well-defined ab initio calculations. The calculated results show that the solid solution tendency of ions originates from the charge contribution, and the charge localization caused by the doping of Cr ions weakens the surface water adsorption. These insights will provide theoretical guidance for the low-carbon cement development by γ-C2S.
1. Introduction
Cement is a crucial artificial material that is widely used in contemporary construction, transportation infrastructure, and marine engineering.1 Global cement production is reported to have reached 4.1 billion tons in 2021. The production of a considerable amount of cement causes high levels of carbon dioxide emissions and energy consumption. Cement production is reported to account for about 5% of the world's total industrial energy consumption and 8% of the world's total anthropogenic carbon emissions.2,3 Due to the increasing issues associated with environmental degradation and global energy shortages, the cement industry has focused on reducing carbon emissions and utilizing energy-saving technology. Numerous methods were used to achieve this goal,4 including: (i) improving the energy efficiency in cement production;5 (ii) using waste as a substitute fuel for cement production;6 (iii) using solid wastes containing Ca, Si, Al, and Fe as secondary raw materials for cement production; and (iv) utilizing mineral mineralization for carbon dioxide capture and storage.7,8The main sources of carbon emissions and energy consumption in the cement manufacturing process are the calcination and decomposition of limestone. Belite and alite are the two predominant clinker mineral phases in Ordinary Portland Cements (OPC). Tricalcium silicate (Ca3SiO5, C3S) and dicalcium silicate (Ca2SiO4, C2S) are the two dominant clinker minerals in the alite and belite clinker phases, respectively. Because C2S has lower calcium–silicon ratio than C3S, belite cement can be produced at a lower calcination temperature.1 Belite-enriched cement production purportedly reduces CO2 emissions by 35% compared to OPC.9 However, the low hydration activity of belite limits the use of cement with high belite content.10 Belite-enriched cement has attracted attention due to the urgent need for the cement industry to become more environmentally friendly.11,12
Cuberos and Fukuda et al. have reported that the five crystalline forms of C2S exhibit different hydration activities during the same curing cycle.13,14 Among the five C2S crystal forms, γ-C2S is most stable at ambient temperature. γ-C2S has almost no hydration activity but good carbonation activity.15 Mu et al. improve the γ-C2S reactivity through various methods so that it can meet the needs of practical projects. For example, the introduction of metal ions caused lattice distortion which can improve the hydration reaction properties of the mineral.16–18
Using waste as a secondary raw material to produce cement has been widely advocated.19 Yokozeki et al. synthesized γ-C2S using by-products such as fly ash and industrial raw materials.20 This approach can significantly reduce the accumulation of waste and mitigate the high CO2 emissions and resource consumption in cement production. However, industrial by-products such as fly ash contain a large number of impurity ions. During the high-temperature calcination process, the impurity ions enter the clinker crystals and affect the clinker crystal composition and properties.21 Barium, cadmium, and chromium are the most toxic metal elements in solid waste and are widely present in secondary raw materials and alternative fuels such as fly ash, petroleum, limestone, and clay coke.22,23 According to previous work, chromium has an impact on the hydrated mixture's setting time, development of compressive strength, and composition of the resulting clinker phase. The silicate phase contains the majority of the chromium in the clinker phase.24,25 Kolovos et al. concluded that cadmium is a highly volatile element and it is difficult to determine its solid solution properties in specific clinker phases due to its low retention rate.26 The manufacture of cement clinker with barium has been extensively studied because barium is the most used additive in the cement industry.27
Previous studies have shown that harmful ions are widely present in the cement clinker phase and can affect cement clinker properties.18,28,29 However, the metal ion's critical role in γ-dicalcium silicate (γ-C2S) in both solidification and hydration is still unclear. For instance, it is unclear how impurity ions prefer to enter the clinker phase, what the substitution mechanism of impurity ions is, and how the introduction of impurity ions affects the hydration of the clinker phase. As a result, this work aims to investigate the effect of the three most common impurity ions (Ba, Cd, Cr) on γ-C2S, including the clarified substitution tendency of the impurity ions and their solidification mechanism, and the effect of doping on hydration reactivity. First-principles calculations provide information and reliable methods for the research at the atomic level. The results will hopefully provide a basis for the production of low-carbon cement from industrial by-products.
2. Calculations details
2.1 Models
C2S exists in five crystal forms: α-C2S, ,
,  , β-C2S and γ-C2S. The α,
  ,
,  and β forms of C2S are all unstable below 773 K and all tend to convert to γ-C2S.30 γ-C2S is an olivine-type mineral belonging to the rhombohedral crystal system, and its original cell contains a total of 28 atoms (16 O, 8 Ca, 4 Si atoms).31 According to reports, the γ-C2S crystal form has a low dissolution rate and high symmetry, which leads to fewer surface reaction sites and hydration inertness.32 The γ-C2S has higher carbonation activity, which makes it more valuable to research.
All calculations were performed based on the original γ-C2S cell, and the specific structure of γ-C2S is shown in Fig. 1(a). To avoid excessive concentration of dopant atoms, the solidification mechanism study used a 2 × 1 × 2 supercell as the doping model, as shown in Fig. 1(b). The chosen surface model chosen is the (010) crystal surface of γ-C2S, which has the lowest surface energy.32 The thickness of the surface model vacuum layer was set to 15 Å. The specific parameters are shown in Fig. 1(c)–(f).
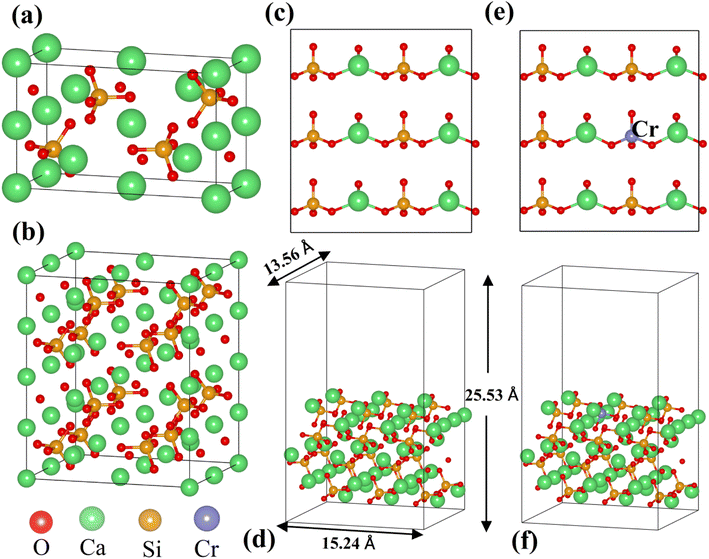 | ||
| Fig. 1 Model of the calculations: (a) pristine of γ-C2S, (b) 2 × 1 × 2 supercell cells of γ-C2S, (c and d) pure γ-C2S (010) surface, and (e and f) Cr-doped γ-C2S (010) surface. | ||
2.2 Calculation approaches
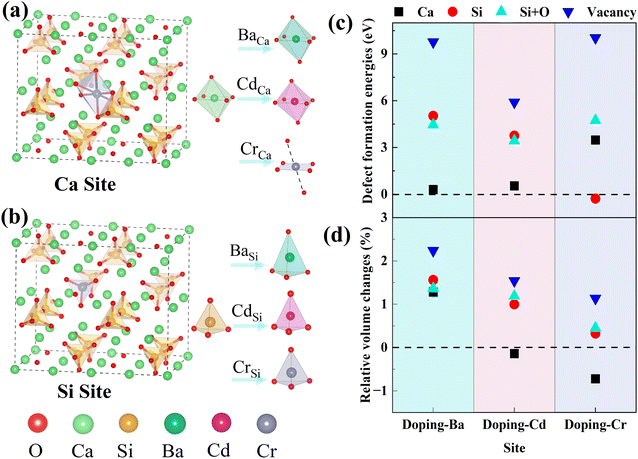
The Vienna Ab initio Simulation Package (VASP)33 was used for all model electronic performance calculations and geometry optimization. The Perdew–Burke–Ernzerhof (PBE) method and the projector augmented plane wave (PAW) method were used for the electron were dealt with function in the VASP calculation.34,35 The specific parameters are set as follows: the kinetic energy cut-off is 520 eV, the Brillouin zone was sampled with 2 × 2 × 2 k-points, the maximum residual stress is 0.01 eV Å−1 and the energy convergence criteria is 10−5 eV per atom. Crystal Orbital Hamiltonian Preoccupation (COHP) was calculated by the LOBSTER software package.36 The results produced by LOBSTER were visualized by the wxDragon software.In order to clarify the substitution preference of impurity ions in γ-C2S, several doping models with different substitution sites were constructed. Fig. 2(a) and (b) shows the Ca and Si site substitution models for the studied clinker mineral phases. The energies of formation of the defects (Ef) for all the types of doping are obtained by carrying out the calculations given in the following equations:37
E0 is the total energy of the pure γ-C2S crystals, E is the energy of the doped crystals, n is the number of impurity atoms (Ba, Cd, Cr), μ is the chemical potentials, and i is the impurity atom type. As the chemical potential is closely related to its surrounding chemical environment, the chemical potential is calculated from its bulk oxide material to ensure that the chemical potential before and after doping is approximate. The adsorption energy (ΔEad) is calculated as follows:
| ΔEad = Etotal − Eslab − Ewater |
3. Results and discussions
3.1 Dopants in γ-C2S
Dopant ions were introduced to the Ca site, Si site, Si + O site (replacing a silicon atom and an oxygen atom with a dopant atom), and vacancy (V) of γ-C2S, respectively, and the defect formation energies (Ef) were calculated to ascertain the precise substitution sites of these three atoms. The values of Ef indicate the likelihood and stability of defect formation. Lower formation energies stand for more stable defect states that are more likely to form energetically. The Ca atoms in γ-C2S can be classified into two types based on the chemical environment. The Ef of the impurities at all types of Ca sites was calculated and the results show that the Ef is close. Therefore, the average value was used as the final defect formation energy.The defect formation energy results are shown in Fig. 2(c). The lowest defect formation energies occurred when Ba and Cd ions substituted Ca sites. This means that Ba and Cd ions are most likely to replace Ca sites of γ-C2S. Interestingly the Ef for Cr substitution of Si exhibits a negative value, which implies that Cr can easily enter into γ-C2S and substitute Si. Ef is positive in other doping systems. Positive values of Ef indicate that energy is required for defect formation. The γ-C2S clinker is calcined at a temperature of 1570 K, which provides energy for the entry of impurity ions. Therefore, positive values of Ef do not imply that impurity ions cannot get inside the γ-C2S crystals. Three external ions introduced into the system in the form of replacing vacancies all exhibit extremely high Ef, indicating that the impurity ions are difficult to enter into the crystal interstices. This is because the γ-C2S crystal structure is so dense that impurity ions cannot exist in the crystal interstices.38 Impurity ions prefer to enter γ-C2S crystals by replacing Ca/Si ions. From the defect formation energies, it can be concluded that Ba and Cd ions tend to substitute Ca sites, whereas Cr ions tend to substitute Si sites.
3.2 Heavy-metal ions solidification in γ-C2S
The relative volume changes of γ-C2S doped with the metal ions (Ba, Cd, and Cr) at different positions are shown in Fig. 2(d). When Ba and Cd were doped to the Ca site, the resulting volume changes were relatively small. However, when Cr ions are introduced into the Ca site, there is a larger volume collapse, but a smaller change is observed at the Si site. Detailed crystal structure parameters before and after doping are shown in Table S1 in the ESI Document.† This is approximately the same as the result of the defect formation energy, which implies that the change in volume of the system before and after doping has some correlation with the substitution preference of the ions. This is because the more significantly the γ-C2S crystal structure is distorted by the introduction of impurity ions, the more difficult it is to form the doped system.For the doped γ-C2S, the distortion of the crystal's overall structure is usually ascribed to local structural distortions caused by impurity ions. In pure γ-C2S, the Ca and Si atoms are 6-coordinated and 4-coordinated, respectively. The local coordination structure changes at the doping site before and after doping are shown in Fig. 2(a) and (b). The introduction of Ba and Cd ions into the different substitution sites of γ-C2S caused almost no change to its local coordination. In contrast, when Cr is introduced into the Ca site, the local coordination changes from the original 6-coordination of Ca to the 4-coordination of Cr, which is the immediate cause of the volume contraction of γ-C2S crystals when Cr replaces Ca. In the situation that the metal atomic coordination number remains unchanged before and after doping, the volume change originates from the change in bond length and bond angle. As a result, the following part will focus on examining the alterations in bond structures.
The BO–BL can reflect the changes in the bonding structure at the defect site. Mulliken population analysis can be used to characterize bond lengths, bond order, and other bond structure information in the system.4 Fig. 3(a)–(c) analyses the BO–BL distribution of cations before and after doping in γ-C2S crystals. The more coincidentally the BO–BL distributions between the guest (Ba, Cd, Cr)-oxygen and the host (Ca, Si)-oxygen overlap, the more similar the bond properties will be. The smaller the structural changes induced by the substitution of the impurity ions for the host ions. In the pure γ-C2S, the Si–O bonds exhibit a higher bond order than the Ca–O bonds. Generally, the covalent bonding property and strength of the bond are stronger when the BO value is closer to 1. This implies that the bonding strength of Si–O bonds is greater than Ca–O bonds in pure γ-C2S crystals.
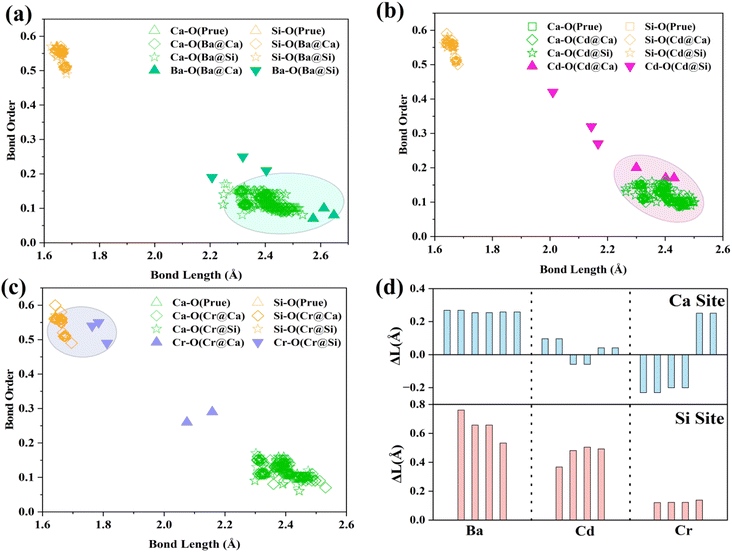 | ||
| Fig. 3 BO–BL (bond order and bond length) distribution: (a) Ba-doped γ-C2S, (b) Cd-doped γ-C2S, (c) Cr-doped γ-C2S. (d) Variations of bond length (ΔL was defined as LBa/Cd/Cr–O − LCa/Si–O). | ||
For the Cr-doped substituted Si sites, the bond lengths and bond order values of the Cr–O bonds are closer to those of the Si–O bonds in γ-C2S. This suggests that the Cr–O bonding properties are closer to those of the Si–O bonding. Ba–O and Cd–O formed by doping Ba and Cd at the Ca site exhibit lower BO and longer BL, and their distribution is close to that of Ca–O. This suggests that the bonding properties of Ba and Cd ions are similar to the bonding properties of Ca ions. Fig. 3(d) visualizes the bond length difference between the dopant ion and the substituted ion. The overall distortion of the crystal is caused by local structural changes resulting from variations in the bond structure.
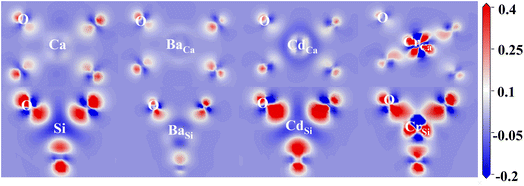
The effect of doping on the electronic structure was calculated to reveal the intrinsic reasons for the substitution preference of impurity ions. Electron density difference (EDD) is a visual parameter that reflects the strength of bonding between atoms. The EDD of doped and pure γ-C2S are shown in Fig. 4. The red color indicates the accumulation of electrons in the atom and the blue color represents electron depletion. The oxygen site in each figure displays a bright red due to its high electronegativity.
In γ-C2S, significant charge transfer is observed at Si atoms, while Ca atoms show relatively weak electron transfer. At the Ca substitution site, Ba and Cd atoms exhibit similar charge profiles to Ca, while Cr has a significantly stronger charge transfer. At the Si substitution site, Ba exhibits a weaker charge transfer than Si, while Cr and Cd have similar charge states to Si. The bonding properties are determined by the electron contributions between the bonding atoms. The more similar the charge contributions of the dopant ions and the substituted ions during the bonding process, the closer the bonding properties will be,37 which is the main origin of ionic substitution tendencies.
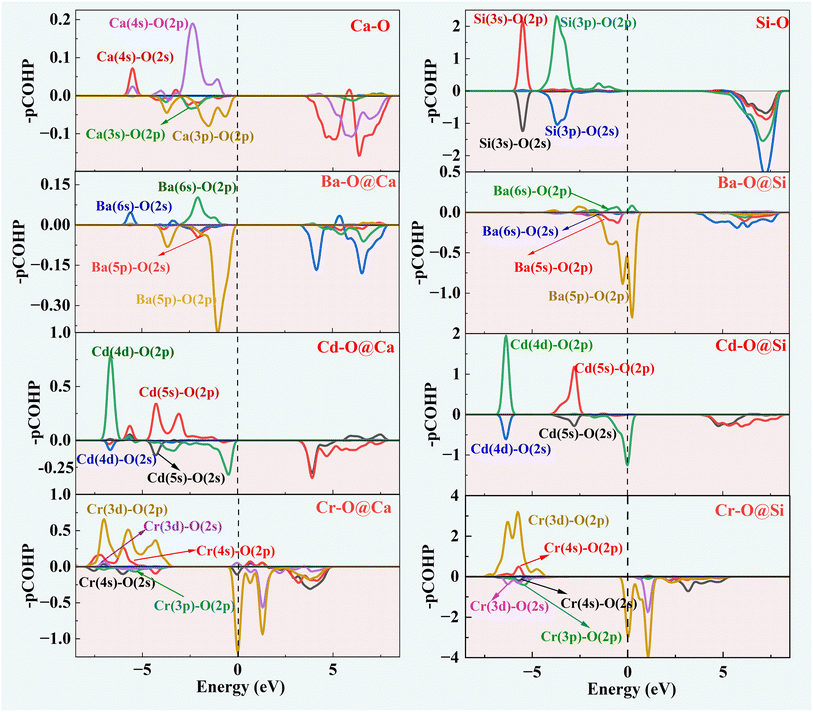
The COHP method provides an analysis of the contribution of bonding and antibonding orbitals to the chemical bonding in a system. The positive part of –COHP indicates bonding contribution and the negative value indicates anti-bonding effect. The part below the Fermi energy level is generally discussed at COHP.
Fig. 5 depicts the orbital interactions of the three dopant atoms with O atoms at the Ca and Si substitution sites. For Si–O and Ca–O bonds, Ca[4s]–O[2p/2s] and Si[3s/3p]–O[2p] are the main bonding occupied orbitals. The bonding orbital contribution of Si–O is much stronger than that of Ca–O. This leads to stronger covalent bonding properties for Si–O bonds and stronger ionic bonding properties for Ca–O bonds. In the three doping systems, Ba[6s]–O[2p], Cd[4d/5s]–O[2p] and Cr[3d/4s]–O[2p] are the bonding orbitals, while Ba[5p/5s]–O[2p], Cd[4d/5s]–O[2s] and Cr[3d/3p]–O[2p] orbitals provide the major anti-bonding. It can be observed that the anti-bonding orbital effect of Ba–O is strong and therefore Ba–O has a low bond order. The bonding contribution role of the Cd-4d orbital is closer to that of the Ca-3p orbital. The Cr-3d electronic orbitals are half full and contribute significantly to the bonding orbitals, resulting in a high Cr–O bond order similar to that of Si–O bonds.
The –ICOHP is obtained by integrating the bonding and antibonding orbital regions, which gives a visual indication of bond strength. As shown in Table 1, when Ca is substituted by Ba, Cd atoms, the Cd–O and Ba–O bond lengths resemble Ca–O, and the corresponding –ICOHP values are also similar. However, the Cr–O bond lengths noticeably reduce. Regarding Cr doping, the Cr–O and Si–O bond properties are more similar. The preference for substitution is determined by the similar charge contribution of ions during the bonding process. Herein, the intrinsic mechanism of the solid solution tendency of the three impurity ions has been revealed. The effect of the introduction of impurity ions on the hydration properties of γ-C2S will be further investigated.
| Ca–O | BaCa–O | CdCa–O | CrCa–O | Si–O | BaSi–O | CdSi–O | CrSi–O | |
|---|---|---|---|---|---|---|---|---|
| Distance (Å) | 2.37 | 2.61 | 2.38 | 2.08 | 1.66 | 2.31 | 2.12 | 1.79 |
| –ICOHP (eV) | 0.52 | 0.40 | 0.61 | 2.01 | 6.94 | 0.94 | 1.41 | 6.04 |
3.3 Early hydration reactivity of doped γ-C2S
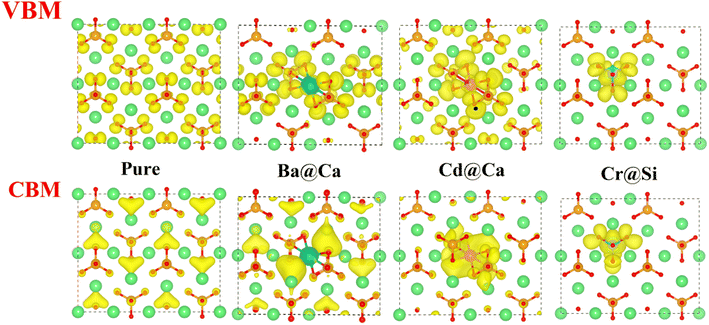
The Valence Band Maximum (VBM) is the most prone to electron depletion, whereas the Conduction Band Minimum (CBM) is the region that is the most susceptible to electron enrichment.39 At the atomic energy level, the regions of the system that contribute to the VBM are the most electrophilic reaction sites. They are highly susceptible to electrophilic attack. Similarly, the CBM is part of the system that is highly susceptible to electron acceptance and they are nucleophilic reaction sites. Therefore, the local charge density (LCD) of VBM and CBM can visually express the chemical reactivity of the system.The LCD of pure and doped γ-C2S crystals are shown in Fig. 6. The yellow area indicates the charge density of the atoms. For pure γ-C2S, VBM clusters are around O atoms, indicating that O atoms are more prone to lose electrons and are susceptible to suffer electrophilic attacks, whereas CBM is uniformly distributed in the region surrounded by Ca atoms. In the ion-doped γ-C2S phase, the Cd and Cr ions significantly change the distribution of nucleophilic and electrophilic reaction sites. Charge localization occurs in the heavy metal ions Cr- and Cd-doped γ-C2S phases, especially in the Cr-doped system. This is because the Cr-3d electron orbitals span the Fermi energy scale and are occupied for both VBM and CBM.40 The reaction sites are concentrated around the dopant ions, which may increase the reactivity around the dopant ions, but excessive localization of the reaction sites may decrease the overall reactivity.41
Fig. 7(a) illustrates the DOS of the pure and doped γ-C2S in the vicinity of the Fermi level, a region that is highly correlated with electrochemical reactivity.40 In pure γ-C2S, the VBM and CBM are predominantly occupied by O-2p and Ca-3p orbitals, which could explain the LCD results. Fig. 7(b) and (c) shows the DOS of γ-C2S doped with Ba and Cd atoms. The introduction of Ba and Cd atoms results in the extrinsic unoccupied Ba-6s and Cd-5s orbitals introduced in the band gap of the doped phase. This explains the appearance of nucleophilic reactive sites in the LCD of the CBM near Ba and Cd atoms. Fig. 7(d) illustrates the DOS of Cr-doped γ-C2S, where it can be observed that the Cr-3d orbital fully extends over the Fermi energy level, contributing to both CBM and VBM.
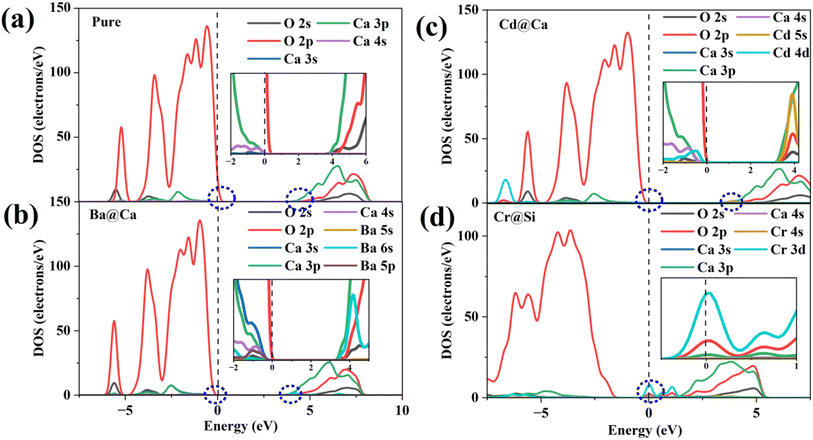 | ||
| Fig. 7 Density of states (DOS): (a) pure γ-C2S, (b) Ba-doped γ-C2S, (c) Cd-doped γ-C2S, (d) Cr-doped γ-C2S. | ||
This finding explains the localization of the nucleophilic and electrophilic reaction sites near the Cr atom in the Cr-doped γ-C2S system. Moreover, it has been discovered that the strength of the DOS peak of O-2p has significantly decreased in the Cr-doped system. This decrease in strength may lead to a reduction in the electrophilic reactivity of the O site. This also supports the notion that excessive localization of charge of charge could reduce the reactivity of other sites. The DOS for the remaining models is shown in Fig. S2† in the ESI.† Substitution of the Cr ion at the Ca site and the Cr-3d orbital also crosses the Fermi energy level but does not result in a significant decrease in the DOS peak for O-2p. This suggests that the introduction of impurity ions at different sites may have different effects on the reaction site.
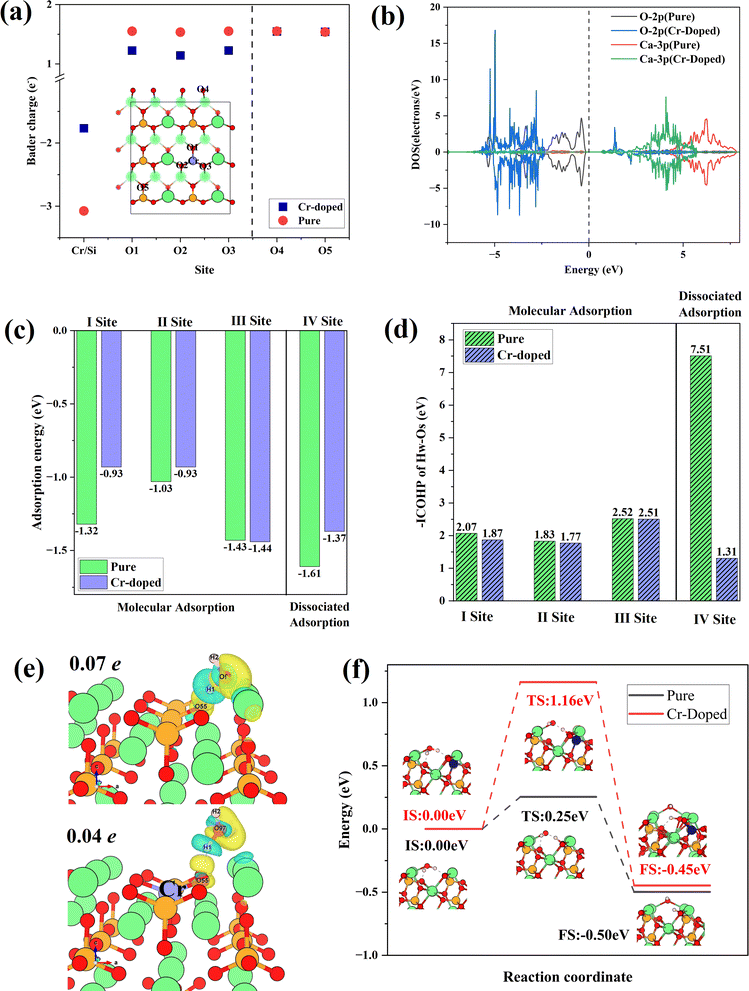
The introduction of Cr ions caused excessive charge localization according to bulk phase modeling calculations. The water adsorption behavior on doped and pure γ-C2S (010) surfaces was estimated in order to further understand the impact of this charge localization effect on the reactivity. Adsorption of water on the surface is the initial step in the early hydration reaction of C2S. Examining the adsorption behavior of surface water molecules can provide a better understanding of the impact of Cr doping on the reactivity of γ-C2S.
Fig. 8(a) shows the Bader charge of surface O atoms in Cr-doped and pure γ-C2S, which could reflect charge transfer. The O atoms at the doping site are designated as O (1-3), while the O atoms furthest from the doping site are designated as O4, and O5. The Bader charge of O atoms decreased with Cr doping. This effect is confined to the vicinity of the doping site and has little effect on distant O atoms. Fig. 8(b) shows the density of states of O and Ca atoms around the doping site. Compared to pure γ-C2S, the 2p orbitals of O atoms in the vicinity of Cr are shifted towards deep energy levels, while the 3p orbitals of Ca atoms are closer to the Ef. This demonstrates that doping with Cr alters the charge state of the surrounding atoms, thereby impacting surface reactivity.
The water adsorption configurations at four different sites in Cr-doped and pure γ-C2S are shown in Fig. S3 in the ESI Document.† The initial adsorption configuration is denoted by IS, while the final state adsorption configuration is represented as FS. Sites I–III are molecular adsorption and site IV is dissociative adsorption. Water molecules on sites I, II, and IV are above the doping site and site III is away from the doping site. For the molecular adsorption of H2O, H2O molecules were not dissociated in both Cr-doped and pure γ-C2S. Hydrogen atoms (Hw) in H2O molecules point to surface oxygen atoms (Os), while oxygen atoms (Ow) in water molecules point to surface Ca atoms. For the dissociative adsorption of water molecules, in pure γ-C2S, Os is bonded to Hw, and Ow is bound by two Ca atoms on the surface. In contrast, protons form H2O molecules with OH in the Cr-doped γ-C2S. Detailed bonding information for surface-adsorbed water molecules is given in Table S2.† This indicates that the introduction of Cr ions weakens the dissociative adsorption of water molecules on the surface.
The adsorption energies for molecular and dissociative adsorption of water are shown in Fig. 8(c). The introduction of Cr reduces the adsorption energy near the doping site. The results indicate that introducing Cr weakens the adsorption of H2O on γ-C2S. Moreover, this weakening effect only manifests in adsorption near the doping site and has no significant effect on adsorption away from the doping site (III). Fig. 8(d) shows the –ICOHP values for OS and HW, which can measure the chemical bond strength. The introduction of Cr weakens the bonding strength of OS to HW, which explains the weakening of water adsorption on the surface induced by Cr doping. The results indicate that the introduction of Cr weakens the adsorption of water molecules on the surface of γ-C2S, which may hinder the early hydration activity of γ-C2S. The differential charges of water molecules adsorbed on the pure and Cr-doped γ-C2S surfaces are shown in Fig. 8(e). The effect of Ba, Cd ion doping on surface water adsorption is shown in Fig. S4 in the ESI Document,† with all adsorption initial sites correspond to the pure γ-C2S described above. The introduction of Cd caused a decrease in the adsorption energy near the doping site, which also can be attributed to the excessive localization of charge. The introduction of Ba ions also weakened the adsorption of H2O molecules on the surface, and the effect originates from Ba atoms rather than surface O atoms.
The H2O molecules on the Cr-doped surface have a weaker charge exchange compared to pure γ-C2S. This is also evidenced by the values of surface Bader charge before and after adsorption, with a charge transfer of 0.07 electron for the pure γ-C2S surface and 0.04 electron for the Cr-doped surface. The dissociation reaction pathways of water on the surface of Cr-doped and pure γ-C2S were considered, as shown in Fig. 8(f). In pure γ-C2S, the initial state (IS) is that the water molecule is adsorbed on the surface, and the final state (FS) is that the water molecules dissociate the –H and –OH adsorbed on the surface. The energy barrier is 0.25 eV for the process. It is the same as the water adsorption configuration on pure γ-C2S for the water molecule adsorbed on IS and FS of Cr-doped the γ-C2S surface. The value of the energy barrier increases to 1.16 eV for the water molecules adsorbed on the Cr-doped γ-C2S surface. The results show that the Cr-doped in γ-C2S can inhibit the dissociation of water molecules to achieve the reduction of the hydration reaction rate.
4. Conclusions and discussions
In this work, the solidification mechanism and the effect on initiating hydration of these three heavy-metal ions (Ba, Cd, and Cr) in γ-C2S is systemically studied by well-defined ab initio calculations. Our results show that: (1) In the γ-C2S crystalline phase, Ba and Cd ions tend to occupy Ca sites, while Cr ions prefer to occupy Si sites. (2) The introduction of impurity ions causes lattice distortions, which are caused by bonding differences between the substituted ions (Ca, Si)–O and the dopant ions (Ba, Cd, Cr)–O. (3) The introduction of Cr causes charge localization, which passivates the surface O activity of γ-C2S and weakens the adsorption of water molecules on its surface. These findings are hopeful to provide theoretical guidance on the utilization of solid waste for the production of low-carbon cement.5. Environmental implication
The cement industry brings high CO2 emissions, energy consumption, and waste disposal, which cause serious environmental problems. Low-carbon cement from solid waste can be an effective way to address this problem. However, this method inevitably introduces impurity ions into the clinker crystals. These ions significantly influence the phases of compositions and the properties of the clinker minerals. This work investigates the solid solution mechanism of several hazardous metal ions in γ-C2S by well-defined ab initio calculations, which pave the way for the basic guidelines for solid waste disposal and low-carbon cement production.Conflicts of interest
The authors declare no competing interests.Acknowledgements
This work was supported by the Key Technologies R&D Program of CNBM (No. 2021YCJS01-2), the National Key Research and Development Plan of China (Grant no. 2019YFC1904900), the State Key Laboratory of Refractories and Metallurgy, Wuhan University of Science and Technology (No. G201605), and Fundamental Research Funds for the Central Universities (No. WUT35401053-2022).References
- H.-M. Ludwig and W. Zhang, Research Review of Cement Clinker Chemistry, Cem. Concr. Res., 2015, 78, 24–37 CrossRef CAS
.
- A. Favier, C. De Wolf. K. Scrivener and G. Habert, A Sustainable Future for the European Cement and Concrete Industry: Technology Assessment for Full Decarbonisation of the Industry by 2050, ETH Zurich, 2018 Search PubMed
.
- C. A. Hendriks, E. Worrell, D. De Jager, K. Blok and P. Riemer, Emission Reduction of Greenhouse Gases from the Cement Industry, In Proceedings of the Fourth International Conference on Greenhouse Gas Control Technologies, IEA GHG R&D Programme Interlaken, Austria, 1998, pp. 939–944 Search PubMed
.
- C. F. Guerra, J.-W. Handgraaf, E. J. Baerends and F. M. Bickelhaupt, Voronoi Deformation Density (VDD) Charges: Assessment of the Mulliken, Bader, Hirshfeld, Weinhold, and VDD Methods for Charge Analysis, J. Comput. Chem., 2004, 25, 189–210 CrossRef CAS PubMed
.
- L. Barcelo, J. Kline, G. Walenta and E. Gartner, Cement and Carbon Emissions, Mater. Struct., 2014, 47, 1055–1065 CrossRef CAS
.
- A. Carriço, J. A. Bogas and M. Guedes, Thermoactivated Cementitious Materials – a Review, Constr. Build. Mater., 2020, 250, 118873 CrossRef
.
- C. Horsley, M. H. Emmert and A. Sakulich, Influence of Alternative Fuels on Trace Element Content of Ordinary Portland Cement, Fuel, 2016, 184, 481–489 CrossRef CAS
.
- S. Kundu, A. Aggarwal, S. Mazumdar and K. B. Dutt, Stabilization Characteristics of Copper Mine Tailings through Its Utilization as a Partial Substitute for Cement in Concrete: Preliminary Investigations, Environ. Earth Sci., 2016, 75, 1–9 CrossRef CAS
.
- A. Cuesta, A. Ayuela and M. A. Aranda, Belite Cements and Their Activation, Cem. Concr. Res., 2021, 140, 106319 CrossRef CAS
.
- K. L. Scrivener, P. Juilland and P. J. M. Monteiro, Advances in Understanding Hydration of Portland Cement, Cem. Concr. Res., 2015, 78, 38–56 CrossRef CAS
.
- Y. L. Chen, C.-J. Lin, M. S. Ko, Y. C. Lai and J. E. Chang, Characterization of Mortars from Belite-Rich Clinkers Produced from Inorganic Wastes, Cem. Concr. Compos., 2011, 33, 261–266 CrossRef CAS
.
- A. Cuesta, E. R. Losilla, M. A. G. Aranda, J. Sanz and Á. G. De la Torre, Reactive Belite Stabilization Mechanisms by Boron-Bearing Dopants, Cem. Concr. Res., 2012, 42, 598–606 CrossRef CAS
.
- A. J. M. Cuberos, Á. G. De la Torre, M. C. Martín-Sedeño, L. Moreno-Real, M. Merlini, L. M. Ordónez and M. A. G. Aranda, Phase Development in Conventional and Active Belite Cement Pastes by Rietveld Analysis and Chemical Constraints, Cem. Concr. Res., 2009, 39, 833–842 CrossRef CAS
.
- K. Fukuda and H. Taguchi, Hydration of α′L- and β-Dicalcium Silicates with Identical Concentration of Phosphorus Oxide, Cem. Concr. Res., 1999, 29, 503–506 CrossRef CAS
.
- Q. Wang, F. Li, X. Shen, W. Shi, X. Li, Y. Guo, S. Xiong and Q. Zhu, Relation between Reactivity and Electronic Structure for α′L-, β- and γ-Dicalcium Silicate: A First-Principles Study, Cem. Concr. Res., 2014, 57, 28–32 CrossRef CAS
.
- W. Chen, G. Lv, W. Hu, D. Li, S. Chen and Z. Dai, Synthesis and Applications of Graphene Quantum Dots: A Review, Nanotechnol. Rev., 2018, 7, 157–185 CrossRef CAS
.
- S. Sinyoung, P. Songsiriritthigul, S. Asavapisit and P. Kajitvichyanukul, Chromium Behavior During Cement-Production Processes: A Clinkerization, Hydration, and Leaching Study, J. Hazard. Mater., 2011, 191, 296–305 CrossRef CAS PubMed
.
- Y. Mu, Z. Liu, F. Wang and X. Huang, Effect of Barium Doping on Carbonation Behavior of γ-C2S, J. CO2 Util., 2018, 27, 405–413 CrossRef CAS
.
- R. Maddalena, J. J. Roberts and A. Hamilton, Can Portland Cement Be Replaced by Low-Carbon Alternative Materials? A Study on the Thermal Properties and Carbon Emissions of Innovative Cements, J. Cleaner Prod., 2018, 186, 933–942 CrossRef CAS
.
- K. Watanabe, K. Yokozeki, R. Ashizawa, N. Sakata, M. Morioka, E. Sakai and M. Daimon, High Durability Cementitious Material with Mineral Admixtures and Carbonation Curing, Waste Manage., 2006, 26, 752–757 CrossRef CAS PubMed
.
- A. M. Barros, J. A. S. Tenório and D. C. R. Espinosa, Evaluation of the Incorporation Ratio of Zno, Pbo and Cdo into Cement Clinker, J. Hazard. Mater., 2004, 112, 71–78 CrossRef CAS PubMed
.
- M. Mahedi, B. Cetin and A. Y. Dayioglu, Effect of Cement Incorporation on the Leaching Characteristics of Elements from Fly Ash and Slag Treated Soils, J. Environ. Manage., 2020, 253, 109720 CrossRef CAS PubMed
.
- S. Sprung, Technological Problems in Pyroprocessing Cement Clinker: Cause and Solutions, Beton-Verlag, 1985 Search PubMed
.
- S. Sinyoung, P. Songsiriritthigul, S. Asavapisit and P. Kajitvichyanukul, Chromium Behavior During Cement-Production Processes: A Clinkerization, Hydration, and Leaching Study, J. Hazard. Mater., 2011, 191, 296–305 CrossRef CAS PubMed
.
- D. Stephan, H. Maleki, D. Knöfel, B. Eber and R. Härdtl, Influence of Cr, Ni, and Zn on the Properties of Pure Clinker Phases: Part I. C3S, Cem. Concr. Res., 1999, 29, 545–552 CrossRef CAS
.
- K. Kolovos, S. Tsivilis and G. Kakali, The effect of foreign ions on the reactivity of the CaO-SiO2-Al2O3-Fe2O3 system Part II: Cations, Cem. Concr. Res., 2002, 32(3), 463–469 CrossRef CAS
.
- P. Zhao, X. Bao, H. Chen, S. Wang, L. Lu, A. G. De La Torre and X. Cheng, Hydration Mechanisms of Ba-Doped Ye'elimite: Effect of Ba/Ca Ratio on Hydration Behavior, Constr. Build. Mater., 2020, 264, 120258 CrossRef CAS
.
- Y. Li, H. Pan, Q. Liu, X. Ming and Z. Li, Ab Initio Mechanism Revealing for Tricalcium Silicate Dissolution, Nat. Commun., 2022, 13, 1253 CrossRef CAS PubMed
.
- F.-Z. Wang, D.-C. Shang, M.-G. Wang, S.-G. Hu and Y.-Q. Li, Incorporation and Substitution Mechanism of Cadmium in Cement Clinker, J. Cleaner Prod., 2016, 112, 2292–2299 CrossRef CAS
.
- W. Kurdowski, Cement and Concrete Chemistry, Springer Science & Business, 2014 Search PubMed
.
- S. Udagawa, K. Urabe, M. Natsume and T. Yano, Refinement of the Crystal Structure of γ-Ca2SiO4, Cem. Concr. Res., 1980, 10, 139–144 CrossRef CAS
.
- Q. Wang, H. Manzano, Y. Guo, I. i. Lopez-Arbeloa and X. Shen, Hydration Mechanism of Reactive and Passive Dicalcium Silicate Polymorphs from Molecular Simulations, J. Phys. Chem. C, 2015, 119, 19869–19875 CrossRef CAS
.
- G. Kresse and D. Joubert, From Ultrasoft Pseudopotentials to the Projector Augmented-Wave Method, Phys. Rev. B: Condens. Matter Mater. Phys., 1999, 59, 1758 CrossRef CAS
.
- P. E. Blöchl, Projector Augmented-Wave Method, Phys. Rev. B: Condens. Matter Mater. Phys., 1994, 50, 17953 CrossRef PubMed
.
- J. P. Perdew, K. Burke and M. Ernzerhof, Generalized Gradient Approximation Made Simple, Phys. Rev. Lett., 1996, 77, 3865 CrossRef CAS PubMed
.
- R. Dronskowski and P. E. Bloechl, Crystal Orbital Hamilton Populations (Cohp): Energy-Resolved Visualization of Chemical Bonding in Solids Based on Density-Functional Calculations, J. Phys. Chem., 1993, 97, 8617–8624 CrossRef CAS
.
- Y. Tao, W. Zhang, D. Shang, Z. Xia, N. Li, W.-Y. Ching, F. Wang and S. Hu, Comprehending the Occupying Preference of Manganese Substitution in Crystalline Cement Clinker Phases: A Theoretical Study, Cem. Concr. Res., 2018, 109, 19–29 CrossRef CAS
.
- H. F. W. Taylor, Cement chemistry, Thomas Telford, London, 1997 Search PubMed
.
- E. Durgun, H. Manzano, R. J. M. Pellenq and J. C. Grossman, Understanding and Controlling the Reactivity of the Calcium Silicate Phases from First Principles, Chem. Mater., 2012, 24, 1262–1267 CrossRef CAS
.
- Y. Tao, W. Zhang, N. Li, F. Wang and S. Hu, Predicting Hydration Reactivity of Cu-Doped Clinker Crystals by Capturing Electronic Structure Modification, ACS Sustain. Chem. Eng., 2019, 7, 6412–6421 CrossRef CAS
.
- D. Hou, Z. Ding, P. Wang, M. Wang, Q. Xu, X. Wang, J. Guan, Y. Su and Y. Zhang, Influence of Cu Doping on the Hydration of Dicalcium Silicate: A First-Principles Study, ACS Sustain. Chem. Eng., 2022, 10, 8094–8104 CrossRef CAS
.
Footnote |
| † Electronic supplementary information (ESI) available. See DOI: https://doi.org/10.1039/d4ra01214c |
| This journal is © The Royal Society of Chemistry 2024 |


