 Open Access Article
Preparation of porous polylactic acid nanofibers and application in non-electret high-efficiency filtration composites
Jian Xing *ab,
Wenjing Zhanga,
Shaoyang Suna and
Zhen Liua
aSchool of Textile and Garment, Anhui Polytechnic University, Wuhu, 241000, Anhui, PR China. E-mail: xingjian@ahpu.edu.cn
bInternational Cooperation Research Center of Textile Structure Composite Materials, Anhui Polytechnic University, Wuhu, 241000, Anhui, PR China
First published on 7th May 2024
Abstract
Air pollution caused by fine particulate matter (PM0.3) has drawn increasing attention as an overwhelming threat to public health. Electret treatment is commonly used to improve the filtration performance of commercial fibrous filter materials by enhancing the electrostatic adsorption effect, but it is greatly affected by environmental factors (especially humidity). Moreover, filter materials are generally non-degradable and non-recyclable, causing serious environmental pollution. Herein, a strategy to manufacture fully degradable polylactic acid (PLA) filtration composites based on porous PLA nanofibers prepared by electrospinning was investigated in this study. Porous, bead-on-string and conventional PLA nanofibers could be obtained by adjusting spinning condition parameters. The porous PLA nanofibers exhibited 9.8 times greater specific surface area (24.01 m2 g−1) and 18 times more cumulative pore volume (0.108 cm3 g−1) than conventional PLA nanofibers. More importantly, fibrous filtration composites based on porous PLA nanofibers possessed a high PM0.3 filtration efficiency (99.9989%), low pressure drop (90.35 Pa) and high air permeability (72.4 Pa−1) at an air flow rate of 32 L min−1 without electret treatment. The fibrous filtration composites based on conventional or bead-on-string PLA nanofibers also exhibited excellent filtration performance (>99.99%), but the associated high pressure drop and low air permeability limited their application.
1 Introduction
With the rapid development of global industrialization and urbanization, air pollution is a cause of increasing concern due to the overwhelming threats and damage to human health it creates, especially the haze problem caused by particulate matter (PM).1–3 In particular, fine particulate matter with a diameter of less than 2.5 μm (PM2.5), especially PM0.3, has been proven to be able to enter bronchioles and lungs almost unhindered.4,5 Moreover, these particulate matters include many substances harmful to human health, such as heavy metals, microorganisms, bacteria and viruses, which can present teratogenic, mutagenic and carcinogenic risks and cause respiratory infections, lung cancer, and cardiovascular diseases.6,7 Furthermore, recent findings have proved that viruses carried in PM2.5 are one of the important potential causes of the worldwide outbreak of the COVID-19 pandemic.4,8–10 At present, emission reduction and passive filtration are the main effective solutions to alleviate the threats of and damage caused by particulate matter.11 Therefore, filter materials for personal protection and indoor air purification that can effectively capture particulate matter, are in high demand in recent years.Currently, fibrous filter materials have become the most widely used among numerous filter materials because of their high porosity, controllable shape, simple processing technology and easy mass production. Common fibrous filter materials mainly contain spun-bond nonwovens, melt-blown nonwovens, and needle-punched nonwovens.12–17 Among these non-woven materials, melt-blown nonwovens are currently core materials for masks and respirators used for personal protection and indoor air purification because of their high porosity, small fiber dimeter, large specific surface area and simple preparation process. Moreover, commercial melt-blown nonwovens used for air filtration are usually composed of electrically charged fibers, which can improve the filtration efficiency of common melt-blown nonwovens with respect to fine particles (≤0.5 μm) due to the micro-scale fiber diameter and relatively large pore size.18–20 Therefore, electret melt-blown nonwovens play an increasingly important role in air pollution control because of their outstanding filtration performance and relatively low filtration resistance, which stem from their superior electrostatic adsorption.21–24 However, improving the electrostatic attenuation of electret melt-blown nonwovens has always been challenging, which seriously affects their filtration performance and service life.
It is well known that environmental factors (such as ambient humidity, temperature, and air dust) have an important impact on the charge storage of electret melt-blown nonwovens.23,25–27 The surface charge of melt-blown nonwovens used for masks has been found to be extremely dissipated by just moist human breath, resulting in a significant decrease in filtration efficiency.28–30 The attenuation of filtration efficiency will cause the masks to fail to meet the filtration requirements, increasing the risk of human exposure to pollution.31,32 Therefore, some studies of methods to improve the retention of electrostatic charge have been carried out, such as the thermal polarization method, corona discharge method, triboelectrification method, water electret method and the addition of an inorganic electret in the fibers.18,21,25,27 Zhang et al. improved the filtration efficiency of PLA melt-blown nonwovens by more than 20% via the corona electret method.12 Zhang et al. reported a thermally stimulated charging method to prepare an electret melt-blown filter with a filtration efficiency of 99.65%, pressure drop of 120 Pa, and improved charge stability over 60 days.18 Cho et al. prepared a PBAT@CTAB–MMT nanofiber-membrane-based filter, which could continuously retain electrostatic charges on the surface due to the triboelectric effect of CTAB–MMT. The filter showed high filtration efficiency (98.3%, PM0.3) at a differential pressure of 40 Pa.25 As mentioned above, the filtration efficiency and charge stability could be improved, but the charge attenuation was still not completely resolved.
In addition, an increasing number of studies have focused on the use of nanofibrous membranes to improve the filtration efficiency and reduce the impact of electrostatic attenuation, based on their large specific surface area, controllable fiber diameter, high porosity, small pore size, and porous microstructure with interconnected pores.33–36 Among numerous technologies for manufacturing nanofibrous membranes, electrospinning has been acknowledged as the most common, cost-effective and versatile continuous process due to its simplicity of use and the diversity of applicable raw materials.35 In recent years, various types of polymers, including polyacrylonitrile (PAN), polyurethane (PU), polyimide (PI), polyamide-66 (PA-66), polysulfone (PSF), poly(ethylene glycol) (PEG), polystyrene (PS), polypropylene (PP), polyethylene terephthalate (PET) and polylactic acid (PLA), have been successfully electrospun into nanofibrous membranes for use as air filtration media.7,8,11,31,36,37 However, most of these are petroleum-based materials, which can cause a serious burden on the environment due to the huge annual consumption of air filter media. Moreover, the traditional spunbonded, melt-blown and needle-punched nonwoven filter materials are also mostly prepared using petroleum-based materials.10,37
Poly(lactic acid) (PLA), which possesses good biocompatibility, excellent biodegradability, appropriate mechanical properties and good processibility, has been widely considered as a potential substitute to replace petroleum-based materials.10,14,22,37 At present, PLA has attracted increasing attention for application in air filtration due to its good biodegradability. PLA melt-blown nonwovens have been widely researched as air filter media,10 but the low dielectric constant of PLA limits their charge storage capability, resulting in serious electrostatic attenuation. PLA nanofibrous membranes have also been prepared via electrospinning to study the air filtration performance. Li et al. reported a bead-on-string PLA/chitosan composite fibrous membrane fabricated via electrospinning; it exhibited a filtration efficiency of 98.99% for 260 nm particles with a pressure drop of 147.6 Pa.7 Sun et al. prepared a branched PLA nanofiber material by electrospinning, which achieved a high PM0.3 removal efficiency (99.95%) and low air resistance (79.67 Pa).38 Wang et al. reported hierarchical structured nano-sized/porous PLA composite fibrous membranes for air filtration, which exhibited a filtration efficiency of 99.999% for 260 nm particles with a relatively low pressure drop (93.3 Pa) at a low face velocity of 5.3 cm s−1.14 As mentioned above, the shape of the PLA nanofibers could significantly influence the filtration performance of filters. Hence, changing the surface shape (such as the pore structure) of the PLA nanofibers may be an effective way to improve the air filtration performance.39 However, charge elimination of electrospun PLA nanofibers was not performed in previous studies;7,8,14,31,38 this could improve the test results of filtration performance due to the electret effect of electrospinning. Thus, the effect of the nanofiber shape on filtration performance has rarely been accurately reported.
In this study, PLA nanofibers with different surface shapes were prepared by changing spinning process parameters to improve the specific surface area of the PLA nanofibrous membranes. The air filter materials were then manufactured by compositing PLA spunbonded nonwovens and porous PLA nanofibrous membranes via charge elimination. The surface morphology and specific surface area of the PLA nanofibers were carefully studied. The PM0.3 filtration performance of PLA-based air filter materials was also investigated.
2 Materials and methods
2.1 Materials
PLA (Ingeo™ Biopolymer 6060D, melt index (210 °C, 2.16 kg) = 8–10 g/10 min, relative viscosity of 1.24 g cm−3) was obtained from Nature Works LLC (Plymouth, MN, USA). PLA spunbonded nonwovens (areal density of 25 g m−2) were prepared in our laboratory. Chloroform (CF) was purchased from Sinopharm Group Chemical Reagent Co., LTD (Shanghai, CN). N,N-Dimethylformamide (DMF) was purchased from Shanghai Aladdin Biochemical Technology Co., LTD (Shanghai, CN). All chemicals were of analytical grade and were used without further purification.2.2 Preparation of PLA electrospinning nanofibrous membranes
A blended solution of CF/DMF was used as the solvent for PLA. Initially, PLA was dissolved via stirring for 12 h at room temperature. The solution was then loaded into a 10 mL plastic syringe with a stainless-steel needle (0.8 mm inner diameter) and ejected at a controllable feed rate using a syringe pump. The injection rate was 1.0 mL h−1. The PLA nanofibers were then electrospun onto a grounded metal roller with a collecting distance of 15 cm at room temperature. A high voltage was applied to the needle tip through a high-voltage supply. The electrospinning parameters of the PLA nanofibrous membranes were detailed as follows: variation in solvent mixture. The electrospun PLA nanofibers were prepared using 12 wt% PLA spinning solutions with different volume ratios of CF/DMF (7![[thin space (1/6-em)]](https://www.rsc.org/images/entities/char_2009.gif) :
:![[thin space (1/6-em)]](https://www.rsc.org/images/entities/char_2009.gif) 3, 8
3, 8![[thin space (1/6-em)]](https://www.rsc.org/images/entities/char_2009.gif) :
:![[thin space (1/6-em)]](https://www.rsc.org/images/entities/char_2009.gif) 2, 9
2, 9![[thin space (1/6-em)]](https://www.rsc.org/images/entities/char_2009.gif) :
:![[thin space (1/6-em)]](https://www.rsc.org/images/entities/char_2009.gif) 1, and 10
1, and 10![[thin space (1/6-em)]](https://www.rsc.org/images/entities/char_2009.gif) :
:![[thin space (1/6-em)]](https://www.rsc.org/images/entities/char_2009.gif) 0). Electrospinning experiments were carried out with an applied voltage of 15 kV and humidity of 70 RH%. Variation in solution concentration. The electrospun PLA nanofibers were fabricated using 7, 10, 12 and 15 wt% PLA spinning solutions, which were prepared using a CF/DMF (8
0). Electrospinning experiments were carried out with an applied voltage of 15 kV and humidity of 70 RH%. Variation in solution concentration. The electrospun PLA nanofibers were fabricated using 7, 10, 12 and 15 wt% PLA spinning solutions, which were prepared using a CF/DMF (8![[thin space (1/6-em)]](https://www.rsc.org/images/entities/char_2009.gif) :
:![[thin space (1/6-em)]](https://www.rsc.org/images/entities/char_2009.gif) 2) solvent mixture. The electrospinning experiments were carried out with an applied voltage of 15 kV and humidity of 70 RH%. Variation in applied voltage. The PLA nanofibers were electrospun using a 12 wt% concentration of PLA in a solvent mixture of CF/DMF (8
2) solvent mixture. The electrospinning experiments were carried out with an applied voltage of 15 kV and humidity of 70 RH%. Variation in applied voltage. The PLA nanofibers were electrospun using a 12 wt% concentration of PLA in a solvent mixture of CF/DMF (8![[thin space (1/6-em)]](https://www.rsc.org/images/entities/char_2009.gif) :
:![[thin space (1/6-em)]](https://www.rsc.org/images/entities/char_2009.gif) 2) under an ambient humidity of 70 RH%. The application of different high voltages (10, 15, 20 and 25 kV) was carried out to study the effect of voltage on nanofiber morphology. Variation in ambient humidity. The electrospun PLA nanofibers were fabricated using a 12 wt% PLA spinning solution prepared using a CF/DMF (8
2) under an ambient humidity of 70 RH%. The application of different high voltages (10, 15, 20 and 25 kV) was carried out to study the effect of voltage on nanofiber morphology. Variation in ambient humidity. The electrospun PLA nanofibers were fabricated using a 12 wt% PLA spinning solution prepared using a CF/DMF (8![[thin space (1/6-em)]](https://www.rsc.org/images/entities/char_2009.gif) :
:![[thin space (1/6-em)]](https://www.rsc.org/images/entities/char_2009.gif) 2) solvent mixture with an applied voltage of 15 kV. Various ambient humidity values (60, 70, 80 and 90 RH%) were applied to study the effect of humidity on nanofiber morphology.
2) solvent mixture with an applied voltage of 15 kV. Various ambient humidity values (60, 70, 80 and 90 RH%) were applied to study the effect of humidity on nanofiber morphology.
2.3 Preparation of PLA air filtration composites
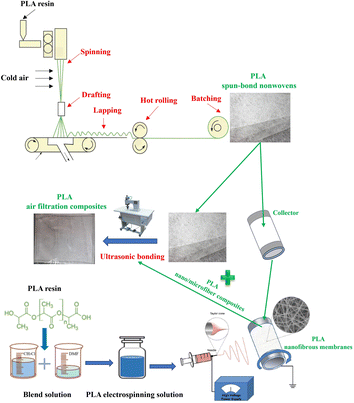
In preparation for electrospinning, a metal roller was first coated with a layer of laboratory-prepared PLA spunbonded nonwovens. The PLA nanofibers were then electrospun on the surface of the PLA spunbonded nonwovens, which were wrapped around the grounded metal roller rotating at 5.0 m min−1. The metal roller was positioned 15 cm from the tip of the needle. The applied spinning times were 3 h, 5 h or 8 h. The obtained PLA nano/microfiber composites were then combined with the PLA spunbonded nonwovens via ultrasonic bonding to manufacture PLA air filter composites, which processed a sandwich-like structure. An ultrasonic lace machine (JC-70-S, Changzhou Jinchao Machinery, China) was used to supply the ultrasonic bonding to fabricate the air filtration composites. The ultrasonic frequency was 20 kHz with a roller pressure of 0.6 MPa and stitching speed of 10 m min−1. The commissure suture width was 5 mm. The obtained PLA air filtration composites were then placed in an environment of 25 °C and 80% RH for 72 h to remove the electrostatic charges and eliminate the impact of electrostatic adsorption on filtration efficiency. A schematic diagram of the preparation process of the PLA air filtration composites is shown in Fig. 1.2.4 Properties and their characterization
The morphologies of the PLA nanofibers were characterized using scanning electron microscopy (SEM, S4800, Hitachi, Japan) with an accelerating voltage of 10 kV. ImageJ software was used to obtain the average fiber diameter by measuring one hundred nanofibers in SEM images. An automatic specific surface area and pore size distribution instrument (ASAP2460, Micromeritics, USA) was used to measure the specific surface area, pore volume, and adsorption of nitrogen molecules of the PLA nanofibrous membranes via the Brunauer–Emmett–Teller (BET) method.The filtration efficiency and pressure drop of the PLA air filtration composites were evaluated using an automated filter tester (LZC-K1, Suzhou Hua Da Instrument and Equipment Co., China) according to GB 2626-2006. Each filter efficiency test was operated at room temperature with an air flow rate of 32 L min−1. Neutralized dioctyl sebacate (DEHS) aerosols with a mass median diameter of 200 nm were adopted as aerosol test PMs. The filtration efficiency (η) of the PLA air filtration composites was calculated based on eqn (1):
 | (1) |
 | (2) |
3 Results and discussion
3.1 Formation of porous PLA nanofibers and BET surface area analysis
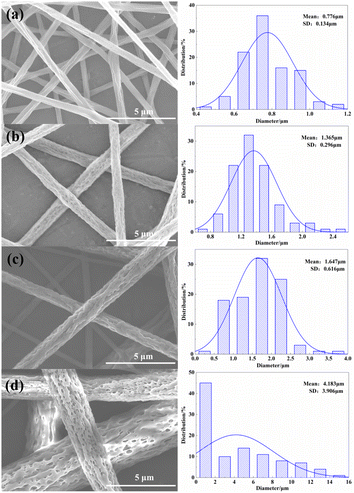
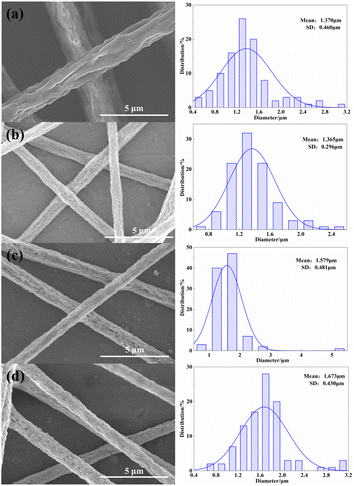
The ratio of CF/DMF in spinning solution has the most important impact on the morphology and fiber diameter of the electrospun nanofibers due to the differences in solvent volatilization. The effect of the CF/DMF ratio in the spinning solution on the nanofiber morphology and fiber diameter was studied under spinning conditions of 12 wt% PLA solution, 15 kV spinning voltage and 70 RH% spinning humidity. As shown in Fig. 2, it was found that the average fiber diameter increased with increasing of CF volume content. The average fiber diameter was 0.776 μm when the CF/DMF volume proportion was 7![[thin space (1/6-em)]](https://www.rsc.org/images/entities/char_2009.gif) :
:![[thin space (1/6-em)]](https://www.rsc.org/images/entities/char_2009.gif) 3, whereas the average fiber diameter (VCF
3, whereas the average fiber diameter (VCF![[thin space (1/6-em)]](https://www.rsc.org/images/entities/char_2009.gif) :
:![[thin space (1/6-em)]](https://www.rsc.org/images/entities/char_2009.gif) VDMF = 10
VDMF = 10![[thin space (1/6-em)]](https://www.rsc.org/images/entities/char_2009.gif) :
:![[thin space (1/6-em)]](https://www.rsc.org/images/entities/char_2009.gif) 0) could reach 4.183 μm. This variation rule could be explained by the viscosity change of PLA spinning solution due to the different volume content of CF. The viscosities of the PLA spinning solutions with different volume ratios of CF/DMF (7
0) could reach 4.183 μm. This variation rule could be explained by the viscosity change of PLA spinning solution due to the different volume content of CF. The viscosities of the PLA spinning solutions with different volume ratios of CF/DMF (7![[thin space (1/6-em)]](https://www.rsc.org/images/entities/char_2009.gif) :
:![[thin space (1/6-em)]](https://www.rsc.org/images/entities/char_2009.gif) 3, 8
3, 8![[thin space (1/6-em)]](https://www.rsc.org/images/entities/char_2009.gif) :
:![[thin space (1/6-em)]](https://www.rsc.org/images/entities/char_2009.gif) 2, 9
2, 9![[thin space (1/6-em)]](https://www.rsc.org/images/entities/char_2009.gif) :
:![[thin space (1/6-em)]](https://www.rsc.org/images/entities/char_2009.gif) 1, and 10
1, and 10![[thin space (1/6-em)]](https://www.rsc.org/images/entities/char_2009.gif) :
:![[thin space (1/6-em)]](https://www.rsc.org/images/entities/char_2009.gif) 0) were 0.628, 0.696, 0.714 and 0.743 Pa s, respectively. Therefore, the introduction of CF could effectively decrease the viscosity of the PLA spinning solution, resulting in easy drafting, a small mean fiber diameter and concentrated fiber diameter distribution.40
0) were 0.628, 0.696, 0.714 and 0.743 Pa s, respectively. Therefore, the introduction of CF could effectively decrease the viscosity of the PLA spinning solution, resulting in easy drafting, a small mean fiber diameter and concentrated fiber diameter distribution.40
As shown in Fig. 2(a), it was found that the longitudinal surface of the PLA nanofibers was smooth, and there were hardly any nanopores when VCF![[thin space (1/6-em)]](https://www.rsc.org/images/entities/char_2009.gif) :
:![[thin space (1/6-em)]](https://www.rsc.org/images/entities/char_2009.gif) VDMF was 7
VDMF was 7![[thin space (1/6-em)]](https://www.rsc.org/images/entities/char_2009.gif) :
:![[thin space (1/6-em)]](https://www.rsc.org/images/entities/char_2009.gif) 3. With increasing CF volume content, the PLA nanofibers began to show a porous structure and large density of pore distribution. When VCF
3. With increasing CF volume content, the PLA nanofibers began to show a porous structure and large density of pore distribution. When VCF![[thin space (1/6-em)]](https://www.rsc.org/images/entities/char_2009.gif) :
:![[thin space (1/6-em)]](https://www.rsc.org/images/entities/char_2009.gif) VDMF was 8
VDMF was 8![[thin space (1/6-em)]](https://www.rsc.org/images/entities/char_2009.gif) :
:![[thin space (1/6-em)]](https://www.rsc.org/images/entities/char_2009.gif) 2, nanopores appeared on the surface of the PLA nanofibers, and were mostly elliptical, as can be seen in Fig. 2(b). When VCF
2, nanopores appeared on the surface of the PLA nanofibers, and were mostly elliptical, as can be seen in Fig. 2(b). When VCF![[thin space (1/6-em)]](https://www.rsc.org/images/entities/char_2009.gif) :
:![[thin space (1/6-em)]](https://www.rsc.org/images/entities/char_2009.gif) VDMF was 9
VDMF was 9![[thin space (1/6-em)]](https://www.rsc.org/images/entities/char_2009.gif) :
:![[thin space (1/6-em)]](https://www.rsc.org/images/entities/char_2009.gif) 1, small round pores appeared in the fibers, and when VCF
1, small round pores appeared in the fibers, and when VCF![[thin space (1/6-em)]](https://www.rsc.org/images/entities/char_2009.gif) :
:![[thin space (1/6-em)]](https://www.rsc.org/images/entities/char_2009.gif) VDMF was 10
VDMF was 10![[thin space (1/6-em)]](https://www.rsc.org/images/entities/char_2009.gif) :
:![[thin space (1/6-em)]](https://www.rsc.org/images/entities/char_2009.gif) 0, there were many connections between adjacent pores. This was because the lower boiling point of CF compared to that of DMF and simultaneous increase in CF content could lead to phase separation and breath figure due to the rapid solvent evaporation and vapor penetration and condensation.41 For the PLA electrospinning solutions composed of different organic solvents, the different volatilization rates of the organic solvents played a key role in the formation of porous fiber structures. Considering the fiber diameter distribution, porous structure and specific surface area, the VCF
0, there were many connections between adjacent pores. This was because the lower boiling point of CF compared to that of DMF and simultaneous increase in CF content could lead to phase separation and breath figure due to the rapid solvent evaporation and vapor penetration and condensation.41 For the PLA electrospinning solutions composed of different organic solvents, the different volatilization rates of the organic solvents played a key role in the formation of porous fiber structures. Considering the fiber diameter distribution, porous structure and specific surface area, the VCF![[thin space (1/6-em)]](https://www.rsc.org/images/entities/char_2009.gif) :
:![[thin space (1/6-em)]](https://www.rsc.org/images/entities/char_2009.gif) VDMF ratio of 8
VDMF ratio of 8![[thin space (1/6-em)]](https://www.rsc.org/images/entities/char_2009.gif) :
:![[thin space (1/6-em)]](https://www.rsc.org/images/entities/char_2009.gif) 2 was selected for subsequent experiments.
2 was selected for subsequent experiments.
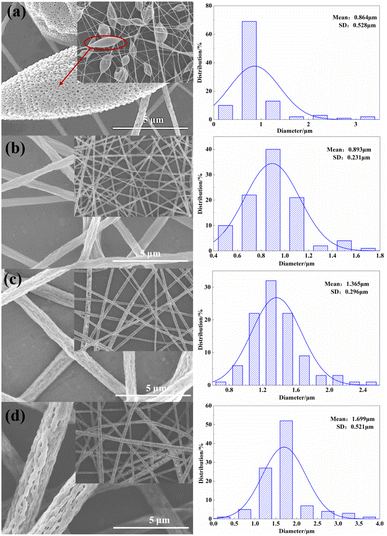
The solution concentration also played an important role in determining the size and morphology of electrospun nanofibers. The effect of the solution concentration (7, 10, 12 and 15 wt%) on the nanofiber morphology and fiber diameter were studied under the conditions of a spinning voltage of 15 kV and spinning humidity of 70 RH%, as shown in Fig. 3.
As could be seen from Fig. 3, the fiber diameter also increased with increasing PLA concentration. This might be attributed to the increase in solution viscosity and surface tension of the spinning solution, thus making the elongation and stretching of the charged PLA jet difficult and slow due to the increase in PLA concentration. When the solution concentration was 7 wt%, the mean fiber diameter was only 0.864 μm, but bead-on-string fibers were clearly observed. It was also found that many mesopores and macropores were distributed on the surface of the beads, whereas pores were hardly observed on the nanofiber surface, as shown in Fig. 3(a). The appearance of bead defects at low solution concentration could be attributed to the electric force being unable to maintain a continuous jet, thus causing the spinning solution to break into droplets before reaching the collector.41 When the solution concentration reached 10 wt%, a small number of pores appeared on the surface of the PLA nanofibers, but the depth of the pores was shallow. Moreover, the bead defects were barely visible when the PLA concentration was above 7 wt%, as shown in Fig. 3. The disappearance of bead defects could be explained as the increase in solution viscosity leading to the formation of a straight jet along with the formation of a Taylor cone at the needle tip.41,42 The surface of the PLA nanofibers exhibited an obvious porous structure when the solution concentration was 12 wt%. The pores were densely distributed and mostly elliptical, as well as deep. The increase in solution viscosity also resulted in sufficient entanglement among PLA polymer chains. Therefore, the drafting was stable in the spinning process, which was conducive to the formation of porous fibers.42 When the solution concentration reached 15 wt%, the pore distribution density began to decrease, and circular pores appeared. However, the fiber diameter and diameter vibration exhibited an obvious increase due to the higher PLA concentration along with higher viscosity. Therefore, the difficulty of electrospinning increased, as the needle tip was easily occluded. Considering the porous structure, fiber diameter and its uniformity, a solution concentration of 12 wt% was considered to be optimum value for subsequent experiments.
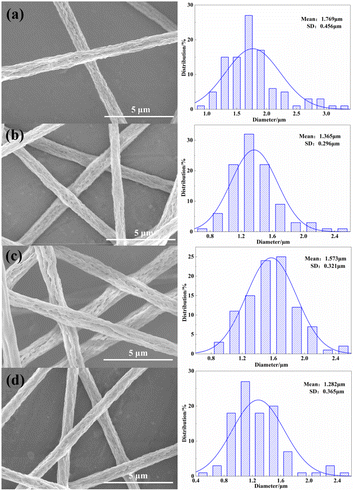
The spinning voltage is a very important process parameter in electrospinning and affects the surface morphology and diameter of the nanofibers. The effect of spinning voltage (10, 15, 20 and 25 kV) on the nanofiber morphology and diameter were studied under a spinning humidity of 70 RH%. As can be seen from Fig. 4, the mean fiber diameter exhibited a downward trend with increased spinning voltage, but the fiber diameter variation tended to increase. This was because the increase in voltage could increase the drafting force, thus making the charged jet elongation and stretching easier, resulting in finer nanofibers. However, the increase in spinning voltage could also cause the spinning velocity to be high and the jet whipping to be intense,14,31 which resulted in an increase in the fiber diameter variation. From Fig. 4, it can be clearly observed that the spinning voltage had no obvious effect on the formation of pores in the PLA nanofibers, and all the PLA nanofibers showed pores under different voltages. Considering the fiber diameter and its uniformity, a spinning voltage of 15 kV was considered to be the optimum value for subsequent experiments.
The ambient humidity also had an important influence on the formation of pores due to its effect on phase separation, breath figure, and solidification of the fluid jet.14 In the process of electrospinning, the vapor in the atmosphere can adhere to the nanofiber surface to form droplets, leading to phase separation and forming two regions rich in the polymer solute and solvent, respectively.11,14,43 With the continuous evaporation of the solvent during spinning, the region rich in the polymer solute formed a porous knot, and the solvent-rich region formed the porous structure. From Fig. 5(a), it can be seen that there were fewer pores on the surface of the PLA nanofibers at 60% RH. This was because there was too little vapor to form droplets inducing the breath figure; thus, only a few pores appeared on the surface of the nanofibers when the ambient humidity was relatively low. Furthermore, it was found that the needle tip was often occluded at 60 RH% during the manufacturing process. This could be attributed to the fact that the volatilization rate of the CF solvent might be higher than the flow rate of the spinning solution, causing rapid jet solidification and needle clogging at low ambient humidity. As can be seen in Fig. 5(b)–(d), many nanopores appeared on the surface of the nanofibers at high ambient humidity. This could be explained by the fact that the volatilization of the solvent would take away heat, causing the surface temperature of the polymer solution jet to be lower than room temperature, which could contribute to the thermally induced phase separation.14 Moreover, there was much more vapor in the air, which could easily form water droplets adhering to the jet surface at high ambient humidity. Therefore, many more pores were more likely to form on the fiber surface when the water droplets were removed from the jet during the solidification of polymer jets.14,43
As can be seen in Fig. 5, the diameter of the PLA nanofibers exhibited an increasing tendency with increasing ambient humidity, but the increase in the diameter was small. Moreover, the fiber diameter distribution of the PLA nanofibers was the most uniform at 70% RH. Furthermore, excessive ambient humidity would affect the nanofiber morphology to form the bead-on-string fibers. Therefore, an ambient humidity of 70% RH was selected for subsequent experiments. Based on the analysis of the spinning process parameters, electrospinning parameters of a VCF![[thin space (1/6-em)]](https://www.rsc.org/images/entities/char_2009.gif) :
:![[thin space (1/6-em)]](https://www.rsc.org/images/entities/char_2009.gif) VDMF of 8
VDMF of 8![[thin space (1/6-em)]](https://www.rsc.org/images/entities/char_2009.gif) :
:![[thin space (1/6-em)]](https://www.rsc.org/images/entities/char_2009.gif) 2, solution concentration of 12 wt%, spinning voltage of 15 kV and 70% RH were chosen to prepare the porous PLA nanofibers for the preparation of the filter composites.
2, solution concentration of 12 wt%, spinning voltage of 15 kV and 70% RH were chosen to prepare the porous PLA nanofibers for the preparation of the filter composites.
The nitrogen adsorption–desorption isotherms, Barrett–Joyner–Halenda (BJH) adsorption cumulative nanopore volume and Brunauer–Emmett–Teller (BET) surface area of the PLA nanofibers at different volume ratios of CF/DMF (7/3 and 8/2) were carried out to further investigate the porous structure, as shown in Fig. 6.
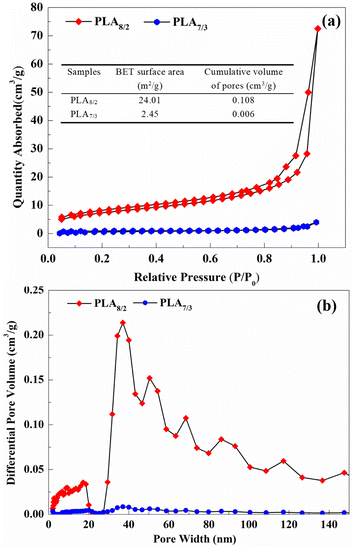 | ||
| Fig. 6 Nitrogen adsorption–desorption isotherms and BET surface area of the PLA nanofibers with different volume ratios of CF/DMF (a) and pore volume curves of corresponding PLA nanofibers (b). | ||
From previous analysis, it was found that the volume ratio of CF/DMF could affect the porous structure of the PLA nanofibers. The PLA8/2 nanofibers exhibited porous structure, whereas the PLA7/3 nanofibers were non-porous. It can be seen in Fig. 6 that the PLA8/2 nanofibers showed type-IV isotherms according to the Brunauer–DemingDeming–Teller (BDDT) classification, which indicated the presence of some mesopores (2–50 nm) and macropores (>50 nm pore width) within the nanofibers.14 Moreover, the detailed nanopore size distribution analysis of the PLA nanofibers was measured using the BJH method, as shown in Fig. 6(b), which clearly illustrates that the pore size ranged from 2 nm to 150 nm. It was found that nanofiber mats composed of the PLA7/3 nanofibers showed a low specific surface area of 2.45 m2 g−1 and cumulative pore volume of 0.006 cm3 g−1. However, the PLA8/2 nanofibers showed 9.8 times greater specific surface area (24.01 m2 g−1) and 18 times more cumulative pore volume (0.108 cm3 g−1). This result was also consistent with Wang's research.14 Furthermore, the fiber diameter of the PLA8/2 nanofibers exhibited a significant increase compared to that of the PLA7/3 nanofibers, as shown in Fig. 2. This phenomenon was significantly different from findings reported in previous studies,11,14,25 which indicated that smaller fiber diameters usually resulted in high specific surface areas. This discrepancy could mainly be explained by the much greater amount of nanopores formed on the surface of the PLA8/2 nanofibers and leading to a higher pore volume, as shown in Fig. 6(b). Therefore, the porous structure on the PLA nanofiber surface could significantly increase the specific surface area and cumulative pore volume, which exhibited a positive effect on the air filtration performance of the fibrous filter materials.
From the previous analysis, it was found that non-porous, porous and bead-on-string PLA nanofibers could be prepared by changing electrospinning process parameters. To investigate the effect of the porous nanofibers on filtration performance, three types of PLA nanofibers (PLA8/2–7% (bead-on-string), PLA8/2–12% (porous), and PLA7/3–12% (non-porous)) were selected to prepare the filtration composites through combination with the PLA spunbonded nonwovens.
3.2 Pore structure of the PLA filtration composites
The air filtration performance of the fibrous filtration composites was significantly affected by the pore size and pore size distribution. Fig. 7 shows the pore size and pore size distribution of the PLA-based fibrous filtration composites with different spinning times. It was found that the pore size of the PLA7/3–12% (non-porous) filtration composites was largely concentrated between 1 and 1.8 μm, and the mean flow pore size decreased with increasing spinning time, as shown in Fig. 7(a) and (d). For the PLA8/2–12% (porous) filtration composites, the pore size decreased from 3–3.8 μm to 1.6–2.8 μm, and the pore size distribution became sharper as the spinning time was increased. The pore size and pore size distribution of the PLA8/2–7% (bead-on-string) filtration composites also exhibited same trends. The pore size decreased from 1.5–1.8 μm to 0.8–1.3 μm with increasing spinning time.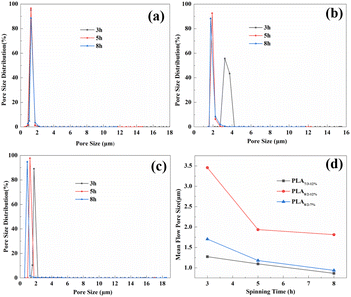 | ||
| Fig. 7 Pore size distribution of the PLA-based fibrous filtration composites: PLA7/3–12% (a), PLA8/2–12% (b), and PLA8/2–7% (c); and mean flow pore size (d) with different spinning times. | ||
The mean flow pore size of the three types of the PLA-based fibrous filtration composites all exhibited a decreasing tendency with increasing spinning time. With increasing spinning time, the number of PLA nanofibers gradually increased, and the number of layers of interlaced stacking between the PLA nanofibers also gradually increased, so that the pore size gradually decreased with the prolongation of the spinning time. Therefore, the increased deposition of the PLA nanofibers with increasing spinning time resulted in a decrease in pore size distribution and mean flow pore size. Moreover, the mean flow pore size of the PLA8/2–12% (porous) filtration composites was the highest and that of PLA7/3–12% (non-porous) filtration composites was the lowest at the same spinning time, as shown in Fig. 7(d). This phenomenon was ascribed to the decrease in the PLA nanofiber diameter. PLA8/2–12% (porous) exhibited the maximum fiber diameter of 1.365 ± 0.296 μm, while PLA7/3–12% (non-porous) exhibited the minimum fiber diameter of 0.776 ± 0.134 μm. The pore size of the nanofiber membrane was closely related to the nanofiber diameter. The smaller the fiber diameter, the tighter the fiber stack, and the smaller the formed pores.
3.3 Air filtration performance of the PLA filtration composites
The PM0.3 filtration performance of the PLA-based fibrous filtration composites was tested to measure the non-electret air filtration of the porous PLA nanofibers, as shown in Fig. 8. Table 1 also lists the parameters of the PLA-based fibrous filtration composites. It was found that the thickness and gram weight of the PLA-based fibrous filtration composites all increased with increasing spinning time, but there were some differences in the growth rate, which could be attributed to the variation of the spinning parameters. For all the PLA-based fibrous filtration composites, the air filtration efficiency of PM0.3 increased with increasing spinning time; the pressure drops also exhibited a significant increase, which was ascribed to the increase in the thickness and decrease in the mean pore size and porosity, as shown in Fig. 8. These phenomena were also consistent with findings in previous studies,6,7,14,26 which indicated that the higher filtration efficiency was usually accompanied by a high pressure drop.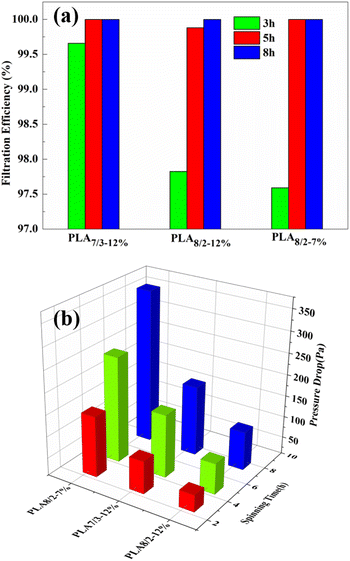 | ||
| Fig. 8 Filtration properties of the PLA-based fibrous filtration composites with different spinning times: filtration efficiency (a) and pressure drop (b). | ||
| Sample | Spinning time | Thickness (mm) | Gram weight (g m−2) | Quality factor (Pa−1) |
|---|---|---|---|---|
| PLA spunbonded nonwovens | — | 0.341 ± 0.010 | 46.3 ± 0.06 | — |
| PLA7/3–12% | 3 h | 0.476 ± 0.021 | 56.5 ± 0.18 | 0.074 |
| 5 h | 0.536 ± 0.013 | 61.9 ± 0.12 | 0.077 | |
| 8 h | 0.621 ± 0.015 | 71.1 ± 0.08 | 0.070 | |
| PLA8/2–12% | 3 h | 0.406 ± 0.024 | 53.3 ± 0.21 | 0.096 |
| 5 h | 0.470 ± 0.016 | 62.5 ± 0.23 | 0.093 | |
| 8 h | 0.561 ± 0.022 | 67.5 ± 0.17 | 0.126 | |
| PLA8/2–7% | 3 h | 0.418 ± 0.017 | 51.1 ± 0.14 | 0.026 |
| 5 h | 0.452 ± 0.021 | 60.0 ± 0.21 | 0.047 | |
| 8 h | 0.511 ± 0.014 | 68.3 ± 0.07 | 0.032 |
From Fig. 8(a), it can be seen that the filtration efficiency of PLA7/3–12% (non-porous) could reach 99.6573%, and that of PLA8/2–12% (porous) and PLA8/2–7% (bead-on-string) were 97.8246% and 97.5909%, respectively, when the spinning time was 3 h. This was mainly because of the finest fiber diameter, smallest pore size and greatest thickness of PLA7/3–12%. Significantly, the filtration efficiencies of the three samples were all higher than 95%, indicating good filtration efficiency. However, the pressure drops of the three samples showed significant differences. The pressure drops of PLA8/2–12%, PLA7/3–12%, and PLA8/2–7% were 39.85 Pa, 76.6 Pa and 142.4 Pa, respectively, as shown in Fig. 8(b). This phenomenon indicated that the porous PLA nanofibers could significantly improve the filtration efficiency with a small increase in pressure drop due to their large BET surface area, pore volume, and nanopore content on the fiber surface. When the spinning time was 8 h, the filtration efficiencies of the three samples were all over 99.99%, indicating excellent filtration performance exceeding the requirement for high efficiency particulate air (HEPA, 99.97%) filters and almost meeting the requirement for ultra-low particulate air (ULPA, over 99.999%) filters.11,13 PLA8/2–7% (358.3 Pa) showed the greatest pressure drop, and PLA7/3–12% (163.6 Pa) showed a higher pressure drop than PLA8/2–12% (90.4 Pa), as shown in Fig. 8(b).
In general, the filtration efficiency and pressure drop of fibrous filtration materials showed a trade-off relationship, indicating that a high-pressure drop was inevitable for achieving high filtration efficiency. Therefore, the filtration efficiency of the common fibrous filters usually increases with increasing solidity of the filter, which is directly proportional to the air pressure drop.13 A high pressure drop can influence the comfort of masks and cause a large energy loss in filters. Thus, ideal filters should offer the lowest pressure drop with the highest filtration efficiency. In Fig. 8, it can be seen that the PLA8/2–12% (porous) filtration composites exhibited excellent filtration efficiencies (97.8246%, 99.8806%, and 99.9989%) for the different spinning times and lowest pressure drops (39.85 Pa, 72.07 Pa, and 90.35 Pa) among the three samples. Therefore, the filtration efficiency (>99.5%) and pressure drop (<100 Pa) of the PLA8/2–12% (porous) filtration composites were well balanced compared to those in previous studies (>100 Pa)7,14,38 due to the porous structure of the PLA nanofibers. This was attributed to having the largest specific surface area, surface energy and surface tension among the three samples due to the porous structure in the PLA nanofibers (Fig. 6),13,14,38,43 which could increase the deposition, direct interception and Brownian diffusion effect of the surface of the nanofibers on airborne particulates (PM0.3) and consequently improve the filtration efficiency without increasing the pressure drop. Moreover, the appearance of the nanopores could enhance the surface roughness of the PLA nanofibers, which may increase the friction coefficient between the nanofibers and particles, benefiting particle capture. Therefore, the nanopores on the surface of the PLA nanofibers played a key role in increasing the filtration efficiency. Although the PLA7/3–12% (non-porous) and PLA8/2–7% (bead-on-string) fibrous filtration composites also showed excellent filtration efficiency (>99.9%), their large pressure drops would hinder their application in the air filtration field.
The air filtration process of the electrospun nanofibrous filter composites has usually been considered as a stable filtration stage.11 Therefore, the porous PLA nanofibers captured the particles from the airflow in this work, which could be regarded as the composite effect of interception, Brownian diffusion, inertial impaction, and electrostatic deposition according to the classical filtration theory in the stable stage.11,13,26 It should be noted that the prepared PLA filter composites in this work were treated with an electrostatic charge attenuation process. Thus, the electrostatic deposition effect was negligible for aerosol particle filtration in this work, which is significantly different from the existing PLA nanofiber filtration materials.9,11,13,26 The interception (0.1–1 μm) and inertial impaction (0.5–1 μm) mainly affect particles larger than 0.3 μm, whereas Brownian diffusion is the main filtering mechanism for particles of 0.1 μm.9,11,26
Interception and Brownian diffusion were dominant mechanisms for PM0.3 capture in this work. The micro-scale fiber diameter and nanopores on the fiber surface of the porous PLA nanofibers could significantly improve the available specific surface area, which is beneficial in terms of contact between the PLA nanofibers and particles and increased the probability of particles colliding on PLA nanofibers through Brownian motion. Moreover, the nanopores on the PLA nanofibers surface could increase the roughness of the PLA nanofibers and particle-fiber friction coefficient, which could also increase the probability of capturing particles.
QF is used as a representative criterion to directly reflect the comprehensive filtration performance, which is determined by balancing filtration efficiency and pressure drop. Table 1 lists QF values of the three samples with different spinning times. It was obvious that the PLA8/2–12% (porous) filtration composites exhibited the best comprehensive filtration performance among the three samples for all spinning times. This was attributed to the porous structure of the nanofibers inducing an increase in the specific surface area and porosity, which were beneficial for reducing the pressure drop and improving the particle trapping ability.8,31
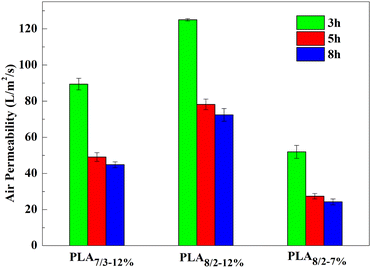
Air permeability is also an important index for air filter materials. The filter materials possessed not only excellent filtration performance but also good air permeability. Air permeability affects the respiration comfort of masks and energy consumption of the filters. The air permeability of the PLA-based fibrous filtration composites is shown in Fig. 9. It was found that the air permeability of the three samples all decreased with increasing spinning time due to the decrease in the mean pore size (Fig. 7). Moreover, the PLA8/2–12% (porous) filtration composites showed the highest air permeability among the three samples for different spinning times, as shown in Fig. 9. The air permeability PLA8/2–12% reached 125 L mm−2 s−1, which was ∼39.8% higher than that of PLA7/3–12% and ∼140.7% higher than that of PLA8/2–7% when the spinning time was 3 h. This was because the mean fiber diameter and mean pore size of the PLA8/2–12% filtration composites was much larger than that of the PLA7/3–12% and PLA8/2–7% filtration composites, inducing high porosity and air permeability.
4 Conclusions
In summary, porous PLA nanofibers were successfully prepared via electrospinning by controlling spinning condition parameters. The CF/DMF volume ratio and spinning solution concentration played a key role in determining the morphology and structure of the porous PLA nanofibers. Moreover, PLA-based fibrous filtration composites composed of PLA nanofiber mats and PLA spunbonded nonwovens were successfully manufactured using a facile strategy. The filtration performance evaluation indicated that the nanopores on the PLA nanofiber surface could significantly increase the specific surface area and roughness of the nanofibers, which resulted in the high filtration efficiency and low pressure drop of the filtration composites by increasing the interception and Brownian diffusion effect. Compared to conventional PLA nanofibers, the filtration composites based on the porous PLA nanofibers exhibited excellent filtration performance, resulting in high PM0.3 filtration efficiency (99.9989%), low air resistance (90.35 Pa), high quality factor (0.126) and high air permeability (72.4 Pa−1) at a face velocity of 32 L min−1, which was superior to the index of commercial high efficiency particulate air (HEPA) filters. Notably, the filtration composites based on the bead-on-string PLA nanofibers also exhibited excellent PM0.3 filtration efficiency, but the high air resistance and low air permeability limited their application in air filtration. This work indicates that the application of porous nanofibers in filters could avoid the performance degradation and even failure of commercial filter materials caused by environmental factors due to the electrostatic charge attenuation. The intriguing results also provide a versatile strategy to further design and develop filtration composites with high filtration performance by balancing filtration efficiency and air resistance. In this work, the preparation of the filtration composites took a long time. Therefore, the rapid mass production of porous nanofibers, which will affect their industrial application, will be the primary focus of this work in later stages.Author contributions
Conceptualization, J. X.; methodology, J. X., W. Z.; software, S. S., Z. L.; validation, J. X.; formal analysis, J. X., S. S.; investigation, S. S., W. Z.; resources, J. X.; data curation, W. Z., S. S.; writing—original draft preparation, J. X., S. S.; writing—review and editing, J. X., S. S., W. Z. and Z. X.; visualization, J. X.; supervision, J. X., S. S.; project administration, J. X.; funding acquisition, J. X. All authors have read and agreed to the published version of the manuscript.Conflicts of interest
There are no conflicts to declare.Acknowledgements
This research was supported by the National Natural Science Foundation of China (52203114), Outstanding Top Talent Cultivation Project of Anhui Province (gxgwfx2022018), State Key Laboratory of Molecular Engineering of Polymers (Fudan University) (K2024-29) and Yong and Middle-aged Top Talent Project of Anhui Polytechnic University.Notes and references
- R. E. Baker, A. S. Mahmud, I. F. Miller, M. Rajeev, F. Rasambainarivo, B. L. Rice, S. Takahashi, A. J. Tatem, C. E. Wagner, L. F. Wang, A. Wesolowski and C. J. E. Metcalf, Nat. Rev. Microbiol., 2022, 20, 193–205 CAS.
- A. Bontinck, T. Maes and G. Joos, Curr. Opin. Pulm. Med., 2020, 26, 10–19 CAS.
- A. J. Cohen, M. Brauer, R. Burnett, H. R. Anderson, J. Frostad, K. Estep, K. Balakrishnan, B. Brunekreef, L. Dandona, R. Dandona, V. Feigin, G. Freedman, B. Hubbell, A. Jobling, H. Kan, L. Knibbs, Y. Liu, R. Martin, L. Morawska, C. A. Pope III, H. Shin, K. Straif, G. Shaddick, M. Thomas, R. Dingenen, A. Donkelaar, T. Vos, C. J. L Murray and M. H. Forouzanfar, Lancet, 2017, 389, 1907–1918 Search PubMed.
- Y. Liu, H. Shao, H. Wang, Z. Ji, R. Bai, F. Chen, B. Li, C. Chang and T. Lin, Adv. Mater. Interfaces, 2022, 9, 2101848 CAS.
- D. Choi, M. Choi, H. Jeong, J. Heo, T. Kim, S. Park, Y. Jin, S. Lee and J. Hong, Chem. Eng. J., 2021, 426, 130763 CAS.
- Y. Q. Xu, X. M. Zhang, X. B. HAO, D. F. Teng, T. N. Zhao and Y. C. Zeng, Chem. Eng. J., 2021, 423, 130175 CAS.
- H. Li, Z. Wang, H. Zhang and Z. Pan, Polymers, 2018, 10, 1085 Search PubMed.
- L. Ke, T. Yang, C. Liang, X. Guan, T. Li, Y. Jiao, Da. Tang, D. Huang, S. Li, S. Zhang, X. He and H. Xu, ACS Appl. Mater. Interfaces, 2023, 15, 32463–32474 CAS.
- S. Habibia and A. Ghajarieh, Russ. J. Appl. Chem., 2022, 95, 486–498 Search PubMed.
- H. Gao, G. Liu, J. Guan, X. Wang, J. Yu and B. Ding, Chem. Eng. J., 2023, 458, 141412 CAS.
- T. Lu, J. Cui, Q. Qu, Y. Wang, J. Zhang, R. Xiong, W. Ma and C. Huang, ACS Appl. Mater. Interfaces, 2021, 13, 23293–23313 CAS.
- J. Zhang, G. Chen, G. S. Bhat, H. Azari and H. Pen, J. Appl. Polym. Sci., 2019, 137, 48309 Search PubMed.
- G. Liu, M. Xiao, X. Zhang, C. Gal, X. Chen and L. Liu, Sustain. Cities Soc., 2017, 32, 375–396 Search PubMed.
- Z. Wang and Z. Pan, Appl. Surf. Sci., 2015, 356, 1168–1179 CAS.
- D. Meng, Y. Zhang and J. Wu, AATCC J. Res., 2022, 9, 176–181 CAS.
- W. W. F. Leung, C. H. Hung and P. T. Yuen, Sep. Purif. Technol., 2010, 71, 30–37 CAS.
- M. A. Hassan, B. Y. Yeom, A. Wilkie, B. Pourdeyhimi and S. A. Khan, J. Membr. Sci., 2013, 427, 336–344 CAS.
- H. Zhang, N. Liu, Q. Zeng, J. Liu, X. Zhang, M. Ge, W. Zhang, S. Li, Y. Fu and Y. Zhang, Polymers, 2020, 12, 2341 CAS.
- Y. Pu, J. Zheng, F. Chen, Y. Long, H. Wu, Q. Li, S. Yu, X. Wang and X. Ning, Polymers, 2018, 10, 959 Search PubMed.
- S. Choi, H. Jeon, M. Jang, H. Kim, G. Shin, J. M. Koo, M. Lee, H. K. Sung, Y. Eom, H. Yang, J. Jegal, J. Park, D. X. Oh and S. Y. Hwang, Adv. Sci., 2021, 8, 2170028 Search PubMed.
- A. A. Gulyakova, M. F. Galikhanov, X. Ma, X. Zhang and P. Fang, IEEE Trans. Dielectr. Electr. Insul., 2022, 29, 840–844 CAS.
- B. Yu, Y. Cao, H. Sun and J. Han, J. Polym. Environ., 2017, 25, 510–517 CAS.
- K. S. Lee, N. Hasolli, J. R. Lee, K. D. Kim, S. D. Kim, Y. O. Park and J. Hwang, Sep. Purif. Technol., 2020, 250, 117204 CAS.
- Y. Bai, C. B. Han, C. He, G. Q. Gu, J. H. Nie, J. J. Shao, T. X. Xiao, C. R. Deng and Z. L. Wang, Adv. Funct. Mater., 2018, 28, 1706680 Search PubMed.
- Y. Cho, Y. Son, J. Ahn, H. Lim, S. Ahn, J. Lee, P. K. Bae and I.-D. Kim, ACS Nano, 2022, 16, 19451–19463 CAS.
- M. Zhu, J. Han, F. Wang, W. Shao, R. Xiong, Q. Zhang, H. Pan, Y. Yang, S. K. Samal, F. Zhang and C. Huang, Macromol. Mater. Eng., 2017, 302, 1600353 Search PubMed.
- Mi. Lin, J. Shen, B. Wang, Y. Chen, C. Zhang and H. Qi, RSC Adv., 2023, 13, 30680–30689 CAS.
- R. Thakur, D. Das and A. Das, Fibers Polym., 2014, 15, 1436–1443 CAS.
- E. Motyl and B. Lowkis, Fibres Text. East. Eur., 2006, 14, 39–42 Search PubMed.
- H. J. Chio, E. S. Park, J. U. Kim, S. H. Kim and M. H. Lee, Aerosol Sci. Technol., 2015, 49, 977–983 Search PubMed.
- X. Li, G. Zhu, M. Tang, T. Li, C. Wang, X. Song, S. Zhang, J. Zhu, X. He, M. Hakkarainen and H. Xu, ACS Appl. Mater. Interfaces, 2023, 15, 26812–26823 CAS.
- Y. Cui, Z. Jiang, C. Xu, M. Zhu, W. Lia and C. Wang, RSC Adv., 2021, 11, 19579–19586 CAS.
- M. Ma, D. Xu, J. Zhao and B. Gao, J. Hazard. Mater., 2023, 443, 130146 CAS.
- L. Huang, J. T. Arena, S. S. Manickam, X. Jiang, B. G. Willis and J. R. McCutcheon, J. Membr. Sci., 2014, 460, 241–249 CAS.
- L. Zhang, L. Li, L. Wang, J. Nie and G. Ma, Appl. Surf. Sci., 2020, 515, 145962 CAS.
- A. K. Muller, Z. K. Xu and A. Greiner, ACS Appl. Mater. Interfaces, 2021, 13, 15659–15667 Search PubMed.
- L. Jing, K. Shim, C. Y. Toe, T. Fang, C. Zhao, R. Amal, K. N. Sun, J. H. Kim and Y. H. Ng, ACS Appl. Mater. Interfaces, 2016, 8, 7030–7036 CAS.
- N. Sun, W. Shao, J. Zheng, Y. Zhang, J. Li, S. Liu, K. Wang, J. Niu, B. Li, Y. Gao, F. Liu, H. Jiang and J. He, J. Appl. Polym. Sci., 2022, 139, e53186 CAS.
- Q. Cao, X. Meng, S. Tan, Z. Xin, L. S. Turng, J. Li, Z. Yao, Z. Zhai and R. Duan, J. Polym. Res., 2020, 27, 5 CAS.
- Z. H. Qi, H. Yu, Y. Zhang and Y. M. Chen, Synth. Fiber China, 2009, 38, 40–44 CAS.
- D. Sharma and B. K. Satapathy, J. Ind. Text., 2022, 51, 6640–6665 Search PubMed.
- Y. Chen, X. S. Shi, C. Xu, Y. Gao and T. Li, Eng. Plast. Appl., 2021, 49, 67–73 CAS.
- F. Yalcinkaya, J. Eng. Fibers Fabr., 2019, 14, 1–12 Search PubMed.
| This journal is © The Royal Society of Chemistry 2024 |

