
 Open Access Article
 This Open Access Article is licensed under a Creative Commons Attribution-Non Commercial 3.0 Unported Licence
Photolysis of tolfenamic acid in aqueous and organic solvents: a kinetic study†
Sadia Hafeez Kazia,
Muhammad Ali Sheraz a,
Zubair Anwar*b,
Syed Ghulam Musharrafc,
Sofia Ahmeda,
Raheela Banod,
Tania Mirzab,
Kyuyoung Heoe and
Jun-Hee Naf
a,
Zubair Anwar*b,
Syed Ghulam Musharrafc,
Sofia Ahmeda,
Raheela Banod,
Tania Mirzab,
Kyuyoung Heoe and
Jun-Hee Naf
aDepartment of Pharmaceutics, Baqai Institute of Pharmaceutical Sciences, Baqai Medical University, Karachi–75340, Pakistan
bDepartment of Pharmaceutical Chemistry, Baqai Institute of Pharmaceutical Sciences, Baqai Medical University, Karachi–75340, Pakistan. E-mail: zubair_ana@hotmail.com; zubair_ana@baqai.edu.pk
cThird World Center for Science and Technology, H.E.J. Research Institute of Chemistry, University of Karachi, Karachi–75270, Pakistan
dDow College of Pharmacy, Dow University of Health Sciences (Ojha Campus), Karachi, Pakistan
eReliability Assessment Center, Korea Research Institute of Chemical Technology, Daejeon 34114, Republic of Korea
fDepartment of Convergence System Engineering, Chungnam National University, Daejeon 34134, Republic of Korea
First published on 8th July 2024
Abstract
Tolfenamic acid (TA) is a non-steroidal anti-inflammatory drug that was studied for its photodegradation in aqueous (pH 2.0–12.0) and organic solvents (acetonitrile, methanol, ethanol, 1-propanol, 1-butanol). TA follows first-order kinetics for its photodegradation, and the apparent first-order rate constants (kobs) are in the range of 0.65 (pH 12.0) to 6.94 × 10⁻² (pH 3.0) min−1 in aqueous solution and 3.28 (1-butanol) to 7.69 × 10⁻⁴ (acetonitrile) min−1 in organic solvents. The rate-pH profile for TA photodegradation is an inverted V (∧) or V-top shape, indicating that the cationic form is more susceptible to acid hydrolysis than the anionic form of TA, which is less susceptible to alkaline hydrolysis. The fluorescence behavior of TA also exhibits a V-top-shaped curve, indicating maximum fluorescence intensity at pH 3.0. TA is highly stable at a pH range of 5.0–7.0, making it suitable for formulation development. In organic solvents, the photodegradation rate of TA increases with the solvent's dielectric constant and solvent acceptor number, indicating solute–solvent interactions. The values of kobs decreased with increased viscosity of the solvents due to diffusion-controlled processes. The correlation between kobs versus ionization potential and solvent density has also been established. A total of 17 photoproducts have been identified through LC-MS, of which nine have been reported for the first time. It has been confirmed through electron spin resonance (ESR) spectrometry that the excited singlet state of TA is converted into an excited triplet state through intersystem crossing, which results in an increased rate of photodegradation in acetonitrile.
Introduction
Tolfenamic acid (TA) belongs to the fenamate family of non-steroidal anti-inflammatory drugs (NSAIDs). It is used to treat various pain-related ailments in humans and animals.1,2 Recently, its anti-Alzheimer effect3–8 and anticancer activity against various cancers have also been identified and reported by many workers,9–26 which have significantly increased its clinical importance.TA (2-[(3-chloro-2-methylphenyl)amino]benzoic acid) is structurally similar to aminobenzoic acids and contains an amine group that is attached to the two benzoic acid rings (Fig. 1). TA is insoluble in water but soluble in dilute solutions of alkali hydroxides and most organic solvents.1,27,28 It is a photosensitive drug known to degrade on exposure to UV/sunlight.28–31 The most apparent result of photodegradation is the loss of the potency of the active drug and the formation of unwanted inactive products that may be toxic or harmful to the patients.32 The literature lacks information regarding the photodegradation kinetics of TA in aqueous and organic solvents. No comprehensive investigations have been made for the photodegradation kinetics and the photoproducts formed thereafter. A couple of TA photodegradation studies performed earlier are related to the environmental effects of water pollution and toxicity.29,30
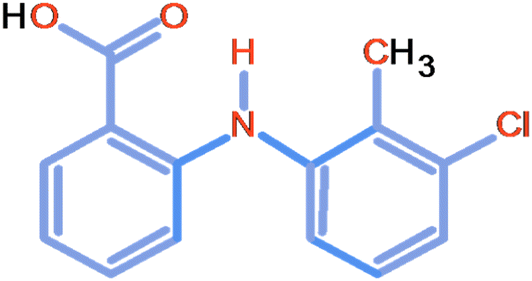 | ||
| Fig. 1 Chemical structure of TA. | ||
Since the literature lacks such information on TA, studying its photodegradation kinetics in aqueous and different protic and aprotic organic solvents could benefit pharmaceutical scientists, especially when its therapeutic uses have been repurposed. The information generated from the photostability studies would not only help to improve the medicinal stability of TA but would also help evaluate the handling and packaging aspects, therapeutic and adverse effects, and develop new drug delivery systems.32 The present study has been carried out in aqueous media (pH 2.0–12.0) and some organic solvents (acetonitrile, methanol, ethanol, 1-propanol, 1-butanol) in which TA has been photodegraded by artificial UV light, and the reaction kinetics have been determined. The photoproducts have been identified, and a correlation has been established between the reaction rate, pH, and various physicochemical parameters of the solvents.
Experimental section
Materials
TA was obtained from Sigma Aldrich (St. Loius, MO, USA). Solvents and reagents used were of analytical grade purchased from BDH (Germany)/Merck (Germany)/DaeJung (Korea). The buffer systems used for the photolysis of TA were: KCl–HCl (pH 2.0), citric acid–Na2HPO4 (pH 3.0–8.0), H3BO3–KCl–NaOH (pH 9.0–10.0), and Na2HPO4–NaOH (pH 11.0–12.0). The ionic strength in each case was 0.02 M.Methods
![[thin space (1/6-em)]](https://www.rsc.org/images/entities/char_2009.gif) :3 (v/v) ratio and diluted up to 10 mL of the same mixture. A 10 μL aliquot of the prepared solution was applied on precoated silica gel GF254 plates of 250 μm thickness (Merck, Germany). The TLC tank was equipped with a mobile phase containing a mixture of glacial acetic acid, dioxane, and toluene in a ratio of 1:25:90 (v/v). A stand-up time of 10 min was provided for saturation. The plate was then placed in the TLC tank to run in a mobile phase at 25 ± 2 °C. The plate was allowed to air dry, and the spot was observed under the UV lamp (Uvitech, Cambridge, UK) at 254 and 365 nm. Similarly, the results were reconfirmed by employing another method of TLC using hexane, chloroform, acetone, and glacial acetic acid in a ratio of 75:25:20:0.1 (v/v/v/v) as mobile phase at 25 ± 2 °C.33 All protocols were followed in a similar pattern as described above.
:3 (v/v) ratio and diluted up to 10 mL of the same mixture. A 10 μL aliquot of the prepared solution was applied on precoated silica gel GF254 plates of 250 μm thickness (Merck, Germany). The TLC tank was equipped with a mobile phase containing a mixture of glacial acetic acid, dioxane, and toluene in a ratio of 1:25:90 (v/v). A stand-up time of 10 min was provided for saturation. The plate was then placed in the TLC tank to run in a mobile phase at 25 ± 2 °C. The plate was allowed to air dry, and the spot was observed under the UV lamp (Uvitech, Cambridge, UK) at 254 and 365 nm. Similarly, the results were reconfirmed by employing another method of TLC using hexane, chloroform, acetone, and glacial acetic acid in a ratio of 75:25:20:0.1 (v/v/v/v) as mobile phase at 25 ± 2 °C.33 All protocols were followed in a similar pattern as described above.The purity of TA was ascertained using electron ionization (EI) mass spectra in positive ionization mode (RT 1.5) using a heated probe (JEOL MS 600H-1, USA). The identification of the degradation products was made by analyzing the samples on UHPLC (Dionex Ultimate 3000, ThermoFisher, Germany) coupled with an Ultra High-Resolution QTOF mass spectrometer (Maxis II, Bruker Daltonics, Bremen, Germany) equipped with an electrospray ion source. The MS system was calibrated using an internal calibrant (sodium formate solution 0.01 M) injected at 3 μL min−1 using a syringe pump before each injection to ensure high mass accuracy. The separation was carried on an RP-18 column (100 × 3.0 mm, 1.8 μm, Macherey-Nagel, Düren, Germany). The column was maintained at 40 °C, and the injection volume was 10 μL. The flow rate of the mobile phase was 0.40 mL min−1, solvent A was 0.1% formic acid, and B was methanol with 0.1% formic acid. All the samples were analyzed in positive ion mode. The parameters were set as follows:
The drying gas temperature was 270 °C, the flow of drying gas was set at 12.0 L min−1, the capillary voltage of 4500 V, the mass range of 100–1200 m/z, the nebulizer pressure was set at 3.1 bar, the spectral rate was 2.00 Hz.
The same ion source conditions were also used for MS/MS mode. Data were recorded using Bruker Hystar software version 4.1 and calibrated using Data Analysis 4.4 (Bruker, Germany). Auto MS/MS analysis was done on pooled samples. The top 3 peaks were selected for MS/MS analysis with the active exclusion for 30 s.
The potential metabolite features were extracted, aligned, and intensity normalized on internal standard with data log2-transformed using Metaboscape 3.0 (Bruker, Germany). Metaboscape software was used for feature extraction using the following parameters: Intensity threshold 900 counts, minimum peak length 9 spectra, minimum peak length (recursive) 7 spectra, and minimum feature for extraction were 1/3 of all analyzed samples, including QCs. Features found less than 80% of samples were filtered. Every feature represents a specific m/z value of [M + H]+ ion and possible sodium adducts, retention time, and peak height. For identification and molecular formula generation, exact masses of parent ions were matched with <5 ppm error and sigma value <50 in most cases. MS/MS spectra of significantly different features were searched in NIST 14 Tandem Mass Spectral Library and Mass Bank of Europe.
Aqueous solution. TA powder was solubilized in a few mL of ethanol, and its solutions (5.00 × 10⁻⁵ M) were prepared in the pH range of 2.0–12.0 using appropriate buffer systems. TA solutions were irradiated in the light chamber (Fig. S1†) with continuous stirring over the magnetic stirrer for constant light diffusion through the reaction vessels. Samples were withdrawn at regular intervals (0 to 180 min) and were subjected to the chromatographic assay.
Organic solvent. A stock solution of TA equivalent to 2.0 × 10⁻⁴ and 4.0 × 10⁻⁴ M was prepared separately in five different organic solvents, i.e., methanol, ethanol, propanol, butanol, and acetonitrile. Each solution was transferred into the Pyrex reaction vessel and irradiated to UV light with constant stirring in the photolytic chamber. The drug was irradiated in each solvent for 96 h (4 days). The reaction vessels were marked for the solvent level, and the fresh solvent was added in case of any evaporation. The samples from the solution were withdrawn at different time intervals of 0, 6, 24, 30, 48, 54, 72, 78, and 96 h, and an appropriate dilution of 24 μg/10 mL was made in the mobile phase for the HPLC analysis. Each time, the dilution was filtered through a nylon membrane before the analysis. All experiments were performed in triplicate. Each blank solvent was also exposed to the UV light, as described above. Similarly, a set of drug samples in each solvent was stored in the dark in a tightly closed container to avoid evaporation.
| A = K × Ed |
where λ1, λ2, λ3, λ4, and λ5 are the wavelengths at 254, 313, 366, 405 and 436 nm, respectively.
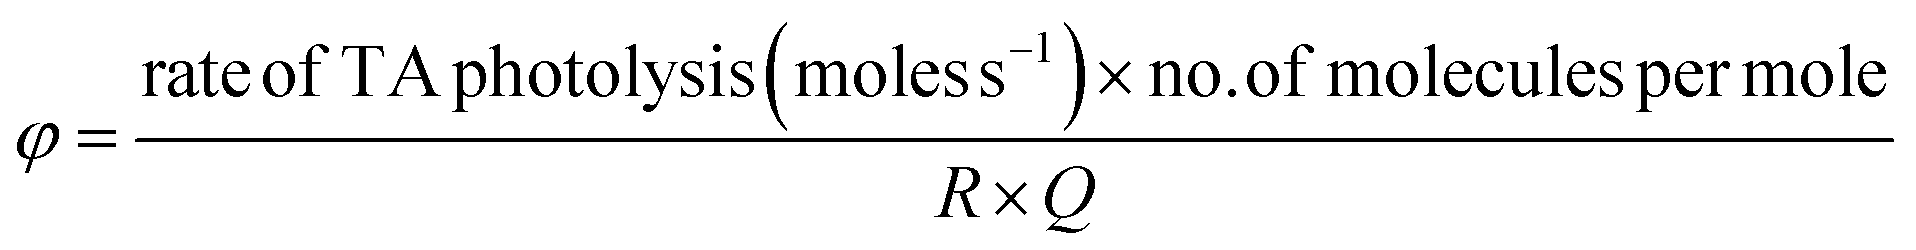
The following relation was used to estimate the quantum efficiency (Φ) of TA:
| The rate of photolysis = K s−1 (initial concentration) = moles s−1 |
Result and discussion
Purity confirmation
The characteristic stretching vibration of the amino group was detected in the region 3342–3340 cm−1, while other characteristic peaks of the spectra were observed in the fingerprint region of 1661, 1582, 1500, 1440–1400, 1267, and 749 cm−1 for carbonyl, benzene ring, an amino group (bending vibration), a methyl group (symmetric stretching), C–H, and C–N deformation, respectively. All these peaks are in accordance with those reported in the literature for TA.1,39–43
The NMR spectrum of TA showed the following peaks: δ 7.97 (1H, dd, J = 8 Hz, 1.5 Hz, H-3), δ 6.72 (1H, t, J = 8 Hz, 1 Hz, H-4), δ 6.80 (1H, br d, J = 8 Hz, H-5), δ 7.26 (1H, dd, J = 7.5 Hz, 1.5 Hz, H-6), δ 7.14–7.31 (3H, m, H-4′, 5′, 6′), δ 2.295 (1H, s, CH3). Similarly, the frequencies and intensities obtained for the sample in its 1H NMR spectrum (Fig. S5†) are also found to be similar, thus confirming that the sample used was pure and potent.1
The purity of the active drug was ascertained before being subjected to photodegradation reactions. The purity of TA is confirmed by TLC (Fig. S2†), FTIR (Fig. S3†), MS (Fig. S4†), and NMR (Fig. S5†). Hence, before proceeding to the photodegradation reactions, it has been ensured that the drug is pure and that no prior degradation product(s) or additional impurities are present.
| pH | kobs × 102 ± SD (min−1) | R2 | t50 (min) | t90 (min) | ϕ |
|---|---|---|---|---|---|
| a ϕ = quantum yields of photolysis. | |||||
| 2.0 | 4.50 ± 0.22 | 0.9987 | 2.33 | 15.4 | 1.60 |
| 3.0 | 6.94 ± 0.34 | 0.9979 | 1.51 | 9.99 | 2.45 |
| 4.0 | 4.21 ± 0.51 | 0.9990 | 2.49 | 16.5 | 1.49 |
| 5.0 | 2.65 ± 0.19 | 0.9987 | 3.96 | 26.1 | 0.99 |
| 6.0 | 1.51 ± 0.29 | 0.9974 | 6.95 | 45.9 | 0.53 |
| 7.0 | 1.11 ± 0.44 | 0.9984 | 9.46 | 62.4 | 0.39 |
| 8.0 | 1.01 ± 0.18 | 0.9987 | 10.4 | 68.6 | 0.35 |
| 9.0 | 0.95 ± 0.55 | 0.9996 | 11.0 | 72.9 | 0.33 |
| 10.0 | 0.82 ± 0.36 | 0.9988 | 12.8 | 84.5 | 0.29 |
| 11.0 | 0.72 ± 0.69 | 0.9986 | 14.6 | 96.2 | 0.25 |
| 12.0 | 0.65 ± 0.58 | 0.9995 | 16.1 | 106.6 | 0.23 |
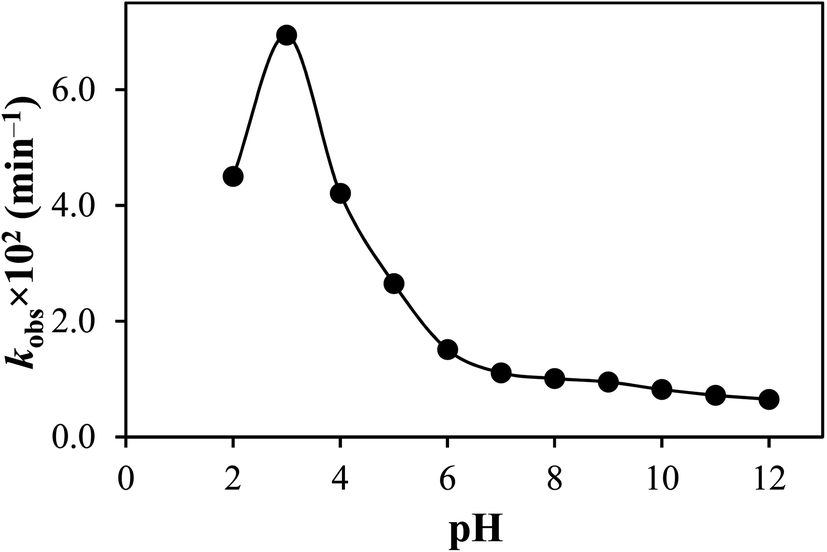 | ||
| Fig. 2 The kobs–pH profile for photolysis of TA in aqueous solution. | ||
TA shows a fluorescence emission band at 452 nm on excitation at 370 nm.43 The correlation between fluorescence and the rate of photodegradation has been made by plotting the fluorescence intensity (A.U.) and the rate of photodegradation (kobs) of TA versus pH (Fig. 3). It has been found that the fluorescence intensity (A.U.) versus pH is superimposed on the rate–pH profile. It indicates the maximum availability of the singlet excited state of TA at pH 3.0 and the minimum at pH range 7.0–12.0. Therefore, the photodegradation rate is higher at pH 3.0 than at pH 7.0–12.0, indicating the maximum formation of an excited triplet state at pH 3.0, resulting in the photodegradation of TA molecules. It has previously been reported that at higher pH values, the fluorescence of molecules is quenched and vice versa.56,57
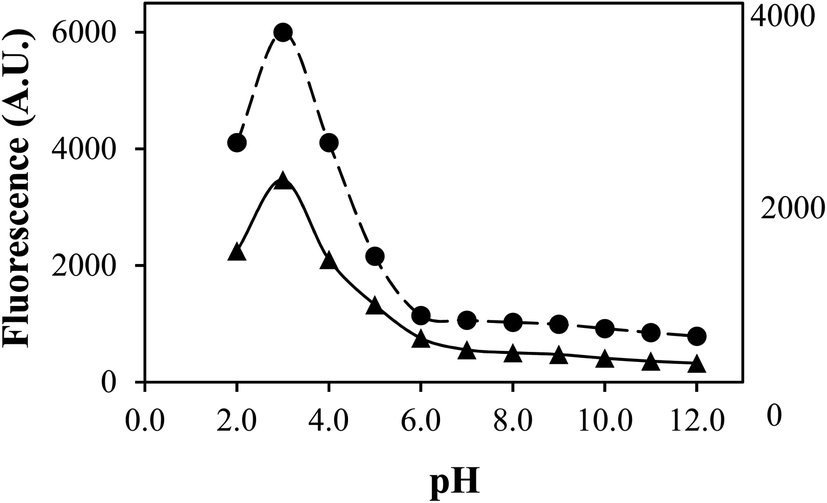 | ||
| Fig. 3 kobs–pH profile (▲) for the photolysis of TA at pH 2.0–12.0, along with fluorescence intensity versus pH curve (●). The values of kobs have been increased to 500 folds to match the fluorescence curve. | ||
A curve pattern has been noted for TA molar concentration when plotted against the time in all solvents (Fig. S8†). Such a curve pattern indicates that the degradation does not follow zero-order kinetics. The log concentration of TA is determined from the molar recoveries, and first-order graphs have been plotted versus time (Fig. S9†). The plots indicated that the photolysis of TA in various organic solvents follows apparent first-order kinetics as a linear pattern against time has been observed (Fig. S9†). Such reactions indicate that the degradation products are formed from a constant fraction of the drug at a defined time following an unimolecular reaction.45,58,64 The apparent first-order rate constants (kobs) for the photodegradation of TA have been calculated from the slopes of the first-order plots by the following equation and are reported in Table 2.
| Solvent | Dielectric constant | Acceptor number | Viscosity (mPa s) | Ionization potential (eV) | Density (g mL−1) | Concentration (M × 104) | kobs × 104 ± SD (min−1) | R2 | t50 (h) | t90 (h) | Φ |
|---|---|---|---|---|---|---|---|---|---|---|---|
| a Φ quantum yields of photolysis. | |||||||||||
| Acetonitrile | 38.5 | 18.9 | 0.369 | 12.20 | 0.777 | 2.00 | 7.69 ± 0.90 | 0.991 | 15.01 | 2.27 | 0.11 |
| 4.00 | 6.28 ± 1.50 | 0.986 | 18.38 | 2.79 | 0.18 | ||||||
| Methanol | 32.6 | 41.3 | 0.544 | 10.84 | 0.787 | 2.00 | 6.48 ± 1.20 | 0.996 | 17.83 | 2.70 | 0.09 |
| 4.00 | 5.54 ± 1.05 | 0.990 | 20.85 | 3.16 | 0.16 | ||||||
| Ethanol | 24.3 | 37.1 | 1.074 | 10.47 | 0.785 | 2.00 | 5.85 ± 1.35 | 0.994 | 19.73 | 2.99 | 0.08 |
| 4.00 | 4.74 ± 1.25 | 0.995 | 24.37 | 3.69 | 0.13 | ||||||
| 1-Propanol | 20.1 | 37.3 | 1.945 | 10.15 | 0.800 | 2.00 | 4.67 ± 0.75 | 0.990 | 24.73 | 3.75 | 0.07 |
| 4.00 | 4.12 ± 0.88 | 0.987 | 28.05 | 4.25 | 0.12 | ||||||
| 1-Butanol | 17.8 | 36.8 | 2.544 | 10.04 | 0.806 | 2.00 | 4.13 ± 0.80 | 0.986 | 27.97 | 4.24 | 0.06 |
| 4.00 | 3.28 ± 1.10 | 0.984 | 35.26 | 5.34 | 0.09 | ||||||
Similarly, the kobs values for the photolysis of TA in each solvent calculated from the first-order plots (Fig. S9†) are also found to be lesser, i.e., 3.28 to 6.28 × 10⁴ min−1, with regression values of 0.984–0.995. The results indicated that 50% of the drug degradation (t50) in double-strength solutions occurred in about 18–35 h (Table 2) compared to 15–28 h of original solutions (Table 2). The faster degradation rate of the solutions containing lower TA concentrations under similar photolysis conditions could be due to the availability of more photons for the excitation of the TA molecule than the higher concentrations.
| Acetonitrile > methanol > ethanol > propanol > butanol |
Various physicochemical properties of the selected solvents (Table 2) have been correlated with the degradation rates to ascertain the multiple factors influencing the photodegradation of TA, which are discussed in the following sections.
 | ||
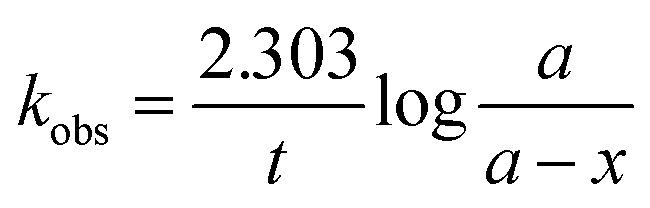
| Fig. 4 A plot of kobs of TA versus dielectric constant of the solvents. (*, ×) Acetonitrile, (●, ○) methanol, (▲, Δ) ethanol, (■, □) propanol, and (♦, ◊) butanol. (––––) 2.0 × 10⁴ M; (– – – –) 4.0 × 10⁴ M. | ||
The results indicated that the photodegradation of TA increased linearly with an increase in the dielectric constants of the solvents (Fig. 4). The increase in the degradation rate of TA with an increase in the solvent dielectric constant indicates that the reaction involves polar or similar charged degradation species; therefore, the rate has been accelerated in solvents having high ε values (Table 2). This pattern of enhanced degradation of TA with increasing dielectric constants is known to occur when identical charged species are involved in the reaction. On the contrary, the decrease in the degradation rate with an increase in dielectric constant often occurs when the reaction occurs between ions of opposite charges.82–84
A linear pattern was noted in the thermal degradation studies of TA when the dielectric constant was increased in the ethanol–water mixtures by increasing the amount of water.75 A similar effect has also been observed previously in drugs like riboflavin,58 fluoroquinolones,66–68 and 5-fluorouracil.81 Based on these findings, it is suggested that using a combination of appropriate solvents for TA may result in comparatively better stability.
 | ||
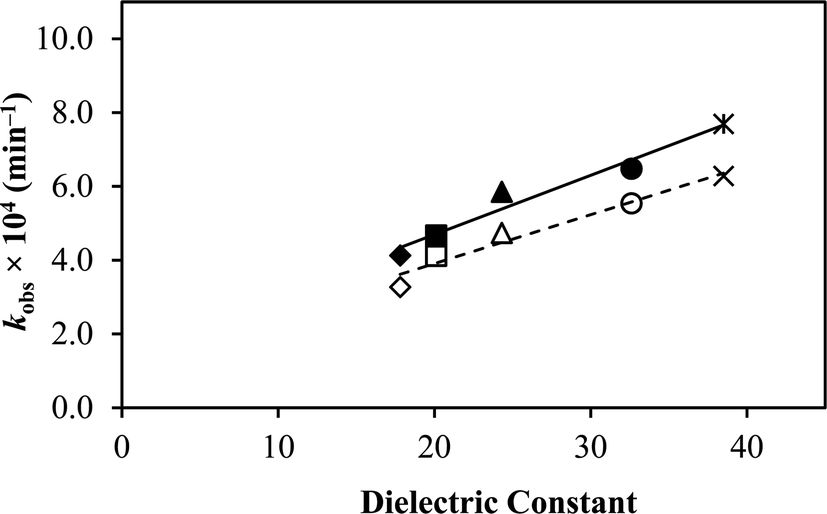
| Fig. 5 A plot of kobs of TA versus acceptor number of protic solvents (alcohols). (●, ○), Methanol, (▲, Δ) ethanol, (■, □) propanol, and (♦, ◊) butanol. (––––) 2.0 × 10⁴ M; (– – – –) 4.0 × 10⁴ M. | ||
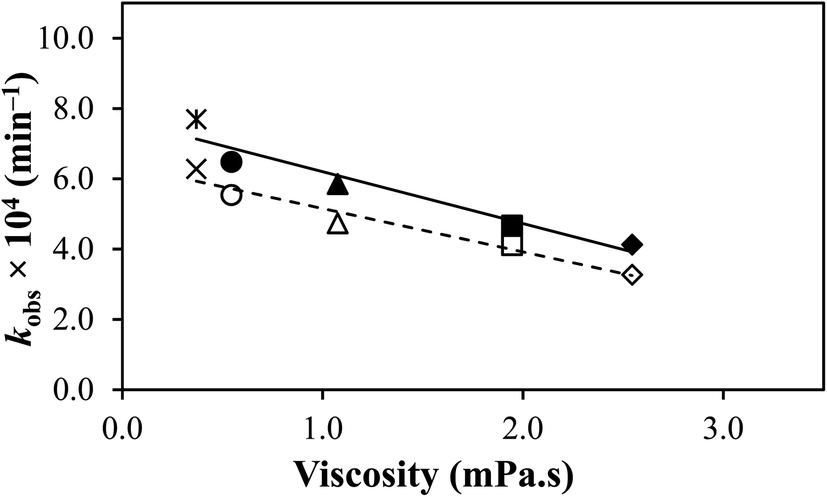 | ||
| Fig. 6 A plot of kobs of TA versus viscosity of the solvents. (*, ×) Acetonitrile, (●, ○) methanol, (▲, Δ) ethanol, (■, □) propanol, and (♦, ◊) butanol. (––––) 2.0 × 10⁴ M; (– – – –) 4.0 × 10⁴ M. | ||
A correlation between the effect of solvent viscosity on the rates and mechanism of chemical reactions with certain drugs has been reported.35,58,61,78,81,86–88 A similar viscosity effect was observed when the photodegradation of fenamates was found to lower with an increase in medium viscosity.89,90 The temperature of the medium plays a vital role in the viscosity effect on the reaction rate.84 The opposite result has been observed in the case of the thermal degradation of TA in ethanol–water mixtures. It was observed that the increase in the viscosity of the medium resulted in increased degradation of TA due to a rise in the temperature.75
A correlation has been made between the rate constants of TA (Table 2) and the solvents' ionization potential (Table 2). TA and the solvents used in this study possess hydrogen donor and acceptor properties, except for acetonitrile, which only has acceptor ability due to its aprotic nature.93 Interestingly, a relatively linear relationship (Fig. 7) has been found between the two factors, indicating that the higher the ionization potential of the solvent, the more the degradation of TA, probably due to higher dipole moments and Gibbs energy, as also observed by Faiz et al.94 in a different study.
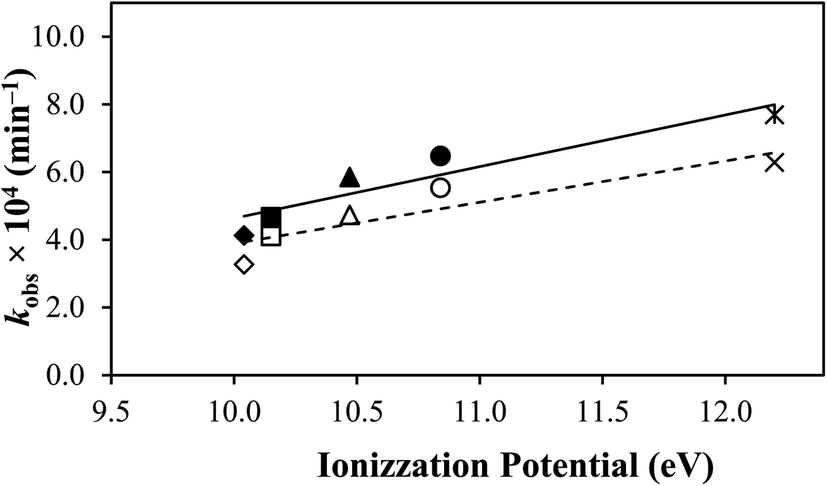 | ||
| Fig. 7 A plot of kobs of TA versus ionization potential of the solvents. (*, ×) Acetonitrile, (●, ○) methanol, (▲, Δ) ethanol, (■, □) propanol, and (♦, ◊) butanol. (––––) 2.0 × 10⁴ M; (– – – –) 4.0 × 10⁴ M. | ||
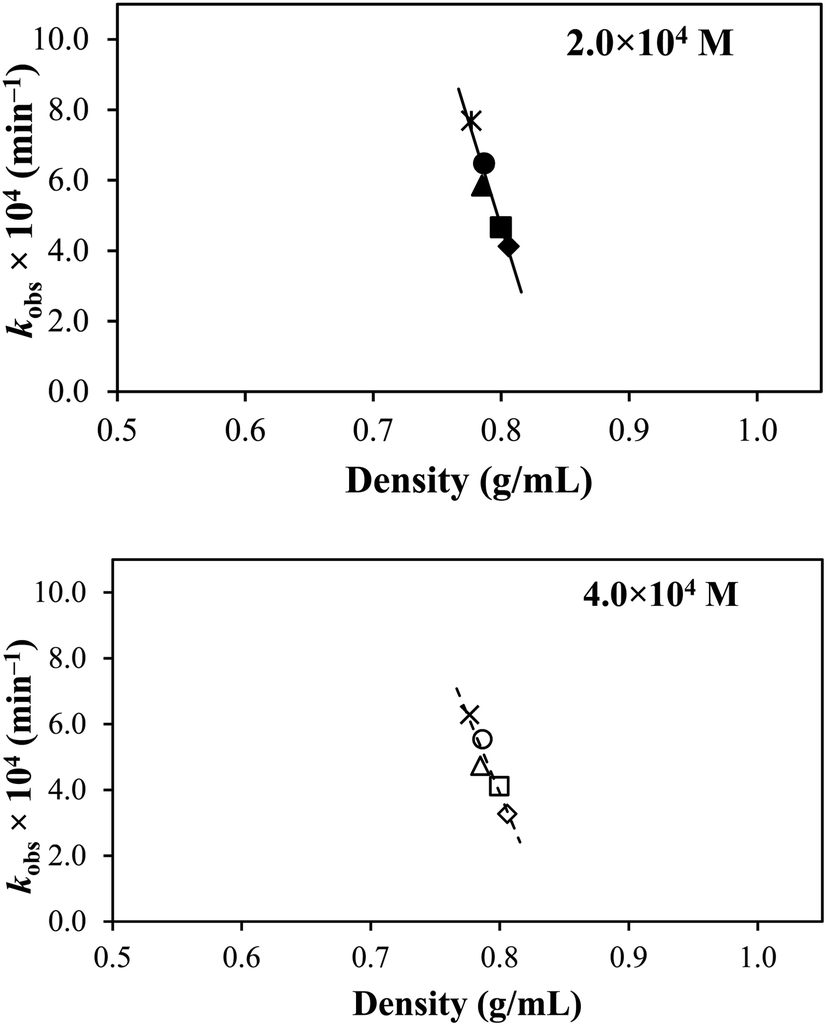 | ||
| Fig. 8 A plot of kobs of TA versus density of the solvents. (*, ×) Acetonitrile, (●, ○) methanol, (▲, Δ) ethanol, (■, □) propanol, and (♦, ◊) butanol. | ||
| Compound | Accurate mass | RT | Molecular formula | Proposed structure | ACN | MeOH | EtOH | PrOH | BuOH |
|---|---|---|---|---|---|---|---|---|---|
| a ACN = acetonitrile; MeOH = methanol; EtOH = ethanol; PrOH = 1-propanol; BuOH = 1-butanol.b The positive sign (+) indicates the presence of the photoproduct in the solvent. | |||||||||
| TP-I | 141.0345 | 7.0 | C7H8Cl1N1 | 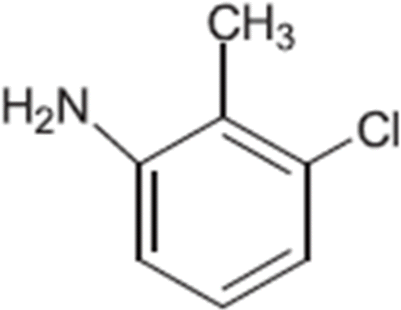 |
+ | + | + | + | + |
| TP-II | 157.0294 | 6.4 | C7H8Cl1N1O1 | 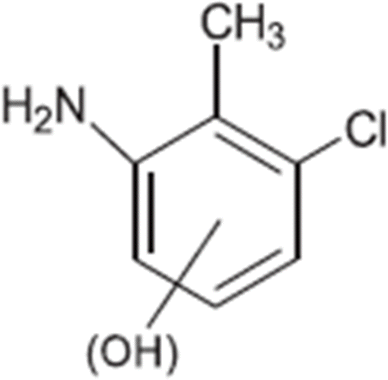 |
+ | + | |||
| TP-III | 170.0215 | 5.5 | C7H6O5 | 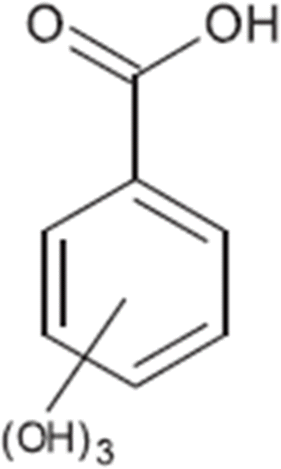 |
+ | + | |||
| TP-IV | 224.0532 | 0.9 | C7H12O8 |  |
+ | ||||
| TP-V | 243.0895 | 0.7 | C14H13N1O3 | 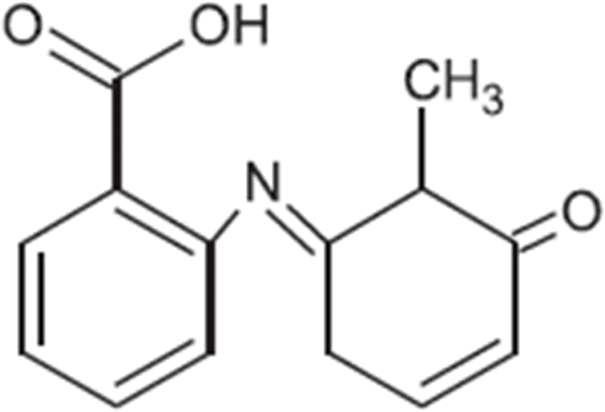 |
+ | ||||
| TP-VI | 277.0505 | 7.8 | C14H12Cl1N1O3 |  |
+ | + | |||
| TP-VII | 295.1055 | 8.0 | C14H17N1O6 |  |
+ | + | |||
| TP-VIII | 307.0247 | 7.6 | C14H10Cl1N1O5 |  |
+ | ||||
| TA | 261.0556 | 9.9 | C14H12Cl1N1O2 |  |
+ | + | + | + | + |
| TP-IX | 326.3059 | 10.9 | C20H39NO2 | 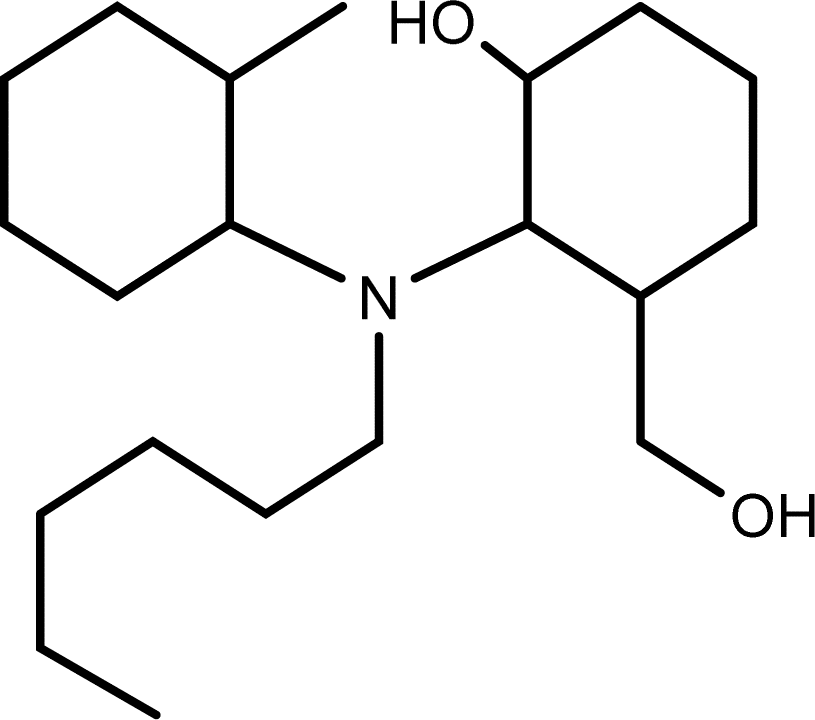 |
+ | + | + | ||
| TP-X | 347.2824 | 10.9 | C22H37NO2 | 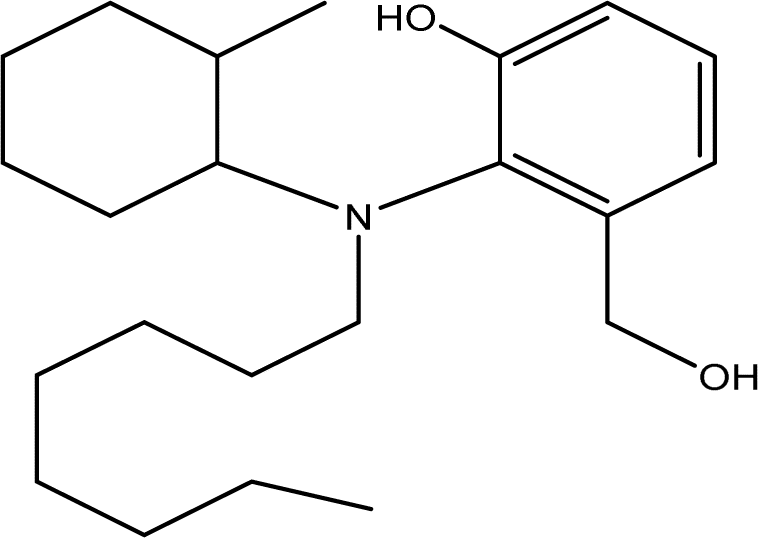 |
+ | + | + | ||
| TP-XI | 362.2780 | 10.9 | C18H38N2O5 | 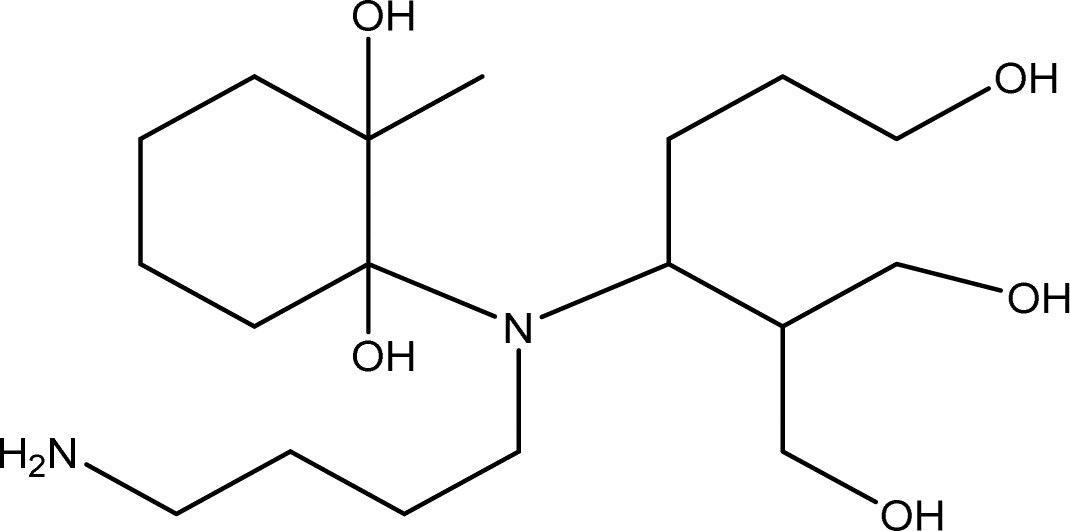 |
+ | + | + | ||
| TP-XII | 352.2613 | 10.7 | C21H36O4 | 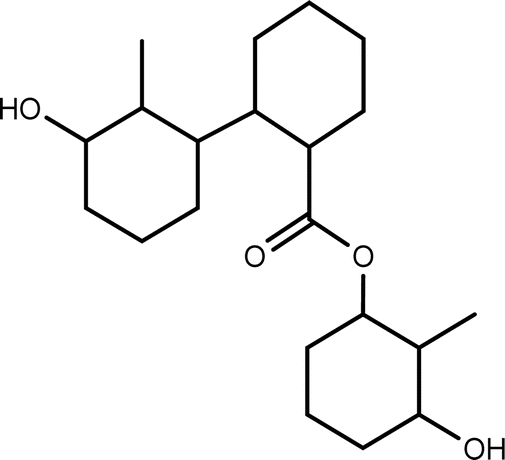 |
+ | + | + | + | + |
| TP-XIII | 320.2311 | 10.2 | C15H32N2O5 | 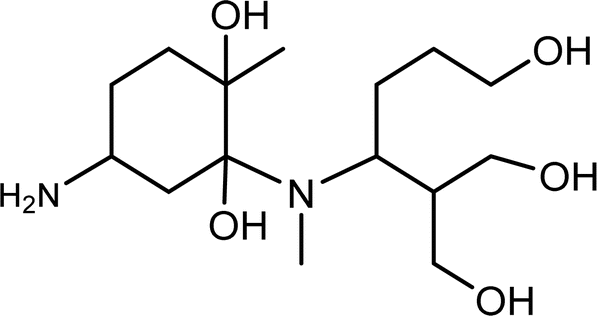 |
+ | + | + | + | + |
| TP-XIV | 242.1518 | 6.8 | C13H22O4 | 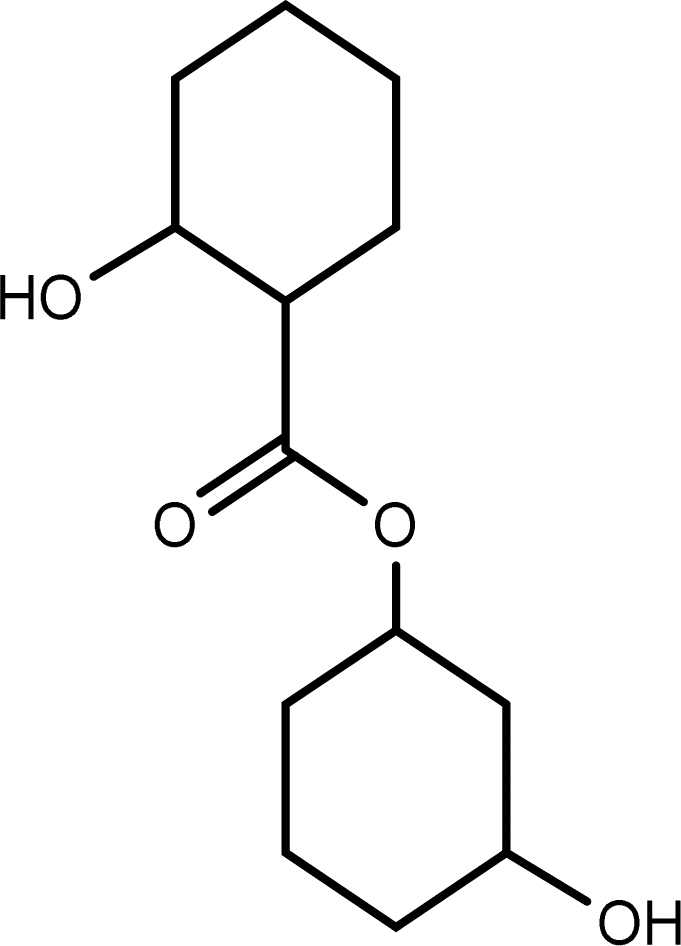 |
+ | + | + | ||
| TP-XV | 210.0892 | 7.3 | C11H14O4 | 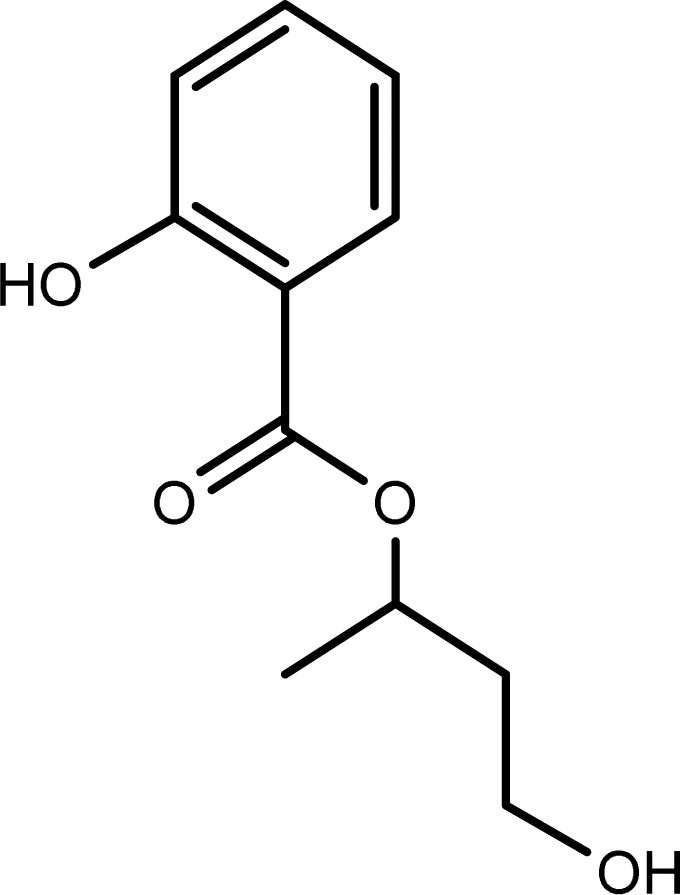 |
+ | + | + | + | |
| TP-XVI | 213.0789 | 8.1 | C13H11N1O2 | 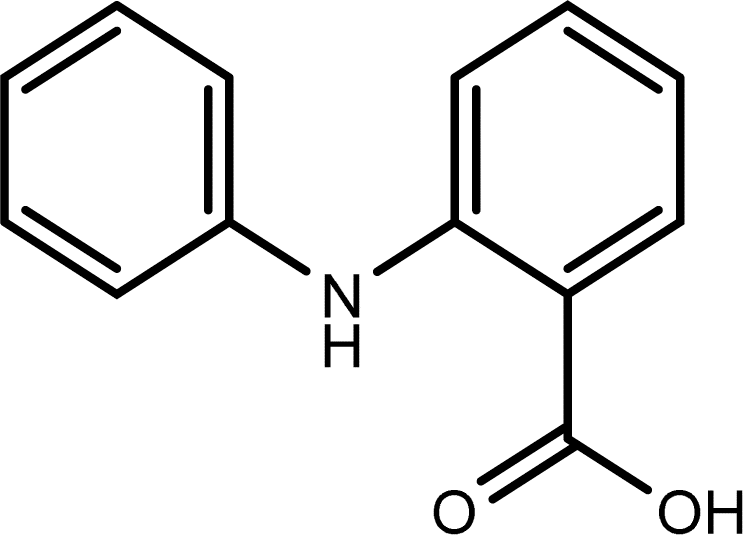 |
+ | + | + | + | + |
| TP-XVII | 240.1725 | 9.5 | C14H24O3 | 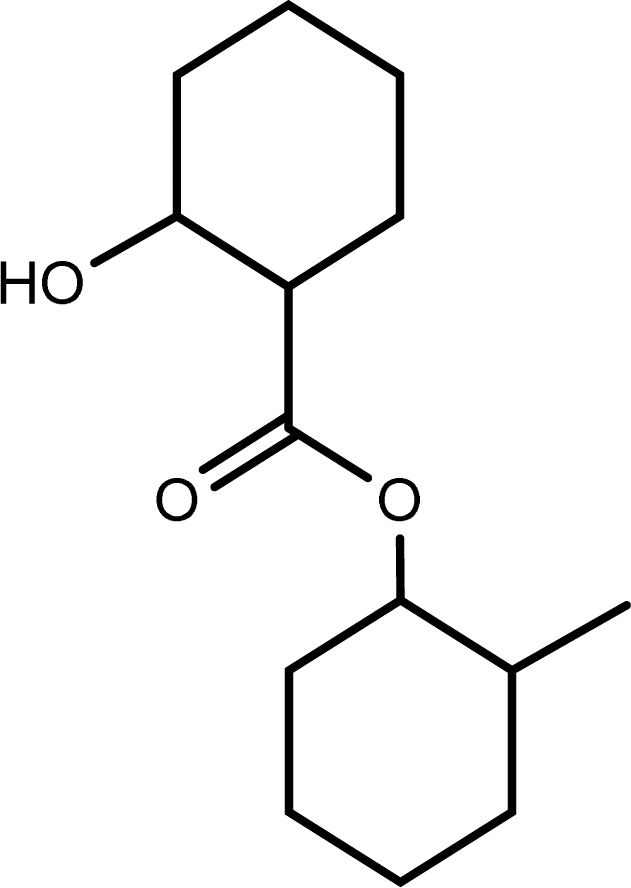 |
+ | + | + | + | |
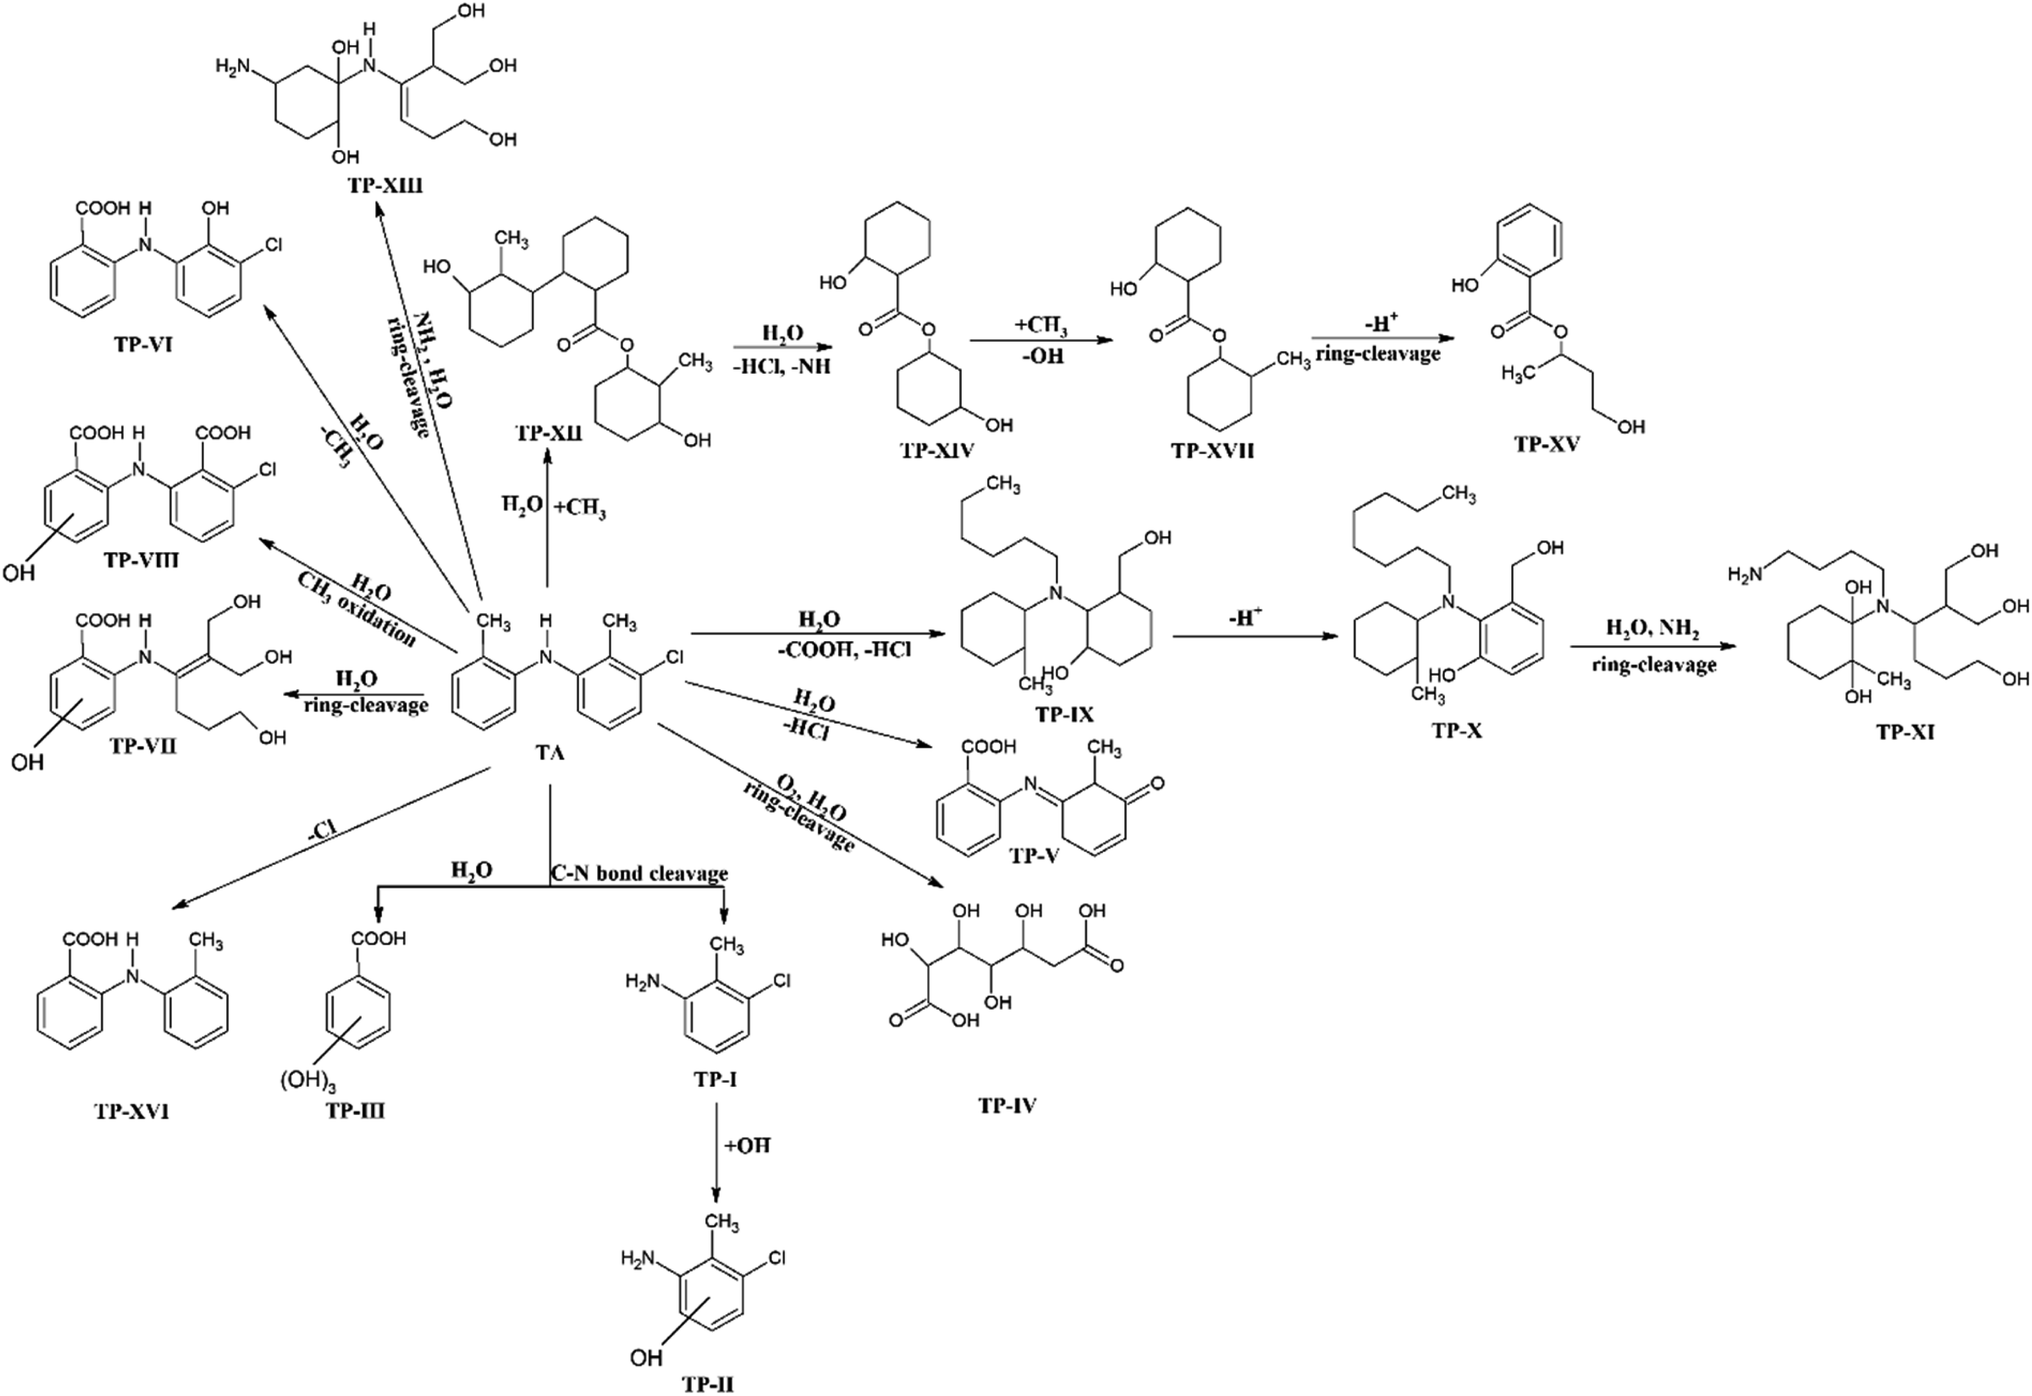
Previously, da Silva et al.29 reported a few photodegradation products of TA by direct photolysis and UV/H2O2 process, which are also found in this study, i.e., TP-I till TP-VIII (Table 3). However, in the present study, nine new photoproducts of TA have been identified (TP-IX to TP-XVII) that have not been reported earlier for TA. The formation of different photoproducts in different solvents indicates the impact of the nature of the solvent on the photodegradation of TA.
Aqueous solutions. TA molecule on irradiation is converted into an excited singlet state (1[TA]) (1) which is then converted into an excited triplet state (3[TA]) through intersystem crossing (isc) (2). The 3[TA] state interacts with ground state TA to form anionic and cationic radicals (3). These anionic and cationic radicals may accept or lose a proton, which results in the formation of reduced (4) and oxidized TA radicals (5). The two TAH˙ radicals may form oxidized and reduced TA molecules (6). The TA˙ may further lead to the formation of degradation products (7).
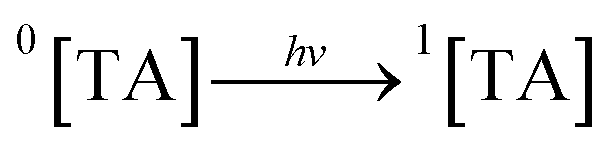 | (1) |
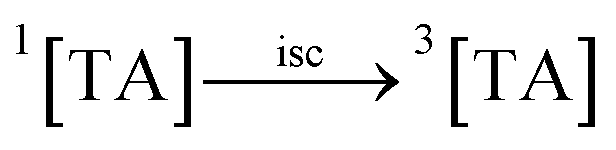 | (2) |
| 3[TA] + 0[TA] → TA˙− + TA˙+ | (3) |
 | (4) |
 | (5) |
| 2TAH˙ → TA + TAH2 | (6) |
| TA˙→degradation products | (7) |
Organic solvents. The triplet state of TA (3[TA]) by interacting with solvent molecules/ions results in the formation of a dipolar intermediate (8). This dipolar intermediate is further converted into the anion (TAH˙−) and cation (A˙+) radicals (8). The anion radical on oxidation transforms into the degraded and undegraded TA (9). The reaction scheme showing the involvement of dipolar intermediate in the photolysis of TA in organic solvents results in the degradation of TA is shown in Fig. 9.
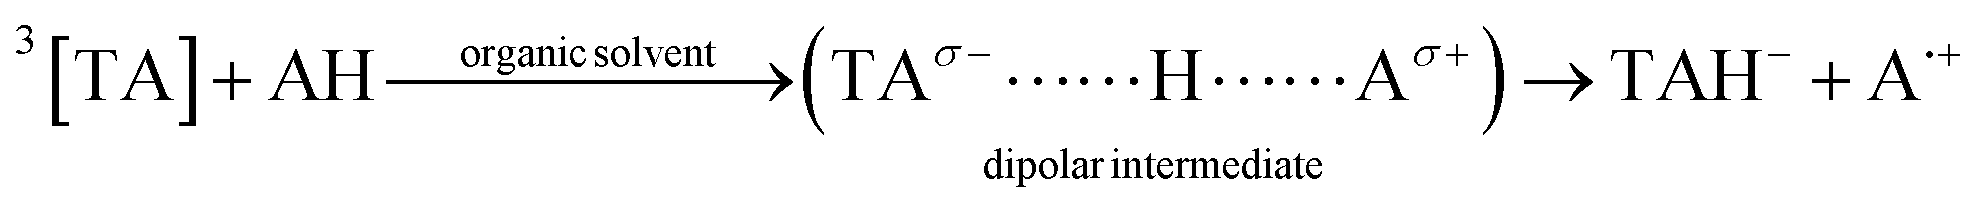 | (8) |
 | (9) |
 | ||
| Fig. 9 Suggested photodegradation pathways for the degradation of TA to form various degradation products. | ||
The degradation products identified by LC-MS/MS are given in Table 3. Based on the identification of these products formed during the photolysis reaction in different organic solvents, a photodegradation pathway has been proposed and shown in Fig. 9. TA on the absorption of light undergoes several processes, including ring-cleavage, bond-cleavage, oxidation-reduction, dechlorination, addition and removal of amine, which results in the formation of various photoproducts (Fig. 9). The degree of the formation of these photoproducts is dependent on the nature of the solvent, solvent characteristics, and interaction of TA with the specific solvent molecule.
Conclusion
TA is a photosensitive compound that is photolyzed by UV irradiation. The present study is based on the determination of the kinetics of TA in aqueous and organic solvents. The rate–pH profile represents a V-top shape curve, and the rate of degradation increased with an increase in pH from 2.0 to 3.0 (pKa1, 1.95), and beyond 4.0 (pKa2, 4.05), the rates of photodegradation decreased till pH 12.0. The higher rate of TA degradation at acidic pH is due to the sensitivity of TA towards acid hydrolysis, and a decrease in the rates of degradation at higher pH is due to the less susceptibility of TA molecules towards alkaline hydrolysis. The bulk properties of the medium used play an important role in the drug's stability. It has been found that the rate of photolysis of TA increases with the polarity of the medium and decreases with an increase in the medium viscosity.Conflicts of interest
There are no conflicts to declare.Note added after first publication
This article replaces the version published on 8 July 2024, in which equations 8 and 9 were labelled incorrectly.References
- S. Ahmed, M. A. Sheraz and I. Ahmad, in Profiles of Drug Substances, Excipients, and Related Methodology, ed. H. G. Brittain, Academic Press, Elsevier, Cambridge, USA, 2018, vol. 43, pp. 255–319 Search PubMed.
- British National Formulary (BNF) 85, BMJ Group and Royal Pharmaceutical Society, Pharmaceutical Press, London, UK, 2023.
- J. K. Chang, A. Leso, G. M. Subaiea, A. Lahouel, A. Masoud, F. Mushtaq, R. Deeb, A. Eid, M. Dash, S. W. Bihaqi and N. H. Zawia, Curr. Alzheimer Res., 2018, 15, 655–663 CrossRef CAS PubMed.
- J. M. Cornejo-Montes-de-Oca, R. Hernández-Soto, A. G. Isla, C. E. Morado-Urbina and F. Peña-Ortega, Curr. Alzheimer Res., 2018, 15, 731–742 CrossRef CAS PubMed.
- P. Liu, Y. Li, D. Liu, X. Ji, T. Chi, L. Li and L. Zou, Neurochem. Res., 2018, 43, 1938–1946 CrossRef CAS PubMed.
- A. Leso, S. W. Bihaqi, A. Masoud, J. K. Chang, A. Lahouel and N. Zawia, Exp. Biol. Med., 2019, 244, 1062–1069 CrossRef CAS.
- H. Zhang, X. Wang, P. Xu, X. Ji, T. Chi, P. Liu and L. Zou, J. Physiol. Sci., 2020, 70, 29 CrossRef CAS PubMed.
- J. Hill and N. H. Zawia, Cells, 2021, 10, 702 CrossRef CAS PubMed.
- R. Parveen, B. Sravanthi and P. Dastidar, Chem.–Asian J., 2017, 12, 792–803 CrossRef CAS.
- U. T. Sankpal, S. Goodison, M. Jone-Pauley, M. Hurtado, F. Zhang and R. Basha, Oncotarget, 2017, 8, 14593–14603 CrossRef PubMed.
- A. N. Shajahan-Haq, S. M. Boca, L. Jin, K. Bhuvaneshwar, Y. Gusev, A. K. Cheema, D. D. Demas, K. S. Raghavan, R. Michalek, S. Madhavan and R. Clarke, Oncotarget, 2017, 8, 96865–96884 CrossRef PubMed.
- S. Shelake, U. T. Sankpal, W. Paul Bowman, M. Wise, A. Ray and R. Basha, Invest. New Drugs, 2017, 35, 158–165 CrossRef CAS PubMed.
- D. Feldman, E. Leahy and S. H. Lee, Curr. Med. Chem., 2018, 25, 1598–1608 CrossRef CAS.
- M. Hurtado, U. T. Sankpal, A. Ranjan, R. Maram, J. K. Vishwanatha, G. P. Nagaraju, B. F. El-Rayes and R. Basha, Crit. Rev. Oncol. Hematol., 2018, 126, 201–207 CrossRef.
- M. Hurtado, U. T. Sankpal, A. Kaba, S. Mahammad, J. Chhabra, D. T. Brown, R. K. Gurung, A. A. Holder, J. K. Vishwanatha and R. Basha, Cell. Physiol. Biochem., 2018, 51, 1894–1907 CrossRef CAS PubMed.
- M. Hurtado, U. T. Sankpal, J. Chhabra, D. T. Brown, R. Maram, R. Patel, R. K. Gurung, J. Simecka, A. A. Holder and R. Basha, Invest. New Drugs, 2019, 37, 27–34 CrossRef CAS PubMed.
- D. Poradowski and B. Obmińska-Mrukowicz, J. Vet. Res., 2019, 63, 399–403 CrossRef CAS.
- S. Shelake, U. T. Sankpal, D. Eslin, W. P. Bowman, J. W. Simecka, S. Raut, A. Ray and R. Basha, Apoptosis, 2019, 24, 21–32 CrossRef CAS.
- J. F. Sun, Y. J. Xu, X. H. Kong, Y. Su and Z. Y. Wang, Neurosci. Lett., 2019, 696, 67–73 CrossRef CAS PubMed.
- J. Sun, R. Tao, T. Mao, Z. Feng, Q. Guo and X. Zhang, Toxicol. Appl. Pharmacol., 2019, 380, 114696 CrossRef CAS.
- M. Hurtado, L. Prokai, U. T. Sankpal, B. Levesque, R. Maram, J. Chhabra, D. T. Brown, R. K. Gurung, A. A. Holder, J. K. Vishwanatha and R. Basha, Process Biochem., 2020, 89, 155–164 CrossRef CAS.
- Y. Ma, P. Yu, S. Lin, Q. Li, Z. Fang and Z. Huang, Pharmacol. Res., 2020, 152, 104499 CrossRef CAS PubMed.
- S. Siraj, A. Kurri, K. Patel, N. Hamby and R. Basha, Crit. Rev. Oncog., 2020, 25, 355–363 CrossRef.
- C. X. Yang, L. Xing, X. Chang, T. J. Zhou, Y. Y. Bi, Z. Q. Yu, Z. Q. Zhang and H. L. Jiang, Mol. Pharm., 2020, 17, 1300–1309 CrossRef CAS PubMed.
- E. Blanco-Paniagua, A. M. García-Lino, D. García-Mateos, A. I. Álvarez and G. Merino, Chem. Biol. Interact., 2021, 345, 109537 CrossRef CAS PubMed.
- L. Xing, C. X. Yang, D. Zhao, L. J. Shen, T. J. Zhou, Y. Y. Bi, Z. J. Huang, Q. Wei, L. Li, F. Li and H. L. Jiang, J. Controlled Release, 2021, 331, 460–471 CrossRef CAS.
- S. Ahmed, N. Mustaan, M. A. Sheraz, S. A. Nabi and I. Ahmad, J. Pharmacol., 2015, 2015, 216249 Search PubMed.
- British Pharmacopoeia and Her Majesty's Stationary Office, Electronic Version, London, UK, 2024 Search PubMed.
- L. D. da Silva, R. P. Cavalcante, R. F. Cunha, F. Gozzi, R. F. Dantas, S. C. de Oliveira and A. M. Junior, Sci. Total Environ., 2016, 573, 518–531 CrossRef PubMed.
- C. A. Davis, P. R. Erickson, K. McNeill and E. M. L. Janssen, Environ. Sci.: Processes Impacts, 2017, 19, 656–665 RSC.
- S. H. Kazi, M. A. Sheraz, S. G. Musharraf, S. Ahmed, R. Bano, F. Haq and Z. Anwar, Anti-Inflammatory Anti-Allergy Agents Med. Chem., 2024, 23, 52–70 CrossRef CAS.
- H. H. Tonnesen, in The Photostability of Drugs and Drug Formulations, CRC Press, Boca Raton, FL, USA, 2004 Search PubMed.
- N. S. Abdelwahab, N. W. Ali, M. M. Zaki and M. Abdelkawy, J. Chromatogr. Sci., 2015, 53, 484–4891 CAS.
- ICH Harmonised Tripartite Guideline, Validation of Analytical Procedures: Text and Methodology Q2(R1), International Conference on Harmonization of Technical Requirements for Registration of Pharmaceuticals for Human Use, Geneva, Switzerland, 2005 Search PubMed.
- M. A. Sheraz, S. H. Kazi, S. Ahmed, Z. Anwar and I. Ahmad, Beilstein J. Org. Chem., 2014, 10, 1999–2012 CrossRef.
- O. Legrini, E. Oliveros and A. M. Braun, Chem. Rev., 1993, 93, 671–698 CrossRef CAS.
- C. A. Parker, Proc. R. Soc. Lond., 1953, A220, 104–116 Search PubMed.
- C. G. Hatchard and C. A. Parker, Proc. R. Soc. Lond., 1956, A235, 518–536 Search PubMed.
- R. K. Gilpin and W. Zhou, J. Pharm. Biomed. Anal., 2005, 37, 509–515 CrossRef CAS PubMed.
- S. Jabeen, T. J. Dines, S. A. Leharne and B. Z. Chowdhry, Spectrochim. Acta, Part A, 2012, 96, 972–985 CrossRef CAS.
- S. Ahmed, M. A. Sheraz and I. U. Rehman, AAPS PharmSciTech, 2013, 14, 870–879 CrossRef CAS PubMed.
- S. Ahmed, M. A. Sheraz, C. Yorucu and I. U. Rehman, Cent. Eur. J. Chem., 2013, 11, 1533–1541 CAS.
- S. Andleeb, S. Ahmed, M. A. Sheraz, Z. Anwar and I. Ahmad, Luminescence, 2020, 35, 1017–1027 CrossRef CAS PubMed.
- J. T. Carstensen, in Drug Stability Principles and Practices, ed. J. T. Carstensen and C. T. Rhodes, Marcel Dekker, New York, USA, 2000, pp. 73–84 Search PubMed.
- K. A. Connors, G. L. Amidon and V. J. Stella, in Chemical Stability of Pharmaceuticals, A Handbook for Pharmacists, Wiley, New York, USA, 1986 Search PubMed.
- S. Yoshioka and V. J. Stella, Stability of Drugs and Dosage Forms, Kluwer Academic/Plenum Publishers, New York, USA, 2000, pp. 139–150 Search PubMed.
- I. Ahmad, Z. Shad, K. Qadeer and R. Bano, Baqai J. Health Sci., 2016, 19, 3–11 CAS.
- A. S. Kearney and V. J. Stella, J. Pharm. Sci., 1993, 82, 69–72 CrossRef CAS.
- B. V. Shetty, R. L. Schowman, M. Slivak and C. M. Riley, J. Pharm. Biomed. Anal., 1992, 10, 675–683 CrossRef CAS PubMed.
- J. A. Molica, C. R. Rehin, J. B. Smith and H. K. Govern, J. Pharm. Sci., 1971, 60, 1380–1384 CrossRef.
- C. M. Won, Int. J. Pharm., 1994, 104, 29–40 CrossRef CAS.
- S. G. Jivani and V. J. Stella, J. Pharm. Sci., 1985, 74, 1274–1282 CrossRef CAS.
- I. Ahmad, Q. Fasihullah, A. Noor, I. A. Ansari and Q. N. Ali, Int. J. Pharm., 2004, 280, 199–208 CrossRef CAS PubMed.
- I. Ahmad, Z. Anwar, K. Iqbal, S. A. Ali, T. Mirza, A. Khurshid, A. Khurshid and A. Arsalan, AAPS PharmSciTech, 2014, 15, 550–559 CrossRef CAS PubMed.
- M. Aminuddin, U. Nazim and I. Ahmad, Indian J. Pharm. Sci., 2011, 73, 387–393 CAS.
- S. Srisantitham, M. Sukwattanasinitt and S. Unarunotai, Colloids Surf., A, 2018, 550, 123–131 CrossRef CAS.
- K. Zamojc, I. Bylinska, W. Wiczk and L. Chmurzynski, Int. J. Mol. Sci., 2021, 22, 885 CrossRef CAS PubMed.
- I. Ahmad, Z. Anwar, S. Ahmed, M. A. Sheraz, R. Bano and A. Hafeez, AAPS PharmSciTech, 2015, 16, 1122–1128 CrossRef CAS.
- W. Gul, F. H. Vaid, A. Faiyaz, Z. Anwar, A. Khurshid and I. Ahmad, J. Photochem. Photobiol., A, 2019, 376, 22–31 CrossRef CAS.
- F. H. Vaid, W. Gul, A. Faiyaz, Z. Anwar, M. A. Ejaz, S. Zahid and I. Ahmad, J. Photochem. Photobiol., A, 2019, 371, 59–66 CrossRef CAS.
- I. Ahmad, M. A. Sheraz, S. Ahmed, R. H. Shaikh, F. H. Vaid, S. R. Khattak and S. A. Ansari, AAPS PharmSciTech, 2011, 12, 917–923 CrossRef CAS PubMed.
- I. Ahmad, K. Qadeer, A. Hafeez, S. Zahid and M. A. Sheraz, J. Photochem. Photobiol., A, 2017, 332, 92–100 CrossRef CAS.
- S. Ahmed, N. Anwar, M. A. Sheraz and I. Ahmad, Sci. Technol. Dev., 2017, 36, 206–210 Search PubMed.
- I. Ahmad, M. A. Sheraz and S. Ahmed, Stability of Drugs and Drug Products, Higher Education Commission, Islamabad, Pakistan, 2017 Search PubMed.
- F. H. Vaid, S. Zahid, A. Faiyaz, K. Qadeer, W. Gul, Z. Anwar and I. Ahmad, J. Photochem. Photobiol., A, 2018, 362, 40–48 CrossRef CAS.
- I. Ahmad, R. Bano, M. A. Sheraz, S. Ahmed, T. Mirza and S. A. Ansari, Acta Pharm., 2013, 63, 223–229 CAS.
- I. Ahmad, R. Bano, S. G. Musharraf, S. Ahmed, M. A. Sheraz, M. S. Bhatti and Z. Shad, AAPS PharmSciTech, 2014, 15, 1588–1597 CrossRef CAS PubMed.
- I. Ahmad, R. Bano, S. G. Musharraf, M. A. Sheraz, S. Ahmed, H. Tahir, Q. ulArfeen, M. S. Bhatti, Z. Shad and S. F. Hussain, J. Photochem. Photobiol., A, 2015, 302, 1–10 CrossRef CAS.
- J. J. Werner, K. McNeill and W. A. Arnold, Chemosphere, 2005, 58, 1339–1346 CrossRef CAS PubMed.
- P. Chen, W. Lv, Z. Chen, J. Ma, R. Li, K. Yao, G. Liu and F. Li, Environ. Sci. Pollut. Res. Int., 2015, 22, 12585–12596 CrossRef CAS PubMed.
- P. Chen, F. L. Wang, K. Yao, J. S. Ma, F. H. Li, W. Y. Lv and G. G. Liu, Bull. Environ. Contam. Toxicol., 2016, 96, 203–209 CrossRef CAS PubMed.
- R. Colombo, T. C. Ferreira, R. A. Ferreira and M. R. Lanza, J. Environ. Manage., 2016, 167, 206–213 CrossRef CAS.
- Y. F. Velazquez and P. M. Nacheva, Environ. Sci. Pollut. Res. Int., 2017, 24, 6779–6793 CrossRef CAS PubMed.
- J. Li, H. Zhou, R. Chen, T. Yu and M. Ye, J. Adv. Oxid. Technol., 2017, 20, 20160188 CAS.
- M. Nabeel, Thermal Stability of Tolfenamic Acid in Liquid Media, Master of Philosophy thesis, Baqai Medical University, 2017 Search PubMed.
- B. Kaushik, G. Rao and D. Vaya, Photocatalytic degradation of drugs, in Handbook of Green and Sustainable Nanotechnology, ed. U. Shanker, C. M. Hussain and M. Rani, Springer Nature, Switzerland, 2022, pp. 1–29 Search PubMed.
- F. Madjene and N. Yeddou-Mezenner, Sep. Sci. Technol., 2018, 53, 364–373 CrossRef CAS.
- I. Ahmad, T. Mirza, S. G. Musharraf, Z. Anwar, M. A. Sheraz, S. Ahmed, M. A. Ejaz and A. Khurshid, RSC Adv., 2019, 9, 26559–26571 RSC.
- S. U. Khattak, D. Shaikh, I. Ahmad, K. Usmanghani, M. A. Sheraz and S. Ahmed, AAPS PharmSciTech, 2013, 14, 177–182 CrossRef CAS PubMed.
- M. A. Sheraz, S. H. Kazi, S. Ahmed, T. Mirza, I. Ahmad and M. P. Evstigneev, J. Photochem. Photobiol., A, 2014, 273, 17–22 CrossRef CAS.
- A. Khurshid, I. Ahmad, N. Khan, M. Usmani and Z. Anwar, Int. J. Chem. Kinet., 2023, 55, 190–203 CrossRef CAS.
- E. R. Garrett, J. Pharm. Sci., 1962, 51, 811–833 CrossRef CAS PubMed.
- I. Racz, Drug Formulation, John Wiley & Sons, Chichester, UK, 1989, p. 128 Search PubMed.
- P. Sinko, Chemical Kinetics and Stability, Martin's Physical Pharmacy and Pharmaceutical Sciences, Lippincott Williams & Wilkins, Philadelphia, USA, 2017, ch. 14 Search PubMed.
- Z. Peng, L. HaiXia, Y. SiDe and W. WenFeng, Sci. China Chem., 2014, 57, 409–416 CrossRef.
- M. A. Sheraz, M. F. Khan, S. Ahmed, S. H. Kazi, S. R. Khattak and I. Ahmad, Int. J. Cosmet. Sci., 2014, 36, 494–504 CrossRef CAS.
- K. J. Laidler, Chemical Kinetics, Pearson Education, New Delhi, India, 3rd edn, 1987 Search PubMed.
- A. Pross, Theoretical & Physical Principles of Organic Reactivity, John Wiley & Sons, Inc., New York, USA, 1995 Search PubMed.
- A. A. Alwasiti, Z. Y. Shnain, M. F. Abid, A. A. Razak, B. A. Abdulhussein and G. S. Mahdi, Earth Sci. Environ., 2021, 779, 012073 Search PubMed.
- Z. Y. Shnain, M. F. Abid and K. A. Sukkar, Desalination Water Treat., 2021, 210, 22–30 CrossRef.
- W. M. Haynes, CRC Handbook of Chemistry and Physics, CRC Press, Bocca Raton, FL., USA, 2017 Search PubMed.
- S. Navaratnum, Photochemical and photophysical methods used in the study of drug photoreactivity, in The Photostability of Drugs and Drug Formulations, ed. H. H. Tonnesen, Taylor & Francis, London, UK, 2004, pp. 255–284 Search PubMed.
- National Center for Biotechnology Information, PubChem Compound Summary for CID610479, Tolfenamic acid, https://pubchem.ncbi.nlm.nih.gov/compound/Tolfenamic-acid, last accessed april 30, 2024.
- M. R. Faiz, D. Widhiyanuriyawan, E. Siswanto and I. N. Wardana, IOP Conf. Ser.: Mater. Sci. Eng., 2018, 299, 012089 Search PubMed.
- S. C. Tucker and M. W. Maddox, J. Phys. Chem. B, 1998, 102, 2437–2453 CrossRef CAS.
Footnote |
| † Electronic supplementary information (ESI) available. See DOI: https://doi.org/10.1039/d4ra01369g |
| This journal is © The Royal Society of Chemistry 2024 |