 Open Access Article
Energy output performance of aluminized explosive containing Al/PTFE reactive materials
Fan Jiang ,
Peipei Sun,
Yufan Bu,
Yulei Niu,
Yuanyuan Li,
Kun Zhang,
Xiaofeng Wang and
Hai Nan*
Xi'an Modern Chemistry Research Institute, China
First published on 29th October 2024
Abstract
In this paper, a series of CL-20 based explosive formulations containing Al/PTFE reactive materials are designed using a self-designed closed explosion test device. The quasi-static pressure (QSP) and peak temperature of the explosive reaction are studied under different mass percentages of Al/PTFE and different charge structures. The composition and morphology of the solid residue products after the explosion were analyzed, proving the feasibility of using Al/PTFE in explosives and providing theoretical support for the design of the aluminized explosive in this system. The results show that a high content of Al/PTFE reactive material can be successfully detonated by CL-20. Using CL-20 as the central explosive column can make pure Al/PTFE react, but this will result in a decrease in QSP by about 25%. The mass ratio of 75/25 has the highest QSP, which can reach 0.289, 0.310, 0.270 and 0.218 MPa. The three samples in G2# exhibit the highest equilibrium temperature, with G2#A, G2#B and G2#C reaching 868.2 °C, 942.0 °C and 626.2 °C, respectively. Regardless of the charge structure, the equilibrium temperatures after explosion of Al/PTFE at ratios of 75/25 and 70/30 are higher than those of 60/40. When the proportion of Al/PTFE is 60/40, the equilibrium temperature after explosion will decrease by nearly 20%. XRD revealed that the solid residue mainly comprises Al, α-Al2O3 and γ-Al2O3. No C element was found in the solid product, indicating that the C element mainly exists in a gaseous state after the explosion.
1. Introduction
Recently, Al/PTFE (aluminum/polytetrafluoroethylene) has attracted increasing attention because of its high energy density (21 kJ cm−3), strong stability, enhanced mechanical properties, excellent processing performance and practical applications in heterogeneous explosives and propellants,1–5 making it one of the most promising reactive materials (RMs). PTFE will generate AlF3 intermediate products during the reaction process. Unlike conventional Al2O3, the melting point of AlF3 is only 1272 °C, and the gas generated in the reaction process may promote the mass transfer process.6,7 Furthermore, the oxidizing property of F in PTFE is stronger than that of O. With a high content of F, PTFE also has a strong oxidizing property, which can greatly improve the mechanical properties, safety of the system and completeness of the reaction of aluminum powder; it exhibits excellent comprehensive performance.8On the one hand, Al/PTFE can improve the kinetic parameters during explosion and reaction processes. Reducing the particle size of aluminum can increase the diffusion distance and reaction area, thus improving the combustion performance in both explosives and propellants.9–11 Due to the flake-like Al after ball-milling treatment, it has a larger specific surface area and reactivity compared with spherical aluminum powder. Verma et al. and Gaurav et al.12,13 observed a substantial increase in the burn rate of solid propellants using flake-like aluminum. Wen et al.14 used a formulation of 3.5% Al/PTFE in DNTF-based micro explosive networks and found that a micro-groove of 0.8 mm × 0.8 mm can realize reliable explosion propagation, with the formula containing activated Al/PTFE has a larger expansion width. Wang et al.15 designed and synthesized nano Al/PTFE with a core–shell structure through an in situ continuous synthesis process, and successfully improved the reaction kinetics parameters and combustion performance, which contribute to the energy utilization of aluminum. Sterletskii et al.16 studied the structure of the Al/PTFE complex and found that activation treatment can reduce the small component particle size, increase the contact area between components, and generate an accumulation of dislocations and the formation of free radicals, thereby enhancing the chemical activity of the system and decreasing the activation energy of the reaction.
On the other hand, Al/PTFE can enhance the energy of system explosion and combustion reactions, increase the reaction temperature and enhance the after-burning effect of an explosion. Cao et al.17 studied the energy performance of aluminized HMX containing PTFE, and the results showed that although PTFE can decrease the acceleration ability compared with PTFE-free aluminized HMX, it exhibits a remarkable after-burning potential. Xiao et al.18 found that PTFE can increase the fireball temperature of a thermobaric explosive during the after-burning reaction process by 1000 °C and prolong the reaction time of Al to nearly 200 ms. Wang et al.1 found that by adding a 9% mass fraction of AP to the PTFE/Al system, the energy output, combustion rate and pressure rate of the system can be greatly improved. Tao et al.19 found that the ignition temperature required for the Al/PTFE after ball milling activation treatment is lower and the combustion reaction is faster. In the formulation of an explosive system, the reaction completion rate of aluminum powder can be increased. Moreover, due to its cost-effectiveness and enhanced reactivity, as well as its ability to aid in bonding and shaping the composition of pressed aluminized explosives, Al/PTFE can reduce the proportion of binder used in the formulation of pressed explosives, achieving certain advantages in explosive systems.
Based on the numerous advantages of Al/PTFE, it exhibits good reactivity in enclosed and semi-enclosed environments. Previous studies have conducted some research on energy in explosive systems, but there is still insufficient research on the proportion of Al/PTFE, energy level after explosion, and analysis of explosive products. Therefore, in this paper, the quasi-static pressure (QSP) and equilibrium temperature of the explosive reaction under different mass percentages of Al/PTFE and different charge structures were studied using a self-developed closed explosive chamber device. The explosive power and reaction temperature of explosives under different Al/PTFE ratios were measured, and the composition and morphology of the solid residue products after the explosion were analyzed.
2. Experimental section
2.1 Reagents and materials
Explosive samples were prepared for the study. Among the four crystal forms (α, β, γ, and ε) of CL-20, ε-CL-20 has the highest density of about 2.04 g cm−3, best thermal stability, and lowest sensitivity. In this paper, industrial grade ε-CL-20 was bought from Liaoning Qingyang Chemical Industry Corporation. The median particle size (D50) of ε-CL-20 was 100 μm, and the purity exceeded 99.5%. Three Al/PTFE (polytetrafluoroethylene) materials were home-made using a mechanical ball milling method. The mass ratios of Al to PTFE for these materials were 60![[thin space (1/6-em)]](https://www.rsc.org/images/entities/char_2009.gif) :
:![[thin space (1/6-em)]](https://www.rsc.org/images/entities/char_2009.gif) 40, 70
40, 70![[thin space (1/6-em)]](https://www.rsc.org/images/entities/char_2009.gif) :
:![[thin space (1/6-em)]](https://www.rsc.org/images/entities/char_2009.gif) 30 and 75
30 and 75![[thin space (1/6-em)]](https://www.rsc.org/images/entities/char_2009.gif) :
:![[thin space (1/6-em)]](https://www.rsc.org/images/entities/char_2009.gif) 25, respectively. FLQT4 aluminum powder was provided by Angang Group Aluminum Powder Co. Ltd. PTFE powder was purchased from Sichuan Golden Nuclear Radiation Technology Co. Ltd., with D50 ≤ 5 μm and molecular weight ≤ 32
25, respectively. FLQT4 aluminum powder was provided by Angang Group Aluminum Powder Co. Ltd. PTFE powder was purchased from Sichuan Golden Nuclear Radiation Technology Co. Ltd., with D50 ≤ 5 μm and molecular weight ≤ 32![[thin space (1/6-em)]](https://www.rsc.org/images/entities/char_2009.gif) 000. The shelf lives of Cl-20 and Al/PTFE used in the article exceed 15 years. Due to the low hygroscopicity and good thermal safety of CL-20 during storage, there are no special requirements for the temperature and humidity of the storage environment. Storage at room temperature can meet its requirements. Additionally, as the Al in Al/PTFE will react slowly with water, it is necessary to avoid long-term storage and excessively humid environments. The SEM images of the three different mass ratio of Al/PTFE samples (60
000. The shelf lives of Cl-20 and Al/PTFE used in the article exceed 15 years. Due to the low hygroscopicity and good thermal safety of CL-20 during storage, there are no special requirements for the temperature and humidity of the storage environment. Storage at room temperature can meet its requirements. Additionally, as the Al in Al/PTFE will react slowly with water, it is necessary to avoid long-term storage and excessively humid environments. The SEM images of the three different mass ratio of Al/PTFE samples (60![[thin space (1/6-em)]](https://www.rsc.org/images/entities/char_2009.gif) :
:![[thin space (1/6-em)]](https://www.rsc.org/images/entities/char_2009.gif) 40 70
40 70![[thin space (1/6-em)]](https://www.rsc.org/images/entities/char_2009.gif) :
:![[thin space (1/6-em)]](https://www.rsc.org/images/entities/char_2009.gif) 30 75
30 75![[thin space (1/6-em)]](https://www.rsc.org/images/entities/char_2009.gif) :
:![[thin space (1/6-em)]](https://www.rsc.org/images/entities/char_2009.gif) 25) after ball milling are shown in Fig. 1.
25) after ball milling are shown in Fig. 1.
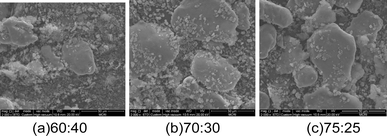 | ||
Fig. 1 SEM images of different mass ratio of Al/PTFE samples after ball milling: (a) 60![[thin space (1/6-em)]](https://www.rsc.org/images/entities/char_2009.gif) : :![[thin space (1/6-em)]](https://www.rsc.org/images/entities/char_2009.gif) 40; (b) 70 40; (b) 70![[thin space (1/6-em)]](https://www.rsc.org/images/entities/char_2009.gif) : :![[thin space (1/6-em)]](https://www.rsc.org/images/entities/char_2009.gif) 30; (c) 75 30; (c) 75![[thin space (1/6-em)]](https://www.rsc.org/images/entities/char_2009.gif) : :![[thin space (1/6-em)]](https://www.rsc.org/images/entities/char_2009.gif) 25. 25. | ||
It can be seen from Fig. 1 that the surface morphology of the prepared Al/PTFE reactive material is flake-like. The PTFE is evenly distributed on the surface of Al, and the sample shows good uniformity. When the content of PTFE in the Al/PTFE reactive materials decreases from 40% to 25%, the particle size of the prepared sample increases. This is because the aluminum particles are deformed under the high-speed impact and extrusion of the grinding balls during the ball milling process, and the PTFE lacks ductility and prevents cold welding between the aluminum particles during the ball milling process, resulting in an increase in the particle size of the prepared samples.
To explore the amount of sample, components of the reactive materials and effect of the charge structure on the effect of the explosion, 12 samples were prepared and divided into four groups (G1#–G4#) according to their different charge structures. Each sample was detonated with an 8# detonator. Due to the high content of reactive metals in the samples, the materials are relatively insensitive; consequently, for the central booster explosives, CL-20-based explosive was adopted for detonation. The mass of the booster explosives of each of the four groups were 5 g. The depths of the boosters of the four groups(G1#–G4#) were 7.5 mm, 15 mm, 15 mm, and 15 mm, respectively. The boosters were put into the explosives with reserved holes. As shown in Table 1, the contents of the first three groups of explosives were the same at 50 g. The diameters of group 1 (G1#) and group 2 (G2#) were 40 mm, and the difference between the first two groups was mainly the depth of the booster in the explosives, which results in different aspect ratios of the explosive. Due to the good desensitization effect of wax, the binder of the formulation components is composed of wax.
The diameters of the explosives of G3# and G4# were 26.8 mm. The main explosive of G3# used the same explosives as G1# and G2#. Moreover, to explore the reaction characteristics of reactive metals with the structure of explosives in the center and reactive metals in the surroundings, the fourth group replaced the explosives with pure reactive metals. This structure was studied because, in the process of designing anti-overload explosives, such structures can serve as buffer structures to enhance the anti-overload resistance stability of the main explosive. Detailed information about the samples and charge structure is shown in Table 1 (A, B, and C in the sample numbers represent different mass contents of Al and PTFE).
2.2 Experimental facility
As an explosion experiment in a closed environment is an effective way to evaluate the energy of thermobaric explosives, to study the influence of different contents of Al/PTFE and charge structures on the explosion energy output, a self-designed internal explosion experimental device was used as an experimental setup for the internal explosion process. The device was a rectangular explosion test chamber with length, width and height of 1400 mm, 850 mm and 850 mm, respectively. The internal volume of the explosion chamber was about 1 m3, and the thickness was 10 mm. Five sides of the explosion chamber were sealed, and a hole with a diameter of 500 mm was opened in the center of one side with a size of 850 mm × 850 mm. A flange was welded outward from the hole. After the sample was loaded, a steel plate was used for sealing.A schematic diagram of the explosive device and its sensor installation schematic are shown in Fig. 2. Before the experiment, the sample was suspended in the center of the rectangular explosion chamber, and two pressure and two temperature sensors were arranged on both sides of the chamber to collect the QSP and temperature data after the explosion. The design of the test point is shown in the Fig. 2. The QSP measuring point is located on the horizontal center line of the side wall surface, and the horizontal distance from the center point of the surface is 300 mm. Screw holes were reserved on both sides of the container to connect two temperature sensors and two pressure sensors.
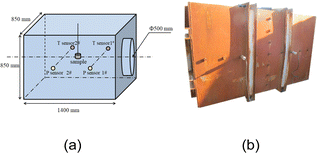 | ||
| Fig. 2 Schematic and physical diagram of explosive device: (a) schematic diagram; (b) physical picture of the device. | ||
The two temperature sensors used were fast-reacting tungsten rhenium thermocouples produced by American NANMAC company, which can test high temperatures up to 2300 °C. The QSP test adopts a device home-made by Xi'an Institute of Modern Chemistry. The device system includes an air intake, a tube, a screw rod, copper backing, a mounting base and a pressure sensor, as shown in Fig. 3. The pressure sensor is a CYG400 piezoresistive pressure sensor from the Kunshan Shuangqiao Sensor Measurement and Control Company. The pressure produced by internal explosion can be transmitted through the groove structure on the screw rod, which can filter out the high-frequency components of the shock wave and achieve low-frequency QSP; consequently, the device achieved direct measurement of the low-frequency QSP.
Throughout the entire experiment, personnel are required to wear anti-static work clothes and shoes and to ensure that the site, tools, and operators meet safety requirements. After inserting the detonator into the detonator hole, it should be securely fixed. When the placement of all samples is completed, to prevent equipment damage that may cause fragment injuries, the personnel should evacuate the explosive device and enter a shelter before detonation.
2.3 Experimental method
Initially, the sample was placed in the center of the explosion container, where the center of the sample was 40 cm away from the ground of the chamber. The detonator was then inserted into the detonator hole reserved for the booster charge, and the detonator line was led from the side of the container. After closing the explosion tank, the bolts were tightened. Finally, No. 8 electric detonator was used for detonation at the center of the upper end of the explosives. After detonation, temperature sensors and pressure sensors were used to measure the temperature and pressure of the chamber and to record the experimental data.2.4 Characterization
To further study the explosion reaction mechanism of explosives containing Al/PTFE, the solid residues of the samples after detonation were collected and analyzed. The surface morphology of the detonation solid residue products was studied with a Quanta600FEG scanning electron microscope made in Germany. The crystal types of the detonation solid residue were analyzed with an EMPYREAN X-ray powder diffraction instrument from the Netherlands with a scanning angle of 5–90°.3. Results and discussion
3.1 Quasi-static pressure
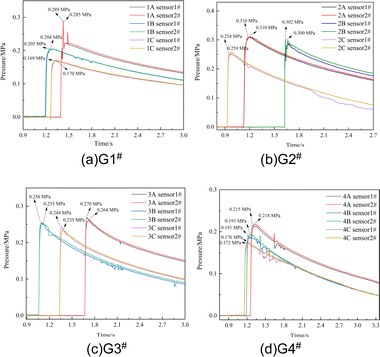
To ensure the reliability of the data test, two sets of symmetrically distributed sensors (sensor 1# and sensor 2#) were used to make simultaneous measurements by taking the average value measured by the two sensors as the final measurement value of the experiment, as shown in Table 2. The pressure–time curves after detonation of G1#–G4# are shown in Fig. 4. As shown in Fig. 4, although the contents of CL-20 in the formulations containing Al/PTFE were not high, all 12 samples were successfully detonated and data were collected, which also confirmed the feasibility of using a high content of Al/PTFE in an explosive system. This is also because CL-20 was used as the main explosive in the formulation system, which has high energy and can promote the completeness of the explosion reaction of the relatively insensitive Al/PTFE in the system.| Sample group | Sample number | QSP of sensor 1#/MPa | QSP of sensor 2#/MPa | Average QSP/MPa |
|---|---|---|---|---|
| G1# | 1A | 0.289 | 0.285 | 0.289 |
| 1B | 0.205 | 0.204 | 0.205 | |
| 1C | 0.169 | 0.170 | 0.170 | |
| G2# | 2A | 0.310 | 0.310 | 0.310 |
| 2B | 0.302 | 0.300 | 0.302 | |
| 2C | 0.254 | 0.259 | 0.259 | |
| G3# | 3A | 0.270 | 0.264 | 0.270 |
| 3B | 0.256 | 0.253 | 0.256 | |
| 3C | 0.244 | 0.235 | 0.244 | |
| G4# | 4A | 0.215 | 0.218 | 0.218 |
| 4B | 0.191 | 0.193 | 0.193 | |
| 4C | 0.176 | 0.172 | 0.176 |
After detonation, the pressure of the explosives increased rapidly, reaching the peak time of QSP in 3–63 ms, then slowly declined after the peak. Due to the difference in the triggering time of the sensors after detonation, the determination time of the pressure rise between the samples in the figure was not used for reference. When comparing the power of explosives in a confined space, the US Naval Surface Weapons Center used QSP as an important power judgment parameter for explosive formula screening and believed that explosives with high QSP have higher power after an explosion.
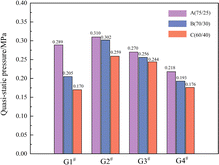
The QSP histogram of the sample is shown in Fig. 5.
By comparing the QSP of samples with different charge structures after detonation, the order of QSP in each group is G2# >G 1# > G3# > G4#, where it was found that the QSP of the three samples in G2# are higher than those of the other 3 groups, no matter whether the contents of PTFE were 75/25, 70/30 or 60/40. Due to the high content of Al/PTFE in the formulations, the detonation growth is relatively weaker than that of traditional high explosives and the content of the main explosive CL-20 is only 20%; consequently, the depth of the booster has a certain impact on the completeness of the explosion reaction. In group G3#, CL-20 and Al/PTFE were uniformly distributed. The explosive components of group G4# were designed as control samples for G3#, mainly to study the reaction of CL-20 as the central charge to pure Al/PTFE (reactive materials) after detonation. It can be observed that the charge structure of the central JH-14 detonation transmission and CL-20 as the central explosive column can successfully make pure Al/PTFE react (the QSP and equilibrium temperature data can be collected by the sensors). However, compared with G3#, its QSP after explosion has decreased by about 25%. By comparing the QSP results of different Al/PTFE contents among the 4 groups, the mass ratio of 75/25 (1A, 2A, 3A, 4A) has the highest QSP, which can reach 0.289, 0.310, 0.270 and 0.218 MPa, respectively.
3.2 Equilibrium temperature
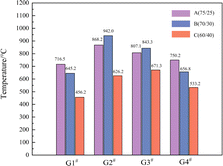
The explosion field temperatures of the 12 samples were recorded and are shown in Fig. 6. The temperature of the samples increased rapidly after detonation, gradually reaching a peak before decreasing. The temperature peak times were in the range of 93 ms to 375 ms, slightly less than that of QSP. In addition to the first reaction stage (the chemical reaction stage of anaerobic combustion) and the second reaction stage (the anaerobic combustion stage after the initial detonation) of the explosion, the temperature rise of the explosion field in the closed environment is mainly affected by the significant post-combustion effect of the detonation products mixed with fuel in the third stage (the aerobic combustion stage of the detonation reaction process) with oxygen in the air in the analytical form. The redox reaction in this process lasts for tens of milliseconds, which is consistent with the experimental results. The maximum equilibrium temperature of sample G2#B can reach as high as 942 °C (Table 3).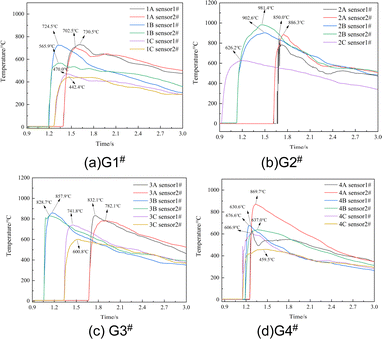 | ||
| Fig. 6 Equilibrium temperature curves after detonation of the samples: (a) G1#; (b) G2#; (c) G3#; (d) G4#. | ||
| Sample group | Sample number | Peak temperature 1/°C | Peak temperature 2/°C | Average peak temperature/°C |
|---|---|---|---|---|
| G1# | 1A | 730.5 | 702.5 | 716.5 |
| 1B | 724.5 | 565.9 | 645.2 | |
| 1C | 470.0 | 442.4 | 456.2 | |
| G2# | 2A | 850.0 | 886.3 | 868.2 |
| 2B | 902.6 | 981.4 | 942.0 | |
| 2C | 626.2 | — | 626.2 | |
| G3# | 3A | 832.1 | 782.1 | 807.1 |
| 3B | 857.9 | 828.7 | 843.3 | |
| 3C | 741.8 | 600.8 | 671.3 | |
| G4# | 4A | 630.6 | 869.7 | 750.2 |
| 4B | 676.6 | 637.0 | 656.8 | |
| 4C | 606.9 | 459.5 | 533.2 |
As shown in Fig. 7, the equilibrium temperatures after explosion of the samples are different from the maximum QSP. A higher QSP does not necessarily correspond to a higher equilibrium temperature, which is consistent with the results of Yang and Jiang,20,21 who found that the QSP and temperature of the explosion field of HMX-based aluminized explosives were not consistent. Research on the performance of explosive formulations with different aluminum contents (the aluminum content is 15–30%) showed that 20% aluminum content had the highest QSP and that the increase in aluminum content over a certain range can enhance the exothermic ability of the explosive reaction. The three samples in G2# have the highest equilibrium temperature compared with the other groups. The equilibrium temperatures of G2#A, G2#B and G2#C can reach 868.2 °C, 942.0 °C and 626.2 °C, respectively.
As shown in Fig. 1, with the increase in the Al ratio in Al/PTFE, the aluminum powder forms flakes due to the squeezing effect during the ball milling process. As the PTFE component decreases, the blocking effect on the agglomeration caused by cold welding between aluminum particles during the ball milling process decreases. Consequently, the size of the Al particles in the system increases, from 30 μm to about 50 μm. From the equilibrium temperature of the explosion reaction, it can be seen that the relatively larger particle size of Al powder helps to increase the quasi-static pressure of the explosion reaction. The equilibrium temperature mainly depends on the reaction completion rate of the aluminum powder after the explosion reaction. From the microstructure of Al/PTFE ratios of 70![[thin space (1/6-em)]](https://www.rsc.org/images/entities/char_2009.gif) :
:![[thin space (1/6-em)]](https://www.rsc.org/images/entities/char_2009.gif) 30 and 75
30 and 75![[thin space (1/6-em)]](https://www.rsc.org/images/entities/char_2009.gif) :
:![[thin space (1/6-em)]](https://www.rsc.org/images/entities/char_2009.gif) 25, the dispersion of Al and PTFE shows higher uniformity compared with 60
25, the dispersion of Al and PTFE shows higher uniformity compared with 60![[thin space (1/6-em)]](https://www.rsc.org/images/entities/char_2009.gif) :
:![[thin space (1/6-em)]](https://www.rsc.org/images/entities/char_2009.gif) 40; consequently, the equilibrium temperature of their reaction after explosion is relatively high. Therefore, when preparing Al/PTFE samples, the uniformity of the samples after ball milling should be fully considered.
40; consequently, the equilibrium temperature of their reaction after explosion is relatively high. Therefore, when preparing Al/PTFE samples, the uniformity of the samples after ball milling should be fully considered.
Due to the relatively low content of the main explosive in this formulation system and the relatively high content of Al/PTFE, it is a typical non-ideal explosive. The detonation reaction of non-ideal explosives is incomplete. When using a booster explosive for detonation, compared with G1#, G2# has the best effect on the detonation reaction of surrounding explosives due to the complete insertion of the booster explosive into the explosive. The booster charges of G3# and G4# have completely entered the explosives; however, due to their larger aspect ratio, the non-ideality of the explosion reaction is amplified, resulting in a decrease in the completeness of the explosion reaction and a relatively low energy of the explosion reaction.
Regardless of the charge structure, the equilibrium temperatures after explosion of Al/PTFE of 75/25 and 70/30 are higher than that of 60/40. When the proportion of Al/PTFE was 60/40, the equilibrium temperature after explosion dropped by nearly 20%. This was principally because PTFE (–[CF2]n–) mainly acted as an oxide in the explosion reaction, and its mass ratio of Al to PTFE (60/40) was converted to a molar ratio of 2.22![[thin space (1/6-em)]](https://www.rsc.org/images/entities/char_2009.gif) :
:![[thin space (1/6-em)]](https://www.rsc.org/images/entities/char_2009.gif) 1.60. When F was completely oxidized, its first generated product was AlF3, and the complete oxidation of F element with Al was excessive.
1.60. When F was completely oxidized, its first generated product was AlF3, and the complete oxidation of F element with Al was excessive.
According to the standard method for determining the explosive detonation heat of GJB772A-97, the detonation heat level of explosives under vacuum conditions in a confined space was studied. The composition of the formulation is consistent with Tables 1, in which a small amount of CL-20 was used as the main explosive. The column mass for the detonation heat test was 100 g, and the detonation heat of the explosives can be obtained, as shown in Table 4.
| AAl/PTFE = 75/25 | BAl/PTFE = 70/30 | CAl/PTFE = 60/40 | |
|---|---|---|---|
| Detonation heat/kJ kg−1 | 7803 | 7762 | 7685 |
It can be seen from Table 4 that the content of Al/PTFE had the highest explosion heat value at a content of 75/25, reaching as high as 7803 kJ kg−1. When the proportion of Al/PTFE further decreased, the detonation heat decreased to 7762 kJ kg−1. In fact, when the ratios of Al/PTFE were 75/25 and 70/30, the detonation heat was at a relatively high level. When the proportion of Al/PTFE component was further reduced to 60/40, the detonation heat of the system was 7685 kJ kg−1, which is also consistent with the equilibrium temperature results of the detonation reaction of the system in a closed environment.
3.3 Analysis of explosion products
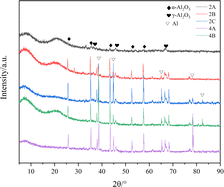
To further study the reaction of the system after detonation, the solid residue after the explosion of the sample was collected. Samples 2A, 2B and 2C of G2# and 4A and 4B of G4# were mainly studied through an X-ray powder diffraction experiment, as shown in Fig. 8.The results show that the reaction solid residue products were mainly composed of aluminum and cubic crystal α-Al2O3 and γ-Al2O3. The crystal diffraction peak of elemental Al can also be observed from the XRD diagram, which indicates that Al cannot react completely in the process of explosion. Moreover, no crystal diffraction peak of AlF3 was found in the XRD results, indicating that there was no AlF3 generated in the final product. When heated to 300–400 °C, AlF3 can be decomposed into HF and Al2O3 under an atmosphere of water vapor.22 As the equilibrium temperature environment of the explosion products in this study is higher than this temperature, AlF3 will react with H2O immediately after formation.
This is consistent with the experimental results of Xiao,23 where the Al/PTFE composite will first decompose into C2F4 and CF2 at high temperature. These products will accelerate the reaction of aluminum with water vapor, react with aluminum particles to generate AlF3 and Al4C3, and form Al2O3 at the same time. As the reaction proceeds, the formed AlF3 will further form α-Al2O3. The reaction equation of its decomposition process is shown in formulae (1)–(5).
 | (1) |
 | (2) |
| Al + CF2(C2F4) → AlF3 + Al4C3 | (3) |
| Al + 3H2O → Al2O3 + 3H2 | (4) |
| 2AlF3 + 3H2O → Al2O3 + 6HF6 | (5) |
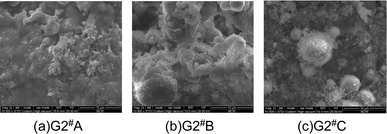
A scanning electron microscope was used to observe the surface morphology of samples G2#A, G2#B, and G2#C. The results are shown in Fig. 9.
It can be seen from the surface morphology of solid residue products that their surfaces are melted and agglomerated, which also confirms the combustion reaction and melting phase transition process on their surfaces after detonation. Due to the high temperature in the reaction process, it can be seen that the products have melted. The skeleton structure is mainly composed of unreacted aluminum and reacted aluminum α-Al2O3 and γ-Al2O3. The SEM images for the EDS test of solid residue products after detonation are shown in Fig. 10.
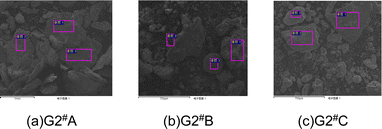 | ||
| Fig. 10 SEM images for the EDS test of solid residue products after detonation: (a) G2#A; (b) G2#B; (c) G2#C. | ||
The EDS results of G2#A, G2#B, and G2#C were analyzed, as shown in Table 5, and only Al and O elements were detected. C element was not detected in the solid product, indicating that C in the main explosive was released in the form of gaseous CO and CO2. Therefore, it is speculated that the Al and O in the EDS of the solid product are unreacted Al and the explosion product Al2O3 in the system, respectively. As EDS is a semi-quantitative characterization method, it can indirectly reflect the completeness of the Al powder reaction. The higher the content of O, the higher the proportion of Al2O3 generated. Therefore, the order of reaction completeness of aluminum powder from high to low is G2#A > G2#B > G2#C. This is consistent with the order of QSP of the explosion reaction, indicating that the improvement in the completeness of the aluminum powder reaction helps to increase the explosion reaction temperature.
| Elements | G2#A | G2#B | G2#C | |||
|---|---|---|---|---|---|---|
| O | Al | O | Al | O | Al | |
| Spectrum 1 (quality percentage) | 62.29% | 37.71% | 45.35% | 54.65% | 39.00% | 60.90% |
| Spectrum 2 (quality percentage) | 57.73% | 42.27% | 45.16% | 54.84% | 38.94% | 61.06% |
| Spectrum 3 (quality percentage) | 76.47% | 23.53% | 42.77% | 57.23% | 34.69% | 65.31% |
| Average quality percentage | 65.50% | 34.50% | 44.43% | 55.57% | 37.58% | 62.42% |
| Average molar percentage | 75.22% | 24.78% | 57.42% | 42.58% | 50.37% | 49.63% |
4. Conclusions
In the article a series of CL-20 based explosive formulation containing Al/PTFE reactive materials was innovatively developed, and a self-designed closed explosion test device was used to study the explosion reaction energy in a closed environment, proving the feasibility of using Al/PTFE in explosives and providing theoretical support for the design of aluminized explosives in this system.(1) Using CL-20 as the main explosive can successfully detonate a high content of Al/PTFE reactive materials. CL-20 as the central explosive column can successfully make pure Al/PTFE react, but will result in a decrease in quasistatic pressure by about 25% compared with uniform mixing of explosives and Al/PTFE. After detonation, the peak time of QSP and equilibrium temperature were 38–63 ms and 93–375 ms, respectively. The mass ratio of 75/25 (1A, 2A, 3A, 4A) has the highest QSP, which can reach 0.289, 0.310, 0.270 and 0.218 MPa, respectively. By comparing different charge structures, the order of quasistatic pressure between different groups is G2# > G1# > G3# > G4#. The QSP of the three samples in G2# are higher than those of the others, no matter what the content of PTFE is.
(2) The QSP and temperature of the explosion field of aluminized explosives are not consistent. The three samples in G2# have the highest equilibrium temperature. The equilibrium temperatures of G2#A, G2#B and G2#C can reach 868.2 °C, 942.0 °C and 626.2 °C, respectively. Regardless of the charge structure, the equilibrium temperature after explosion of Al/PTFE of 75/25 and 70/30 are better than that of 60/40. When the proportion of Al/PTFE is 60/40, the equilibrium temperature after explosion will drop by nearly 20%.
(3) The solid residue products are mainly composed of aluminum and cubic crystal α-Al2O3 and γ-Al2O3. No AlF3 crystal was found in the product. No C element was found in the solid product, indicating that C element mainly exists in a gaseous state after explosion.
(4) The explosive system studied in the paper is suitable for a closed environment. However, due to the relatively high cost of CL-20 explosives, it currently does not satisfy the conditions to be promoted in civilian explosives.
Data availability
The data that support the findings of this study are available from the author, upon reasonable request.Conflicts of interest
There are no conflicts to declare.Acknowledgements
This work was supported by the the damage assessment Institute of Xi'an Institute of Modern Chemistry.Notes and references
- J. Wang, L. Zhang, Y. F. Mao and F. Y. Gong, Combust. Flame, 2020, 214, 419–425 CrossRef CAS.
- X. F. Zhang, A. S. Shi, L. Qiao, J. Zhang, Y. G. Zhang and Z. W. Guan, J. Appl. Phys., 2013, 113, 083508 CrossRef.
- L. Glavier, G. Taton, J. M. Ducéré, V. Baijot, S. Pinon, T. Calais, A. Estève, M. D. Rouhani and C. Rossi, Combust. Flame, 2015, 162(5), 1813–1820 CrossRef CAS.
- C. Ge, Y. X. Dong and W. Maimaitituersun, Materials, 2016, 9(7), 590 CrossRef PubMed.
- S. X. Sun, B. B. Zhao, G. P. Zhang and Y. J. Luo, Propellants, Explos., Pyrotech., 2018, 43(11), 1105–1114 CrossRef CAS.
- G. Q. Jian, J. Y. Feng, R. J. Jacob, G. C. Egan and M. R. Zachariah, Angew. Chem., Int. Ed., 2013, 52(37), 9743–9746 CrossRef CAS PubMed.
- K. S. Martirosyan, J. Mater. Chem., 2011, 21(26), 9400–9405 RSC.
- S. X. Sun, B. B. Zhao, G. P. Zhang and Y. J. Luo, Propellants, Explos., Pyrotech., 2018, 43(11), 1105–1114 CrossRef CAS.
- D. T. Osborne and M. L. Pantoya, Combust. Sci. Technol., 2007, 179(8), 1467–1480 CrossRef CAS.
- M. L. Pantoya and S. W. Dean, Thermochim. Acta, 2009, 493(1–2), 109–110 CrossRef CAS.
- D. T. Osborne and M. L. Pantoya, Combust. Sci. Technol., 2007, 179(8), 1467–1480 CrossRef CAS.
- S. Verma and P. A. Ramakrishna, J. Propul. Power, 2013, 29(5), 1200–1206 CrossRef CAS.
- M. Gaurav and P. A. Ramakrishna, Combust. Flame, 2016, 166, 203–215 CrossRef.
- X. M. Wen, S. Wang, H. Kang and J. H. Wang, J. Phys.: Conf. Ser., 2023, 2478(12), 122054 Search PubMed.
- J. Wang, Z. Q. Qiao, Y. T. Yang, J. P. Shen, Z. Long, Z. Q. Li, X. D. Cui and G. C. Yang, Chem.–Eur. J., 2016, 22(1), 279–284 CrossRef CAS PubMed.
- A. N. Sterletskii, A. Y. Dolgoborodov, I. V. Kolbanev, M. N. Makhov, S. F. Lomaeva, A. B. Borunova and V. E. Fortov, Colloid J., 2009, 71, 852–860 CrossRef CAS.
- W. Cao, J. Ran, H. Wang, W. Guo, X. Lu and J. Wang, Propellants, Explos., Pyrotech., 2022, 47(6), 1–7 CrossRef.
- W. Xiao, J. Huang, Z. Han, X. Hong and B. Wang, Mater. Tehnol., 2020, 54(5), 643–650 Search PubMed.
- J. Tao and X. F. Wang, RSC Adv., 2023, 13(30), 20457–20466 Search PubMed.
- X. Yang, X. F. Wang, Y. F. Huang, X. J. Feng, X. Tian, B. Feng, K. Zhao and W. X. Li, Chin. J. Explos. Propellants, 2017, 40, 73–77 Search PubMed.
- F. Jiang, X. F. Wang, Y. F. Huang, B. Feng, X. Tian, Y. L. Niu and K. Zhang, Def. Technol., 2019, 15(6), 844–852 Search PubMed.
- W. Han, H. Wang, B. Liu, X. Li, H. Tang, Y. Li and H. Liu, Mater. Chem. Phys., 2020, 240, 122287 CrossRef CAS.
- F. Xiao, R. J. Yang and J. M. Li, J. Alloys Compd., 2018, 761, 24–30 CrossRef CAS.
| This journal is © The Royal Society of Chemistry 2024 |


