 Open Access Article
Application of response surface methodology for bioenergy generation in a yeast-based microbial fuel cell
Ceren Orak
Sivas University of Science and Technology, Faculty of Engineering, Department of Chemical Engineering, 58000, Sivas, Turkey. E-mail: crn.orak@gmail.com
First published on 29th October 2024
Abstract
Microbial fuel cells (MFCs) provide a solution to valorise wastewater for energy generation. Wastewater containing oxytetracycline (OTC), an antibiotic, was treated in a yeast-based H-type MFC to obtain bioenergy. The effect of bakery yeast amount, initial OTC concentration, and NaCl concentration in an anodic chamber was investigated and optimum operating conditions were statistically determined via Box–Behnken design. The highest generated power was measured to be 219.3 mW m−2 using 3 g L−1 of bakery yeast, 0.003 M of OTC solution, and 0.006 M of NaCl in the anodic chamber, and experimental data showed a good fit to the model with higher R-sq values. The most important operating parameter was found to be the square of the initial OTC concentration, and this factor, as well as the amount of bakery yeast, has a main effect on the performance of yeast-based MFCs. Almost 70% of TOC removal was achieved under optimum reaction conditions.
1 Introduction
Increasing energy demands have led to a search for sustainable, green, and renewable energy production routes. Consequently, enzymes and microorganism-based biofuel cells (BFCs) have gained great interest owing to their features to convert chemical energy into electrical energy, thus lowering greenhouse-gas emissions.1,2 BFCs utilize renewable substrates, which contribute to their high conversion efficiency. Since most BFCs operate at ambient temperatures, they produce less environmental impact compared to conventional fuel cells, which require high temperatures and release heat during operation.2 Renewable sources could be utilized as substrates to generate electricity in BFCs.1,3,4 Enzymes, widely used as biocatalysts, have some drawbacks, including unsustainability, low resistance, and short lifespan, especially in the presence of pollutants.2,5–10 Conversely, microbes in BFCs are superior because of their versatile catalytic properties, regenerative abilities, low sensitivity to pollutants, and high activity. Microbial fuel cells (MFCs) have been widely used in the treatment of various sources of pollutants, such as antibiotics, heavy metals, dyes and landfill leachate.11–13 In addition to wastewater treatment, MFCs can efficiently be used for electricity generation using various microorganisms.14 Thus, the treatment of wastewater—used as a mediator—and electricity generation in MFCs could be efficiently performed using various aerobic or anaerobic microorganisms. Among them, bakery yeast (Saccharomyces cerevisiae) stands out for its low cost, non-pathogenic nature, easy mass-cultivation, and long-term storage capability.15 In yeast-based MFCs, surface-confined species facilitate electron transfer via yeast adhesion on the electrode surface. However, endogenous mediators play no role in electron transfer, necessitating the use of exogenous mediators such as methylene blue or thionin to enhance performance.16 Various antibiotics (aureomycin, sulfadimidine, roxithromycin, norfloxacin, and sulfamethoxazole) have been treated using MFCs, generating electricity simultaneously.17,18 Oxytetracycline (OTC), widely used in veterinary medicine and agriculture, is present in various water bodies and soils. Residues of OTC have been detected in natural surface waters (up to 200 ppb with 90% detection frequency) and wastewater treatment effluents (0.061–23.6 ppb). It has also been found in vegetable farm soils and livestock at concentrations up to 2.98 mg kg−1. OTC is acutely toxic and poses risks to ecosystems and human health. Due to its limited absorption by animals and humans, it is excreted into the environment. The widespread presence and harmful effects of OTC have driven efforts to find effective methods for its removal.19–21 Therefore; in this study, OTC was selected as an exogenous mediator to generate electricity in yeast-based MFCs. This allows for the simultaneous treatment of model pharmaceutical wastewater and electricity generation. The effective parameters, i.e., bakery yeast amount, initial OTC concentration, and NaCl concentration in the anodic chamber over the energy generation performance of MFCs, were evaluated using the Box–Behnken design model. The main and interaction effects of these parameters were statistically determined.2 Experimental section
2.1 Configuration of biofuel cell
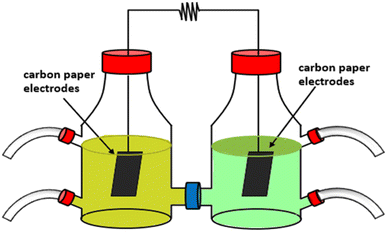
H-type MFC (Fig. 1) had anodic and cathodic chambers made of Pyrex glass with a volume of 500 mL was used and these chambers were separated using a Protonic Exchange Membrane (PEM; Ultrex-CMI 7000). Before starting the experiment, PEM was pre-treated using 5% NaCl solution at about 40 °C for 12 h. In these chambers, carbon paper electrodes (Goodfellow Cambridge Limited, LS366112 SJP Carbon Foil) were used and connected by a copper wire closed with external resistance (1 kΩ). Additionally, before using the carbon paper electrodes (Goodfellow Cambridge Limited LS366112 SJP Carbon Foil) in experiments, they were immersed in pure ethanol for 30 min. Then, the process was repeated using 1 M of HCl solution for 60 min.2.2 Materials
The used chemicals (dextrose, D-glucose, NaCl, HCl, ethanol, di-sodium hydrogen phosphate) were purchased from Sigma-Aldrich. Bakery yeast (Pakmaya, Turkey) and oxytetracycline hydrochloride (OTC) were obtained from a local market and Doğa İlaç, respectively.2.3 Preparation of anode biocatalyst
The anode biocatalyst was prepared using S. cerevisiae (Bakery yeast) based on Raghavulu et al.'s study.22 Bakery yeast was washed three times with saline buffer at room temperature and then, their growth was activated using 1% dextrose solution at around 40 °C. They were kept in dextrose solution for 20 min and, hence, they were resuscitated. Then, the bakery yeast was enriched in OTC – OTC-containing wastewater under anaerobic conditions by mixing at 120 rpm for 48 h.2.4 Experimental study
In a typical experiment, the sodium acetate solution (as an electron donor, % 30 v/v), bakery yeast (i.e., 1 g), D-glucose (as a carbon source, 0.06 M) and OTC (as an electron acceptor, i.e., 0.001 M) solution (V: 300 mL) were quickly introduced into the anodic chamber. Then, the anodic chamber was purged with N2 gas for 15 min to conserve the anaerobic conditions during the experiments. On the other hand, the cathodic chamber was filled with a buffer solution (50 mM and V: 300 mL) prepared using di-sodium hydrogen phosphate and this chamber was continuously aerated. During the experimental study, the effects of the bakery yeast amount, initial OTC concentration, and NaCl concentration in the anodic chamber over generated power were investigated. In this context, a three-factor, three-level Box–Behnken Design (BBD) was applied to understand their main and interaction effects and the factors and their low/high levels are given in Table 1. The experimental data was statistically investigated using Minitab 2018 to clarify the main and interaction effects of selected factors.| Independent variables | Levels | |||
|---|---|---|---|---|
| Uncoded factors | Coded factors | Low | Middle | High |
| Bakery yeast amount [g] | A | 1 | 3 | 5 |
| Initial OTC concentration [M] | B | 0.001 | 0.003 | 0.005 |
| NaCl concentration in the anodic chamber [M] | C | 0 | 0.006 | 0.012 |
2.5 Analyses
The liquid samples obtained at the beginning and end of the experiments were analyzed to determine the removal of total organic carbon (Total Organic Carbon analyzer TOC-L, Shimadzu). The potential measurements were carried out using a reference electrode (Crison 5240 electrode, Ag/AgCl) and the open circuit voltage (OCV) values were recorded using a multimeter (FLUKE, 87). The OCV was continuously recorded throughout the experiments to monitor the voltage produced by the MFC during operation.3 Results and discussion
Bioenergy generation and wastewater treatment were simultaneously achieved in an H-type microbial fuel cell (MFC) using bakery yeast. In this context, the impacts of bakery yeast amount (A), initial OTC concentration (B), and NaCl concentration in the anodic chamber (C) over the generated power (response) were investigated. Their main and interaction impacts were determined by creating an experimental design using Minitab 18 software. The experimental design and results are given in Table 2. The measured power outputs across different experimental conditions ranged from 70 to 219.3 mW m−2. The results show that the optimum operating condition for power generation occurred at 3 g L−1 of bakery yeast, 0.003 M of initial OTC concentration and 0.006 M of NaCl concentration in the anodic chamber, yielding a maximum power density of 219.3 mW m−2. Conversely, very low power (∼8.5 mW m−2) was achieved without adding bakery yeast. Bakery yeast serves as the biocatalyst in the MFC by facilitating electron transfer at the anode. The experiments indicate that the yeast concentration significantly affects power generation. For example, increasing the yeast amount from 1 g L−1 to 3 g L−1 led to an improvement in power output from 100 mW m−2 to 214 mW m−2, under constant conditions for the concentration of OTC (0.003 M). However, a further increase to 5 g L−1 reduced the power to 153.7 mW m−2. These results suggest that excessive yeast loading may cause substrate depletion or electron donor scarcity, which could inhibit biofilm formation and thus decrease the power output. OTC was used as an electron acceptor in this study and the results show that the initial concentration of OTC has a substantial impact on power generation. At 0.003 M OTC concentration, the power density reached its peak (219.3 mW m−2). Lower OTC concentrations (0.001 M) consistently yielded reduced power outputs (70 mW m−2). Conversely, while increasing the OTC concentration to 0.005 M improved power density initially, excessively high OTC levels may introduce toxicity to the yeast, potentially reducing microbial activity and energy conversion efficiency. NaCl plays a critical role as an electrolyte in the anodic chamber, affecting the conductivity and overall internal resistance of the MFC. The results indicate that the intermediate concentration of NaCl (0.006 M) produced the highest power outputs, particularly at optimized levels of yeast and OTC. At higher concentrations (0.012 M), power generation dropped to 70 mW m−2, suggesting an adverse effect from excessive ionic strength, which can increase the osmotic pressure and impede microbial metabolic activity. Similarly, when no NaCl was added, power generation (100 mW m−2) was significantly reduced, likely due to poor conductivity.| Exp. no. | A | B | C | Measured power (mW m−2) |
|---|---|---|---|---|
| 1 | 3 | 0.005 | 0.012 | 120 |
| 2 | 3 | 0.003 | 0.006 | 214 |
| 3 | 3 | 0.003 | 0.006 | 212.3 |
| 4 | 3 | 0.001 | 0.012 | 70 |
| 5 | 5 | 0.001 | 0.006 | 81.7 |
| 6 | 1 | 0.003 | 0.000 | 100 |
| 7 | 3 | 0.003 | 0.006 | 219.3 |
| 8 | 1 | 0.005 | 0.006 | 120 |
| 9 | 5 | 0.005 | 0.006 | 191 |
| 10 | 3 | 0.003 | 0.006 | 210.3 |
| 11 | 3 | 0.001 | 0.000 | 70 |
| 12 | 5 | 0.003 | 0.012 | 153.7 |
| 13 | 1 | 0.001 | 0.006 | 84.7 |
| 14 | 1 | 0.003 | 0.012 | 105 |
| 15 | 5 | 0.003 | 0.000 | 138 |
| 16 | 3 | 0.003 | 0.006 | 205 |
| 17 | 3 | 0.005 | 0.000 | 108 |
The interactions of the reaction parameters, namely, bakery yeast amount, initial OTC concentration, and NaCl concentration in the anodic chamber were determined using a statistical analysis program. Based on the Minitab results, the 2-way interaction terms that are A × B and B × C do not have a significant effect on the generated power, hence, they were eliminated, resulting in a reduced model. The ANOVA table of the reduced model, including regression coefficient and lack-of-fit is given in Table 3. The p-values (α) of all the factors were less than 0.05, indicating significant individual interactions between reaction factors. The R2, R2 (adj.) and R2 (pred.) values of this model were 98.7%, 97.7%, and 89.7%, respectively. Therefore, it could be concluded that the model shows a good fit for experimental values of generated power in MFC during the treatment of OTC-containing wastewater.
| Source | DF | Adj SS | Adj MS | F-Value | P-Value |
|---|---|---|---|---|---|
| Model | 9 | 49![[thin space (1/6-em)]](https://www.rsc.org/images/entities/char_2009.gif) 284.1 284.1 |
5476.0 | 67.99 | 0.000 |
| Linear | 3 | 9890.3 | 3296.8 | 40.93 | 0.000 |
| A | 1 | 2990.2 | 2990.2 | 37.13 | 0.000 |
| B | 1 | 6766.7 | 6766.7 | 84.01 | 0.000 |
| C | 1 | 133.4 | 133.4 | 1.66 | 0.239 |
| Square | 3 | 37![[thin space (1/6-em)]](https://www.rsc.org/images/entities/char_2009.gif) 960.3 960.3 |
12![[thin space (1/6-em)]](https://www.rsc.org/images/entities/char_2009.gif) 653.4 653.4 |
157.10 | 0.000 |
| A × A | 1 | 3878.4 | 3878.4 | 48.15 | 0.000 |
| B × B | 1 | 16![[thin space (1/6-em)]](https://www.rsc.org/images/entities/char_2009.gif) 456.1 456.1 |
16![[thin space (1/6-em)]](https://www.rsc.org/images/entities/char_2009.gif) 456.1 456.1 |
204.32 | 0.000 |
| C × C | 1 | 14![[thin space (1/6-em)]](https://www.rsc.org/images/entities/char_2009.gif) 010.0 010.0 |
14![[thin space (1/6-em)]](https://www.rsc.org/images/entities/char_2009.gif) 010.0 010.0 |
173.94 | 0.000 |
| 2-Way interaction | 3 | 1433.4 | 477.8 | 5.93 | 0.025 |
| A × B | 1 | 1369.0 | 1369.0 | 17.00 | 0.004 |
| A × C | 1 | 28.4 | 28.4 | 0.35 | 0.571 |
| B × C | 1 | 36.0 | 36.0 | 0.45 | 0.525 |
| Error | 7 | 563.8 | 80.5 | ||
| Lack-of-fit | 3 | 454.3 | 151.4 | 5.53 | 0.066 |
| Pure error | 4 | 109.5 | 27.4 | ||
| Total | 16 | 49![[thin space (1/6-em)]](https://www.rsc.org/images/entities/char_2009.gif) 847.9 847.9 |
Based on Table 3, main factors A and B have a significant effect on response along with the quadratic effects AA, BB, CC, and 2-way interaction of A and B, all with a 95% confidence interval, which means that the p-value is lower than 0.05 for each significant factor. In addition, the synergetic effect of AB was observed. Except for these terms, the others did not show any significant effect on the response. In addition, the analysis of the standardized effects plots (Pareto chart) with p = 0.05 supports these findings, as shown in Fig. 2(a). The length of the bars represents the absolute standardized values, with the main factors A and B, the quadratic effects AA, BB, and CC, and the two-way interaction of A and B exceeding the reference line (2.36). Therefore, these terms statistically affect the generated power in MFC with the most significant contribution originating from the BB quadratic effect. The direction and magnitude of effects could be understood from the normal plot. Based on Fig. 2(b), the distribution fit line refers to the effects on the left side of this vertical line having a negative impact on power while the effects on the right side have a positive impact. For instance, the main effect of B has a positive impact while BB has a negative impact. Therefore, only the main effects of A and B, and the 2-way interaction of A and B have a positive impact on power.
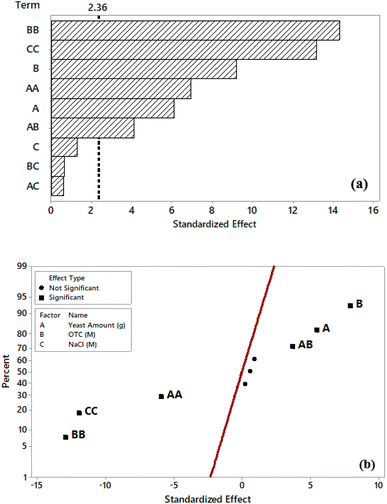 | ||
| Fig. 2 Pareto chart (a) and normal plot of the standardized effects (b) (factors: A: yeast amount, B: initial OTC concentration, C: NaCl concentration in the anodic chamber). | ||
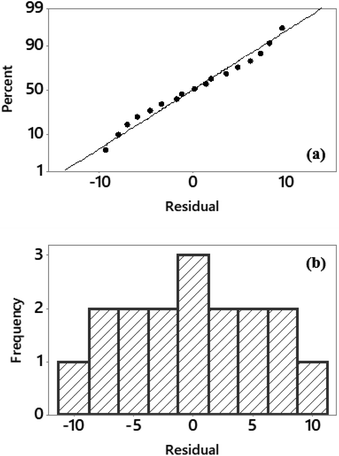
The difference between the adjusted and experimental values provides insight into the goodness-of-fit in regression and ANOVA. The results of the residual analysis are given in Fig. 3. In Fig. 3(a), the normal distribution of residuals is represented by the straight line and the normal probability plot approaches this line. In addition, the symmetry of the residual histograms confirms these findings. The histogram graph is given in Fig. 3(b) and it supports the normal probability distribution shown in Fig. 3(a).
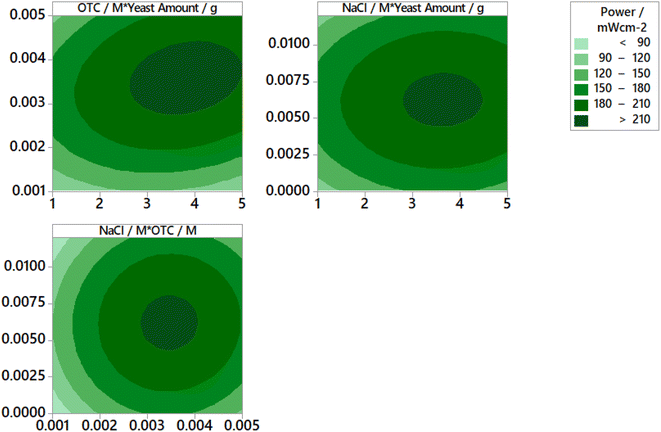
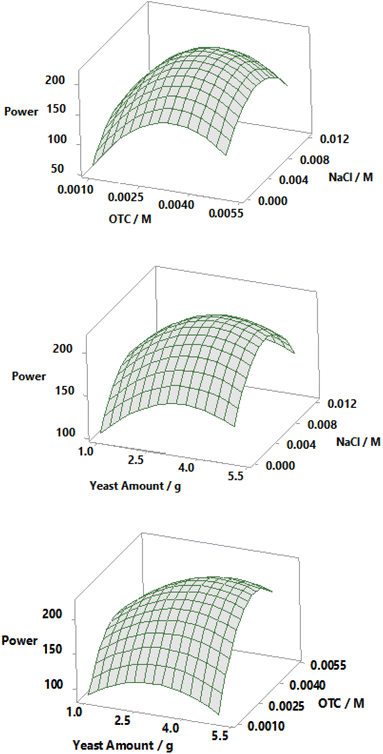
The contour plots for the prediction of power are depicted in Fig. 4. An increase in yeast amount, OTC concentration, and NaCl concentration causes an enhancement in power in the early stages. However, after reaching a maximum power value, the obtained power begins to decrease. Consequently, making an optimization in terms of reaction parameters is very important. Curvatures of a significant magnitude can be seen in Fig. 5. These curves indicate that the correlation between the factors (the yeast amount, initial OTC concentration, NaCl concentration in the anodic chamber) and the response (power) is well-fitted on a quadratic function.
In previous studies, OTC was treated in microbial fuel cells using activated sludge,23 wastewater treatment plant sludge,24 Ochrobactrum sp. strain KSS10.25 Wang et al. achieved 40% total organic carbon (TOC) removal and a power density of 195.36 mW m−2 using anaerobic activated sludge with graphite felt electrodes.23 In another study, using FeCoO/GO composite-coated circular carbon fiber electrodes and wastewater treatment plant sludge achieved a TOC removal efficiency of 44% and power densities ranging from 102.47 to 303.60 mW m−2.24 Shao et al. reported nearly 60% TOC removal using Ochrobactrum sp. strain KSS10.25 This study is the first to use bakery yeast for treating OTC in an MFC. The results showed almost 70% TOC removal and a power density of 219.3 mW m−2 under optimal conditions, demonstrating that bakery yeast is a low-cost and effective option for wastewater treatment and bioenergy generation. The aforementioned studies are summarized in Table 4.
| Microorganism | Electrode material | Pollutant | Power density (mW m−2) | Output voltage (V) | Removal efficiency (%) | Reference |
|---|---|---|---|---|---|---|
| Anaerobic sludge | Graphite felt | OTC | 195.36 | 0.78 | 40% | 23 |
| Wastewater treatment sludge | FeCoO/GO-coated carbon fiber | OTC | 102.47–303.60 | 0.90 | 44% | 24 |
| Ochrobactrum sp. strain KSS10 | Carbon cloth | OTC | Not reported | 0.62 | ∼60% | 25 |
| Bakery yeast (S. cerevisiae) | Carbon paper | OTC | 219.3 | 0.85 | ∼70% | This study |
4 Conclusions
In MFC, an OTC model solution – representing the pharmaceutical wastewater – was used as a mediator to produce energy using bakery yeast enabling simultaneous energy generation and wastewater treatment. To optimize the generated power in MFC, a three-factor, three-level Box–Behnken design was created via the Minitab statistical analysis program. The impacts of bakery yeast's amount, initial OTC concentration and NaCl concentration in an anodic chamber were investigated. The optimum reaction conditions were found to be 3 g L−1 of bakery yeast, 0.003 M of initial OTC concentration and 0.006 M of NaCl concentration. At these reaction conditions, a power density of 219.3 mW m−2 and almost 70% TOC removal were achieved. Therefore, this approach shows promise as a dual-function technology for energy production and environmental remediation. MFCs offer vast potential for treating a wider variety of pharmaceutical and industrial wastewater, including those containing complex organic pollutants such as dyes and other emerging contaminants. Further research could focus on enhancing the efficiency of MFCs by exploring different types of microorganisms that could offer higher electron transfer rates and pollutant degradation capabilities. Additionally, advancements in electrode materials, such as the use of nanomaterials and conductive polymers, could further improve power output and system longevity.Data availability
Available on request.Author contributions
Ceren Orak: The experimental study and report.Conflicts of interest
The author declares that she has no competing interests.Acknowledgements
I would like to thank Assoc. Prof. Dr Gülin Ersöz for her support in carrying out this study.References
- A. Ramanavicius, A. Kausaite and A. Ramanaviciene, Biosens. Bioelectron., 2008, 24, 761–766 CrossRef CAS
.
- J. Rozene, I. Morkvenaite-Vilkonciene, I. Bruzaite, A. Dzedzickis and A. Ramanavicius, Electrochim. Acta, 2021, 373, 137918 CrossRef CAS
.
- V. Krikstolaityte, Y. Oztekin, J. Kuliesius, A. Ramanaviciene, Z. Yazicigil, M. Ersoz, A. Okumus, A. Kausaite-Minkstimiene, Z. Kilic, A. O. Solak, A. Makaraviciute and A. Ramanavicius, Electroanalysis, 2013, 25, 2677–2683 CrossRef CAS
.
- S. Babanova, Y. Hubenova and M. Mitov, J. Biosci. Bioeng., 2011, 112, 379–387 CrossRef CAS
.
- E. Katz, I. Willner and A. B. Kotlyar, J. Electroanal. Chem., 1999, 479, 64–68 CrossRef CAS
.
- T. Chen, S. Calabrese Barton, G. Binyamin, Z. Gao, Y. Zhang, H. H. Kim and A. Heller, J. Am. Chem. Soc., 2001, 123, 8630–8631 Search PubMed
.
- N. Mano, F. Mao and A. Heller, J. Am. Chem. Soc., 2002, 124, 12962–12963 CrossRef CAS
.
- N. Mano, F. Mao and A. Heller, J. Am. Chem. Soc., 2003, 6588–6594 CrossRef CAS PubMed
.
- J. Rozene, I. Morkvenaite-Vilkonciene, I. Bruzaite, A. Zinovicius and A. Ramanavicius, Membranes, 2021, 11, 1–10 CrossRef
.
- C. Santoro, C. Arbizzani, B. Erable and I. Ieropoulos, J. Power Sources, 2017, 356, 225–244 CrossRef CAS
.
- N. Jiang, M. Yan, Q. Li, S. Zheng, Y. Hu, X. Xu, L. Wang, Y. Liu and M. Huang, Bioresour. Technol., 2024, 395, 130378 CrossRef CAS PubMed
.
- L. Chen, L. Jiang, Y. Gao, S. Pan, H. Luan, G. Zhang, L. Xu and M. Wang, Int. J. Hydrogen Energy, 2024, 52, 1081–1091 CrossRef CAS
.
- Y. Li, G. Zhang, D. Liang, X. Wang and H. Guo, Chemosphere, 2024, 349, 140902 CrossRef CAS
.
- F. Davis and S. P. J. Higson, Biosens. Bioelectron., 2007, 22, 1224–1235 CrossRef CAS
.
- E. T. Sayed, N. A. M. Barakat, M. A. Abdelkareem, H. Fouad and N. Nakagawa, Ind. Eng. Chem. Res., 2015, 54, 3116–3122 CrossRef CAS
.
- C. Orak, T. Oğuz and S. Horoz, J. Aust. Ceram. Soc., 2024, 1–11 Search PubMed
.
- Y. Zhou, N. Zhu, W. Guo, Y. Wang, X. Huang, P. Wu, Z. Dang, X. Zhang and J. Xian, J. Environ. Manage., 2018, 217, 565–572 CrossRef CAS PubMed
.
- X.-L. Yang, Q. Wang, T. Li, H. Xu and H.-L. Song, Bioresour. Technol., 2022, 348, 126752 CrossRef CAS
.
- C. Orak and G. Ersöz, J. Adv. Res. Nat. Appl. Sci., 2024, 10, 182–189 Search PubMed
.
- P. Raizada, P. Shandilya, P. Singh and P. Thakur, J. Taibah Univ. Sci., 2017, 11, 689–699 CrossRef
.
- Y. Wang, J. Zhou, W. Bi, J. Qin, G. Wang, Z. Wang, P. Fu and F. Liu, J. Cleaner Prod., 2022, 364, 132572–132582 CrossRef CAS
.
- S. V. Raghavulu, R. K. Goud, P. N. Sarma and S. V. Mohan, Bioresour. Technol., 2011, 102, 2751–2757 CrossRef CAS PubMed
.
- J. Wang, B. Zhou, R. Ge, T. shun Song, J. Yu and J. Xie, RSC Adv., 2018, 8, 28613–28624 RSC
.
- L. Zheng, X. Lin, Y. Liu, H. Li, Y. Sun and C. Li, Sci. Total Environ., 2022, 808, 151873–151884 CrossRef CAS
.
- S. Shao, Y. Hu, J. Cheng and Y. Chen, Chem. Eng. J., 2018, 354, 758–766 CrossRef CAS
.
| This journal is © The Royal Society of Chemistry 2024 |

