
 Open Access Article
 This Open Access Article is licensed under a Creative Commons Attribution-Non Commercial 3.0 Unported Licence
Pyrolysis mechanism and pyrolysis kinetics of yellow wine lees
Kong Ling-Niao *a,
Ge Song-Taoa,
Yuan Yangb and
Feng Feng*c
*a,
Ge Song-Taoa,
Yuan Yangb and
Feng Feng*c
aJianhu Academy, Zhejiang Industry Polytechnic College, Shaoxing 312099, China. E-mail: 491932567@qq.com
bZhejiang Metallurgical Research Institute Co., Ltd, Hangzhou 310011, China
cCollege of Chemical Engineering, Zhejiang University of Technology, Hangzhou 310014, China
First published on 29th May 2024
Abstract
Yellow wine lees, a by-product produced while brewing yellow wine, can be a helpful biomass resource through pyrolysis. However, there have been very few studies on the pyrolysis of yellow wine lees. The kinetics and mechanism of pyrolysis in yellow wine lees were explored through an extensive study of their chemical and elemental composition. The pyrolysis mechanism of yellow wine lees was further studied using thermogravimetric analysis (TGA) from 30 °C to 900 °C. The TG/DTG analysis showed that yellow wine lees thermally decomposed mainly between 121 °C and 500 °C. The maximum decomposition was observed between 218 °C and 326 °C, with a clear peak at 298 °C. Upon analyzing the 3D-FTIR results, the gas phase products at this stage primarily included inorganic molecules like CO2, H2O, and CH4, along with organic compounds such as esters, alcohols, phenols, amines, ethers, aldehydes, ketones, and acids. The Maillard reaction and ketosis decarboxylation primarily occurred in proteins (amino acids) and carbohydrates. The pyrolysis kinetics of yellow wine lees were analyzed utilizing the distributed activation energy model (DAEM). The results of DAEM were simultaneously verified using the Flynn–Wall–Ozawa (FWO) method. The findings indicated that the pyrolysis of yellow wine lees conforms to the assumptions of infinite parallel reactions and activation energy distribution. As the conversion rate increased during pyrolysis, the activation energy of yellow wine lees initially increased to 210–220 kJ mol−1, then stabilized at 190–200 kJ mol−1 and rapidly decreased to approximately 100 kJ mol−1. This study offers a theoretical basis for the application of yellow wine lees using pyrolysis.
Introduction
Fossil energy is essential for human existence, but it faces challenges such as limited availability, non-renewability, and environmental contamination resulting from its use. Therefore, it is crucial to thoroughly examine and develop renewable biomass resources as an alternative to fossil fuels.Yellow wine is one of the three significant brewed wines in China. According to the “2020 National Employment Economic Indicators” issued by the China Liquor Industry Association in 2021, China's yearly production of yellow wine could reach 2.83 million tons in 2020.1 The amount of grain needed to make 2 tons of wine from 1 kg of rice is 1.415 million tons. The yield rate of rice lees is determined by the consumption of grains, which ranges from 20 to 30%.2 Consequently, the production of rice lees can range from 283![[thin space (1/6-em)]](https://www.rsc.org/images/entities/char_2009.gif) 000 to 424500 tons. Yellow wine lees are a by-product generated while brewing yellow wine and can also be considered a useful biomass resource. Yellow wine lees have a high concentration of protein, amino acids, carbohydrates, fat, cellulose, and other substances, making it a valuable resource with extensive applications.3 The applications of yellow wine lees include animal feed,4,5 condiments,6 lees grain biscuits,7–9 cosmetics,10 bacterial cellulose,11 adsorption functional materials,12 and energy materials.13 Energy materials can simultaneously address the strain on fossil energy resources and the ecological harm caused by yellow wine lees waste. Yellow wine lees show potential for efficient utilization, making them a valuable subject of investigation.
000 to 424500 tons. Yellow wine lees are a by-product generated while brewing yellow wine and can also be considered a useful biomass resource. Yellow wine lees have a high concentration of protein, amino acids, carbohydrates, fat, cellulose, and other substances, making it a valuable resource with extensive applications.3 The applications of yellow wine lees include animal feed,4,5 condiments,6 lees grain biscuits,7–9 cosmetics,10 bacterial cellulose,11 adsorption functional materials,12 and energy materials.13 Energy materials can simultaneously address the strain on fossil energy resources and the ecological harm caused by yellow wine lees waste. Yellow wine lees show potential for efficient utilization, making them a valuable subject of investigation.
Pyrolysis technology is a crucial approach to the regeneration and use of biomass.14 Biomass pyrolysis is a thermal process that breaks down biomass into combustible gas, liquid bio-oil, and solid biomass charcoal under completely anaerobic or anoxic conditions.15 Investigating the thermal decomposition mechanism and thermal analysis kinetics of biomass holds substantial importance in biomass utilization and regeneration. However, there have been very few studies on the pyrolysis of yellow wine lees.
Considering the conditions listed above, examining the pyrolysis process and thermal analysis kinetics of yellow wine lees is crucial. A thermogravimetric analyzer (TGA) is frequently used to quantify the reduction in mass of materials at varying temperatures. The resulting mass loss curve, produced from TGA, is used to investigate the apparent kinetics of the pyrolysis process. Branca16 et al. studied the pyrolysis kinetics of dried liquor lees through TGA. Lin17 et al. employed TGA to investigate the co-pyrolysis kinetics of sewage sludge and oil shale. Sait18 et al. compared the apparent kinetics of date palm pyrolysis and combustion using TGA.
Furthermore, it is essential to comprehend the changes in gas phase products during the pyrolysis process to investigate the pyrolysis mechanism. TGA combined with in situ Fourier transform infrared spectroscopy (TG-FTIR) can be used to study the reaction mechanism of materials during pyrolysis and combustion. This technique allows for online identification of the evolution of pyrolysis gas phase products. Mohammed19 et al. utilized TG-FTIR to examine the pyrolysis gas products of heavy fuel oil and vacuum residue. Wei20 et al. investigated the impact of non-lignocellulosic components on the pyrolysis behavior of lees utilizing TG-FTIR. The effect of zinc-containing nanopowder on the catalytic pyrolysis of buckwheat straw was investigated by Tahir21 et al. via TG-FTIR.
This study employed waste yellow wine lees as the raw material. It utilized TGA and TG-FTIR techniques to examine the pyrolysis properties of yellow wine lees at various heating rates. After collecting mass loss data, the activation energy of yellow wine lees at various conversion rates was determined using the corresponding distributed activation energy model (DAEM). The Flyn–Wall–Ozawa (FWO) method was utilized to verify the results, and a pyrolysis kinetic model of yellow wine lees was established to provide a theoretical framework for the successful application of yellow wine lees by pyrolysis.
Raw material
The experiment employed fresh lees obtained from a yellow wine winery in Shaoxing and solid lees dehydrated using distillation and a belt drier. First, the solid lees were dried in an oven for 8 h at 110 °C, then pulverized with a pulverizer, sieved through a 200-mesh sieve, and sealed in a desiccator for storage, as illustrated in Fig. 1.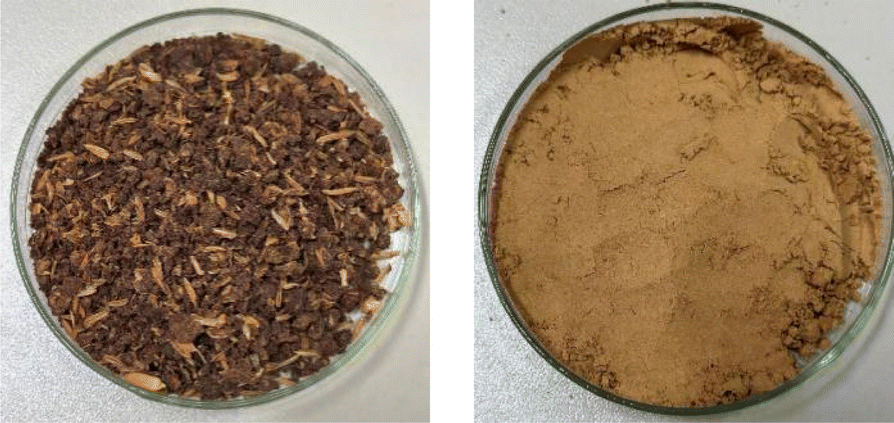 | ||
| Fig. 1 Yellow wine lees samples before and after crushing. | ||
Yellow wine lees were analyzed for their ash, protein, crude fiber, starch, and amino acid contents following the national standards GB 5009.4-2016, GB 5009.5-2016, GB/T 5009.10-2013, GB 5009.9-2016, and GB 5009.124-2016. The samples' C, H, N, and S contents were determined using a Flash 2000 organic elemental analyzer manufactured in the US by Thermo Fisher Scientific (Table 1). In contrast to Baijiu lees and general biomass ethanol residue lees,22,23 yellow wine lees contain a comparatively low ash content (1.0%) and crude fiber content (8.8%), according to the findings. The most notable change was in the protein and amino acid content of yellow wine lees, which reached 51.0% with a starch content of 24.5%.
Experimental methods
TGA of yellow winelees
The Al2O3 test crucible was utilized to determine the TGA curve with the NETZSCH TG 209F1 Libra. The crushed sample had a mass of approximately 4.2–5.2 mg and was heated at rates of 10, 20, 30, and 40 °C min−1. Eventually, the temperature reached 900 °C, with a nitrogen flow rate of 50 mL min−1.TG-FTIR analysis of yellow wine lees
Yellow wine lees were subjected to a TG-FTIR simultaneous analysis experiment employing a TGA and an FTIR spectrometer (NETZSCH Perseus STA 449 F3 Jupiter). Sample parameters were temperature (25 °C to 900 °C), heating rate (10 °C min−1), protective gas (nitrogen) addition, and carrier gas flow rate (50 mL min−1).Kinetic analysis
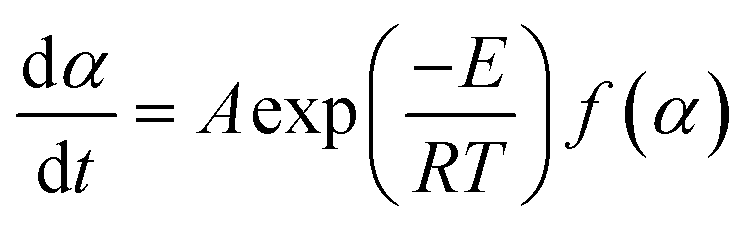
 | (1) |
The distribution function of activation energy, denoted as g(E), is presumed to follow Gaussian distribution. Eqn (2) represents the correlation between the standard deviation σ and the average activation energy E0.25
 | (2) |
Eqn (3) represents the dynamic form obtained by substituting eqn (2) for eqn (1) and simplifying the result via the Miura integration approach:26
 | (3) |
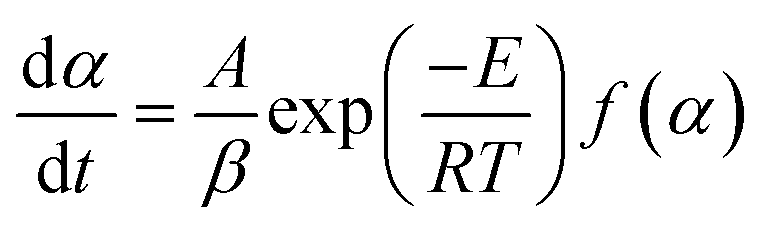
The present investigation employed the Arrhenius equation to calculate the activation energy (E), with heating rates (β) of 10, 20, 30, and 40 K min−1. The value of E was determined by dividing the slope of the fitted curve by the universal gas constant (R) after plotting ln(β/T2) versus 1/T at the same conversion rate.
 | (4) |
 | (5) |
 | (6) |
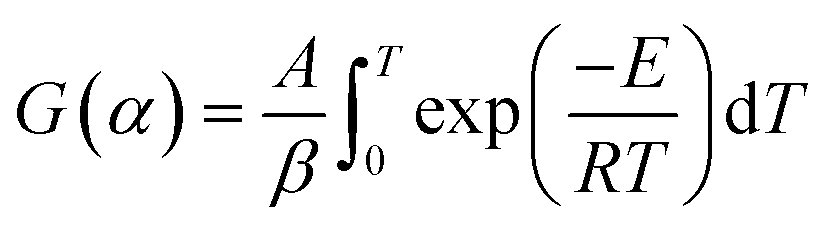
Eqn (7) is obtained by integrating eqn (6):
 | (7) |
After the FWO approach simplifies eqn (7), the kinetic equation is given as follows:27,28
 | (8) |
Similarly, ln(β) was plotted versus 1/T at the identical conversion rate with heating rates (β) of 10, 20, 30, and 40 °C min−1. The activation energy (E) was calculated by determining the slope of the fitted curve as 0.4567E/R.
Results and analyses
TGA of yellow wine lees
The TGA and DTG curves of the yellow wine lees pyrolysis were used as an example for analysis. The temperature range was 30 to 900 °C, and the heating rate was 10 °C min−1. The findings are illustrated in Fig. 1. The overall mass loss during the pyrolysis of yellow winelees was around 84.65%, as displayed in Fig. 2. The pyrolysis process is categorized into three stages based on the rate at which mass is lost: 30–121 °C, 121–500 °C, and 500–900 °C. As depicted in Fig. 2 of the DTG curve, the initial stage is drying, followed by the rapid degradation stage, which consists of three sub-stages, and finally, the gradual degradation stage.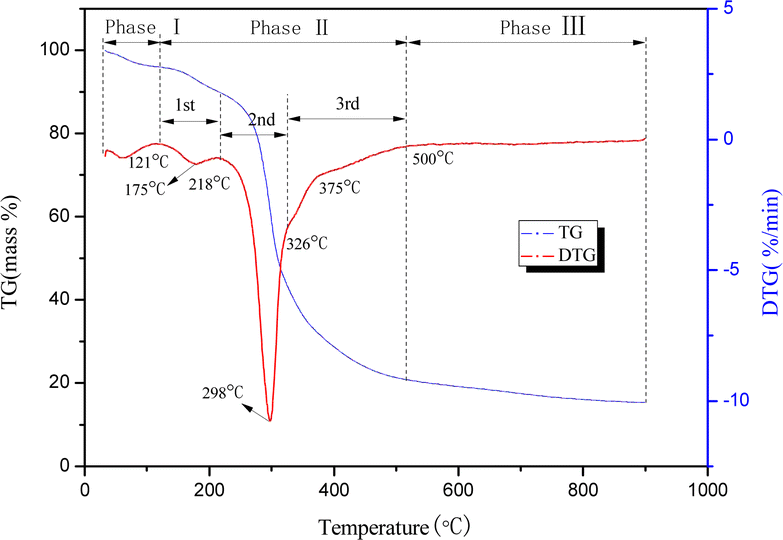 | ||
| Fig. 2 TG/DTG curve of yellow wine lees at a 10 °C min−1 heating rate. | ||
The initial weight loss peak of the DTG curve corresponded to the temperature range of 30–121 °C during the first stage. This stage primarily involves the evaporation of excess moisture in yellow wine lees.29 Due to the initial drying pretreatment of the sample, there was a minimal weight loss of only 3.95%.
The second stage, which involves three sub-stages, had a temperature range of 121–500 °C and a weight loss of 75.20%. In the first substage, the temperature varied between 121 and 218 °C, with a small pyrolysis peak at 175 °C. The weight loss during this stage can be attributed to several factors. The primary source of this occurrence is the evaporation of volatile organic compounds and the crystal water present in cellulose, hemicellulose, and lignin molecules.30 Additionally, it results from dehydration, decomposition, and the decomposition of unstable short chains.31–33
Additionally, it pertains to the decarboxylation reaction between amino acids and proteins.34 During the second sub-stage, the temperature varied between 218 and 326 °C, with a maximum pyrolysis peak at 298 °C. This value is comparable to the maximum pyrolysis peak of protein measured by Sibilla et al.,35 the weight loss was about 41.68% due to protein, cellulose, and starch, which have degradation temperatures ranging from 217 to 450 °C, 290 to 368 °C, and 246.6 to 366.5 °C, respectively, according to previous research.34,36 The temperature range of the third sub-stage was between 326 and 500 °C. This stage primarily involves the thermal decomposition of lignin and fat, which occurs within the temperature range of 356.2 to 423.5 °C.34 The initial and subsequent reactions occurred at temperatures ranging from 326 to 375 °C and 375 to 500 °C, respectively.
During the third stage, the temperature range was 500–900 °C, and the yellow wine lees experienced a mass loss of 5.5%. The primary reason is that the solid result contains residual organic macromolecules that continue to undergo subsequent pyrolysis processes. At elevated temperatures, the carbon–carbon atoms held in place undergo spatial rearrangements and interact with the gas products produced by pyrolysis. This leads to numerous mesopores and micropores forming within the solid product of pyrolysis, increasing specific surface area.
TG-FTIR analysis of yellow wine lees
With a temperature range of 30 to 900 °C and a 10 °C min−1 heating rate, the 3D infrared spectrum of pyrolysis of yellow wine lees is displayed in Fig. 3. The pyrolysis and volatilization of yellow wine lees predominantly took place between the temperature range of 121 to 500 °C (Fig. 3). A close correlation can be seen between the appearance of the absorption peak and the weight loss that was discovered in the DTG curve that is depicted in Fig. 2. Under the conditions described above, every volatile component displays distinct infrared absorption peaks at 298 °C, the highest mass loss rate (Fig. 4). Fig. 4 shows that the volatile components have eight distinct infrared absorption bands at 650–750, 1000–1200, 1600–1900, 2000–2250, 2250–2400, 2700–3100, and 3400–3800 cm−1. Table 2 presents the findings of an analysis of the material composition of the volatile components using the functional groups associated with each characteristic absorption band.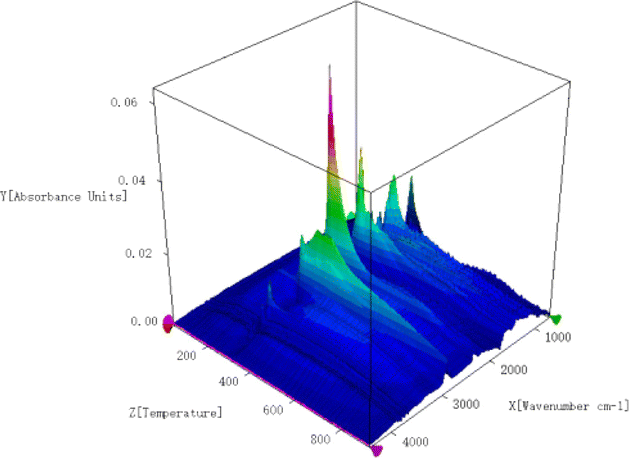 | ||
| Fig. 3 3D infrared spectrum of pyrolysis of yellow wine lees at a 10 °C min−1 heating rate. | ||
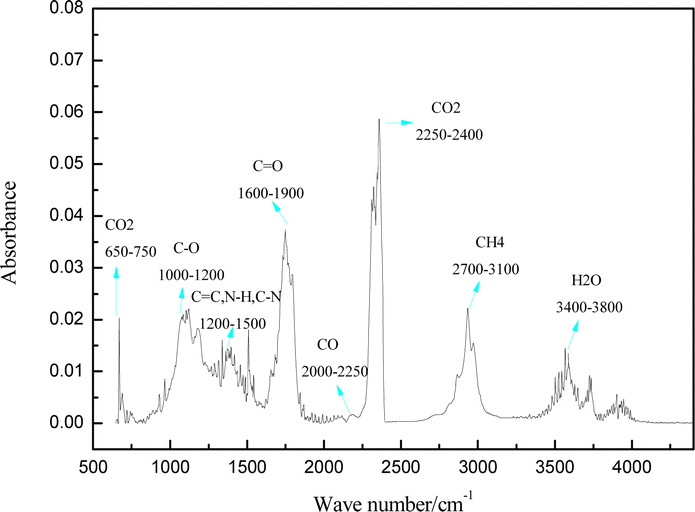 | ||
| Fig. 4 Characteristic infrared absorption peaks of each volatile component at 298 °C. | ||
| Functional groups | Wavenumbers range (cm−1) | Species | Ref. |
|---|---|---|---|
C![[double bond, length as m-dash]](https://www.rsc.org/images/entities/char_e001.gif) O O |
650–750 | CO2 | 40 and 41 |
| C–O | 1000–1200 | Alcohols, phenols, ethers, esters | 32, 42 and 43 |
| CC, N–H, C–N, C–C, C–H (benzene skeleton) |
1200–1500 | Aromatics, amide II, alkanes | 44 |
| CO |
1600–1900 | Aldehydes, ketones, organic acids | 45 |
| C–O | 2000–2250 | CO | 40 and 41 |
| CO |
2250–2400 | CO2 | 40 and 41 |
| C–H | 2700–3100 | CH4 | 46 |
| O–H | 3400–3800 | H2O, phenols, aliphatic alcohol | 34 |
The volatile components of yellow wine grains after pyrolysis consist primarily of inorganic compounds (CO, CO2, H2O, CH4) and organic compounds (esters, alcohols, phenols, amines, ethers, aldehydes, ketones, and acids), as indicated in Table 2. The detected frequencies of 670 and 2360 cm−1 correspond to the bending and stretching vibrations of the CO bond, respectively. The vibrations are mainly a result of the breaking of the carbonyl group (–CO) and the removal of the carboxyl group (–COOH) to produce CO2. The stretching vibration of the C–O bond in the 1000–1200 cm−1 range was primarily associated with alcohol, phenol, ether, and ester compounds produced during the pyrolysis of hemicellulose, starch, fat, and lignin. The CC bond stretching vibrations at 1200–1500 cm−1 are primarily caused by aromatic compounds in the pyrolysis products.
On the other hand, the N–H and C–N bond stretching vibrations in yellow wine lees are primarily caused by reactions between proteins and reducing sugars. The reactions involved include Maillard translation, deamination, dehydration, decarboxylation, and the formation of amides by the pyrolysis of cellulose, hemicellulose, and lignin.36–39 The C–C and C–H stretching vibrations in this distinctive absorption band are primarily associated with the alkanes produced by the pyrolysis of lignin, hemicellulose, and fat.44 The stretching vibration at 1745 cm−1 corresponds to the CO bond. This vibration is predominantly generated through the pyrolysis of cellulose and lignin in the sample, which yields ketone and aldehyde compounds in addition to organic acid compounds generated during protein pyrolysis.45 2175 cm−1 is the stretching vibration of the C–O bond, primarily generated when the C–O–C and CO bonds are cleaved and deoxygenated, forming CO.40,41 The peak at 2937 cm−1 corresponds to the C–H bond's stretching vibration, indicating that the material composition is primarily CH4. This is mainly associated with the random scission of aliphatic side chains, a degradation of CC and methoxy (–OCH3) functional groups.40 The thermal degradation process predominantly leads to water production through mechanisms such as the cross-linking reaction of cellulose and lignin, the extraction of free water in yellow wine lees, and the dehydration and condensation of proteins.
Fig. 5 depicts the variation in absorption intensity of volatile components as a function of temperature, with a 10 °C min−1 heating rate and a temperature range between 30 and 900 °C. As per Lambert–Beer's law, a linear relationship existed between relative volatile component concentration and the absorption intensity at a given wave number. Consequently, the absorption intensity of volatile components throughout the pyrolysis process can be utilized to determine the relative content of volatiles. Fig. 5 demonstrates a clear correlation between the variation of absorption peaks of volatile components and the mass loss observed in the DTG curve. Most volatile components displayed absorption peaks primarily during the second stage, ranging from 121 to 500 °C. The temperature at which its maximum absorption peak appeared corresponds to the position of the maximum pyrolysis peak of DTG, which primarily consists of volatile components, including CO2, H2O, aldehydes, ketones, acids, alcohols, and aromatic compounds. During the second phase of pyrolysis, CO2 exhibited two absorption peaks. The initial absorption peak was observed at 121–218 °C, followed by another at 220–500 °C. The initial absorption peak is mainly attributed to the decarboxylation of carbohydrates and proteins.
 | ||
| Fig. 5 Infrared absorption intensity of yellow wine lees at various temperatures with a 10 °C min−1 heating rate. | ||
In contrast, the second peak is primarily ascribed to the transesterification of fats and the deoxygenation of oxygen-containing groups at high temperatures.47,48 CH4 showed three absorption peaks in the second stage of pyrolysis, corresponding to the 121–218 °C, 218–325 °C, and 325–500 °C stages of the DTG curve. The absorption peaks observed within the temperature ranges of 121–218 °C and 218–325 °C primarily result from the thermal decomposition of cellulose, lignin, and protein alkyl side chains. The absorption peak observed between 325 and 500 °C is attributed mainly to the profound degradation and rearrangement reactions of other biomass and the cleavage of the methoxy group (–OCH3) on the aromatic ring of lignin.49–51 As mentioned above, the analysis revealed that the pyrolysis reaction of yellow wine lees involved the Maillard reaction and ketosis decarboxylation reactions of proteins (amino acids) and carbohydrates.
Influence of heating rate on the pyrolysis process of yellow wine lees
The heating rate substantially affects the pyrolysis behavior of lees, as demonstrated by the TG/DTG curves of yellow wine grains at various heating rates in Fig. 6. Consistent with the findings of numerous researchers, the pyrolysis peak of lees shifted to a higher temperature as the heating rate increased, and the maximal mass loss peak temperature was increased from 298 °C to 318 °C.52–55 This could be because the internally generated volatile components have not yet evaporated. On the other hand, the externally produced volatile components from pyrolysis reacted with the surface coke to form tar, leading to surface coking, restricted heat transfer, and increased temperature gradient within the lees. As a result, phenomena such as the broadening of the DTG peak shape and the elevation of the pyrolysis temperature associated with the maximal weight loss peak were observed. Moreover, the weight loss rate at a given temperature point and the maximum rate of weight loss through pyrolysis increased in response to an increase in the heating rate; this finding is in agreement with the pyrolysis results of lees reported by Wang56 et al., this is because the increased heat conduction between the sample and the reactor, which is induced by the accelerated heating rate, causes the interior of the lees to reach the maximum pyrolysis temperature more quickly when the pyrolysis process begins; volatile components precipitate rapidly, which in turn increases the rate at which weight is lost.57,58 | ||
| Fig. 6 TG/DTG curves of yellow wine lees with various heating rates (10, 20, 30, and 40 °C min−1). | ||
Analysis of pyrolysis kinetics of yellow wine lees
The apparent activation energies at various conversions were found using the DAEM and FWO plots to pyrolyze yellow wine lees. Fig. 7 and 8 depict the Arrhenius linear fitting diagrams for the DAEM kinetic model and the FWO model-free integration approach applied to yellow wine lees. The Fig. 7(a) and 8(a), 7(b) and 8(b) and 7(c) and 8(c) had conversion rates of 0.02–0.18, 0.20–0.55 and 0.60–0.80, respectively. For most conversions, the regression coefficients were high (>0.95) and qualified as a satisfactory fit for assessing apparent activation energy using various techniques. This also results in a rather stable and reliable activation energy value. Fig. 8 shows that both the FWO and the DAEM models produce nearly identical curve-fitting degrees, supporting the idea that the calculated activation energy value is accurate. | ||
| Fig. 7 Linear fitting of DAEM model of yellow wine lees under different conversion rates (a–c). | ||
 | ||
| Fig. 8 Linear fitting of FWO model of yellow wine lees under different conversion rates (a–c). | ||
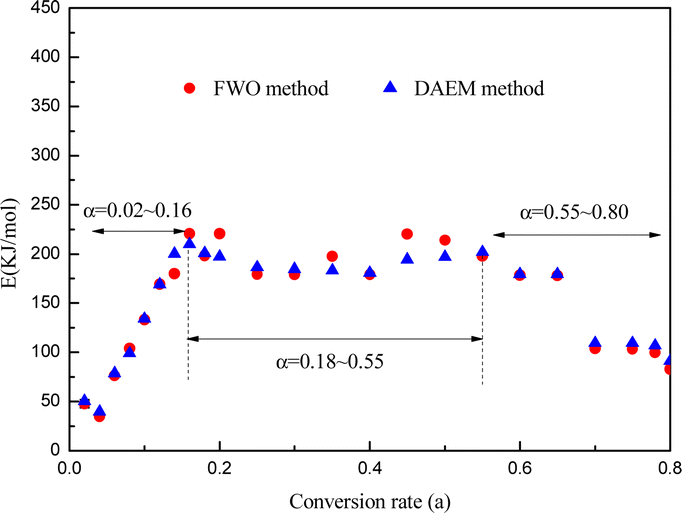
The activation energies were determined for various conversion rates (as indicated in Fig. 9 and Table 3). The DAEM and FWO models calculated the activation energies were 35–220 and 40–210 kJ mol−1, respectively. The two strategies yield nearly identical calculation results. Thus, the yellow wine lees pyrolysis law is highly reliable and complies with the DAEM hypothesis mechanism of infinite parallel reactions and activation energy distribution. As depicted in the figure, the activation energy value of yellow wine lees increased initially, stabilized, and then declined as the conversion rate increased.
 | ||
| Fig. 9 Activation energy and conversion rate diagram of yellow wine lees. | ||
| Conversion rate, % | E (kJ mol−1) | LnA (min−1) |
R2 |
|---|---|---|---|
| 0.02 | 47.55 | 7.00 | 0.99 |
| 0.04 | 34.89 | 6.68 | 0.98 |
| 0.06 | 76.04 | 17.14 | 0.96 |
| 0.08 | 104.08 | 23.68 | 0.98 |
| 0.10 | 133.23 | 29.22 | 0.97 |
| 0.12 | 169.26 | 35.37 | 0.94 |
| 0.14 | 179.84 | 36.47 | 0.99 |
| 0.16 | 220.84 | 44.37 | 0.98 |
| 0.18 | 198.08 | 38.95 | 0.94 |
| 0.20 | 220.64 | 41.69 | 0.98 |
| 0.25 | 179.34 | 33.87 | 0.99 |
| 0.30 | 179.23 | 32.71 | 0.99 |
| 0.35 | 197.66 | 35.75 | 0.94 |
| 0.40 | 179.07 | 31.24 | 0.99 |
| 0.45 | 220.15 | 37.41 | 0.98 |
| 0.50 | 214.05 | 35.21 | 0.98 |
| 0.55 | 197.90 | 28.15 | 0.93 |
| 0.60 | 178.44 | 36.11 | 0.98 |
| 0.65 | 178.11 | 33.40 | 0.98 |
| 0.70 | 103.91 | 21.49 | 0.98 |
| 0.75 | 103.20 | 20.23 | 1.00 |
| 0.78 | 99.80 | 19.04 | 0.90 |
| 0.80 | 82.95 | 12.71 | 0.97 |
The conversion rate of lees in the initial region was 0.02 ≤ α ≤ 0.16, while the corresponding temperature ranged from 65 to 264 °C. At α = 0.04, the yellow wine lees exhibited a low activation energy of 35–40 kJ mol−1 and a temperature of 119 °C. This is consistent with the first weight loss peak observed in TGA, primarily due to free moisture vaporization in the lees. The activation energy increased substantially, reaching 210–220 kJ mol−1 at α = 0.16. The main reason is that lower activation energies are produced when hemicellulose is thermally degraded because weakly connected spots in the linear chains of hemicellulose polymers are easily reached. The linear chain then experiences random rupture following the weak link breaking, raising the activation energy.59 The substantial variation in apparent activation energy at this point showed the presence of a multi-step decomposition mechanism.19 The temperature in the second region ranged from 270 to 320 °C, and the conversion rate for the yellow wine lees was between 0.18 and 0.55, inclusive. At this stage, the primary substances undergoing pyrolysis are protein and cellulose. In the present study, the activation energy remains consistently around 190 to 200 kJ mol−1, indicating that this process follows a single-step breakdown mechanism.19 The activation energy gradually dropped to approximately 180 kJ mol−1 when α = 0.60–0.65. However, the activation energy decreased to approximately 100 kJ mol−1 at α = 0.70–0.80. This might be because macromolecular compounds, including cellulose, hemicellulose, lignin, starch, and protein, produce active substances, including –OCH3, during the initial stage of pyrolysis, facilitating subsequent stages. These findings are in agreement with the TG-FTIR analysis.
Conclusions
Yellow wine lees, the primary organic waste generated during the Chinese yellow wine brewing process, are a significant renewable resource capable of substituting fossil fuels for bioenergy production. Pyrolysis is a viable conversion method for yellow wine lees. It can efficiently utilize lees to produce valuable biofuels. This work investigated the pyrolysis process of yellow wine lees using TG/DTG, TG-FTIR, DAEM, and FWO kinetic model approaches. First, the elemental and chemical composition studies showed that the main components of yellow wine grains include lipids, crude fiber, protein, starch, and amino acids.Further, it possesses a small amount of ash and a significant concentration of protein and amino acids, making it a beneficial primary substance for producing biochar, particularly nitrogen-doped carbon compounds. Subsequently, the process of decomposing yellow wine lees using pyrolysis is divided into three distinct stages. The main pyrolysis stage for yellow wine lees was 121–500 °C, with a maximal pyrolysis rate of 298 °C. The Maillard reaction and ketosis-decarboxylation reaction mainly occurred at this stage. The volatile components after pyrolysis include inorganic molecules such as CO2, H2O, and CH4 and organic compounds such as esters, alcohols, phenols, amines, ethers, aldehydes, ketones, and acids. Finally, the pyrolysis kinetics of yellow wine lees were simulated utilizing the DAEM and FWO models. The findings indicated that the pyrolysis of yellow wine lees conforms to the assumptions of infinite parallel reactions and activation energy distribution. The kinetic mechanism identified in this work can serve as a theoretical base for the subsequent design and advancement of the pyrolysis process of yellow wine lees.
However, further studies are needed to explore further aspects of the pyrolysis process of yellow wine lees. The effect of pyrolysis conditions and the concentration of proteins and amino acids in the raw materials on the surface morphology of biochar is currently not understood. Moreover, it is imperative to advance the understanding of the creation mechanism of specific volatile compounds.
Author contributions
Kong Ling-Niao: investigation, data curation, and writing-original draft. Ge Song-Tao: resources and visualization. Yuan Yang: project administration and funding acquisition. Feng Feng: conceptualization and writing-review and editing.Conflicts of interest
There are no conflicts to declare.Acknowledgements
This work was supported financially by the Scientific Research Fund of Zhejiang Provincial Education Department (Y202249518) and Hangzhou Iron & Steel Group Co., Ltd. Facilities in Shiyanjia Lab (http://www.shiyanjia.com) were used in this work.References
- J. Song, A breakthrough in the decline of traditional industries, Financial Times, 2021,(9), 12–13 CAS.
- M. Shao, J. L. Wang and Y. Zhang, et al., Development and utilization of abandoned yellow wine lees, China Brew., 2011, 30(9), 15–18 Search PubMed.
- S. Li, H. X. Chen and Y. H. Zhou, et al., Research progress on utilization technology of yellow rice wine lees, China Brew., 2023, 42(8), 1–6 Search PubMed.
- Z. R. Li, X. Z. Chen and H. L. Qiu, et al., Effects of Monascus distiller's grains on performance and egg quality of laying hens, Fujian J. Agric. Sci., 2021, 36(3), 319–325 Search PubMed.
- Y. Hu, L. Pan and Y. Dun, et al., Conversion of yellow wine lees into high protein yeast culture by solid-state fermentation, Biotechnol. Biotechnol. Equip., 2014, 28(5), 843–849 CrossRef CAS PubMed.
- J. Z. Wan, Y. W. Leng and G. J. Wu, et al., Study on comprehensive utilization of yellow wine lees to produce vinegar, China Brew., 2016, 35(1), 170–173 CAS.
- Y. Q. Fang and B. Ni, Development of yellow wine lees biscuit, Liquor-Making Science & Technology, 2017,(11), 109–112 Search PubMed.
- Y. L. Gao, H. J. Chen and Y. Sun, Development of cookies with yellow wine lees, Guide to Food Safety, 2017,(7), 102–103 Search PubMed.
- Q. Liang, Z. P. Yin and Y. Jiang, Development and quality analysis of tough biscuit made from wine grains of gorgon fruit, Cereals Oils, 2017, 42(3), 155–161 Search PubMed.
- S. H. Xu, H. B. Liu and C. L. He, et al., Determination of Total Amino Acids, Total Polyphenols, Polysaccharide Content and Antioxidant Activity of Distiller's Grains, Chem. Reagent, 2022, 44(1), 32–38 CAS.
- Y. Y. Chen, Z. F. Lu and R. G. Lu, et al., Study on fermentation technology of bacterial cellulose from yellow wine lees, J. Cellul. Sci. Technol., 2021, 29(1), 25–31 CAS.
- Q. Wang, L. Liang and F. Xi, et al., Adsorption of azo dye acid red 73 onto rice wine lees: adsorption kinetics and isotherms, Adv. Mater. Sci. Eng., 2020, 2020, 1–8 Search PubMed.
- D. Wu, J. Cheng and T. Wang, et al., A novel porous N- and S-self-doped carbon derived from Chinese rice wine lees as high-performance electrode materials in a supercapacitor, ACS Sustainable Chem. Eng., 2019, 7(14), 12138–12147 CAS.
- L. Ma, T. Wang and Q. Liu, et al., A review of thermal-chemical conversion of lignocellulosic biomass in China, Biotechnol. Adv., 2012, 30(4), 859–873 CrossRef CAS PubMed.
- X. J. Li, J. M. Chang and D. B. Fan, Prospect and technical status of fast pyrolysis of biomass, Forestry Machinery and Woodworking Equipment, 2009, 37(01), 7–9 Search PubMed.
- C. Branca and C. Di Blasi, Thermal Devolatilization Kinetics of Dry Distiller's Grains with Solubles (DDGS), Processes, 2021, 9, 1907–1916 CrossRef CAS.
- Y. Lin, Y. Liao and Z. Yu, et al., Co-pyrolysis kinetics of sewage sludge and oil shale thermal decomposition using TGA-FTIR analysis, Energy Convers. Manage., 2016, 118, 345–352 CrossRef CAS.
- H. H. Sait, A. Hussain, A. A. Salema and F. N. Ani, Pyrolysis and combustion kinetics of date palm biomass using thermogravimetric analysis, Bioresour. Technol., 2012, 118, 382–389 CrossRef CAS PubMed.
- M. AlAbbad, R. Gautam and E. G. Romero, et al., TG-DSC and TG-FTIR analysis of heavy fuel oil and vacuum residual oil pyrolysis and combustion: characterization, kinetics, and evolved gas analysis, J. Therm. Anal. Calorim., 2023, 148, 1875–1898 CrossRef CAS.
- Q. Wei, Y. Wei and X. Qing, et al., Comprehensive research on the influence of non-lignocellulosic components on the pyrolysis behavior of Chinese distiller's grain, ACS Sustain. Chem. Eng., 2020, 8(8), 3103–3113 CrossRef.
- M. H. Tahir, X. Cheng and R. M. Irfan, et al., Comparative chemical analysis of pyrolyzed bio oil using online TGA-FTIR and GC-MS, J. Anal. Appl. Pyrolysis, 2020, 150, 104890 CrossRef CAS.
- X. J. Wang, N. Ullah and X. C. Sun, et al., Development and characterization of bacterial cellulose reinforced biocomposite films based on protein from buckwheat distiller's dried grains, Int. J. Biol. Macromol., 2017, 96, 353–360 CrossRef CAS PubMed.
- Y. Kim, N. S. Mosier and R. Hendrickson, et al., Composition of corn dry-grind ethanol by-products: DDGS, wet cake, and thin stillage, Bioresour. Technol., 2008, 99, 5165–5176 CrossRef CAS PubMed.
- A. K. Burnham and R. L. Braun, Global kinetic analysis of complex materials, Energy Fuels, 1999, 13(1), 1–22 CrossRef CAS.
- J. Z. Zhang, T. J. Chen and J. L. Wua, et al., A novel Gaussian-DAEM-reaction model for the pyrolysis of cellulose, hemicellulose and lignin, RSC Adv., 2014, 4(34), 17513–17520 RSC.
- J. M. Cai, T. Li and R. H. Liu, A critical study of the Miura-Maki integral method for the estimation of the kinetic parameters of the distributed activation energy model, Bioresour. Technol., 2011, 102(4), 3894–3899 CrossRef CAS PubMed.
- J. H. Flynn and L. A. Wall, A quick direct method for determination of activation energy from thermogravimetric data, J. Polym. Sci., Part B: Polym. Lett., 1966, 4(5), 323 CrossRef CAS.
- T. Ozawa, A new method of analyzing thermogravimetric data, Bull. Chem. Soc. Jpn., 1965, 38(11), 1881 CrossRef CAS.
- H. Yang, R. Yan and H. Chen, et al., Characteristics of hemicellulose, cellulose and lignin pyrolysis, Fuel, 2007, 86(12–13), 1781–1788 CrossRef CAS.
- E. Arslanolu, M. A. Eren and H. Arslanolu, et al., Fabrication, characterization, and adsorption applications of low-cost hybride activated carbons from peanut shell-vinasse mixtures by one-step pyrolysis, Biomass Convers. Biorefin., 2021, 1–15 Search PubMed.
- V. Pasangulapati, K. D. Ramachandriya and A. Kumar, et al., Effects of cellulose, hemicellulose and lignin on thermochemical conversion characteristics of the selected biomass, Bioresour. Technol., 2012, 114, 663–669 CrossRef CAS PubMed.
- J. Xiong, Q. Li and Z. Shi, et al., Interactions between wheat starch and cellulose derivatives in short-term retrogradation: rheology and FTIR study, Food Res. Int., 2017, 100, 858–863 CrossRef CAS PubMed.
- S. Wang, B. Ru and H. Lin, et al., Pyrolysis behaviors of four O-acetyl-preserved hemicelluloses isolated from hardwoods and softwoods, Fuel, 2015, 150, 243–251 CrossRef CAS.
- P. J. Zong, Y. Jiang and Y. Y. Tian, et al., Pyrolysis behavior and product distributions of biomass six group components: starch, cellulose, hemicellulose, lignin, protein and oil, Energy Convers. Manage., 2020, 216, 112777–112791 CrossRef CAS.
- S. Orsini, F. Parlanti and I. Bonaduce, Analytical pyrolysis of proteins in samples from artistic and archaeological objects, J. Anal. Appl. Pyrolysis, 2017, 124, 643–657 CrossRef CAS.
- X. Wang, L. L. Sheng and X. Y. Yang, Pyrolysis characteristics and pathways of protein, lipid and carbohydrate isolated from microalgae Nannochloropsis sp., Bioresour. Technol., 2017, 229, 119–125 CrossRef CAS PubMed.
- J. Giuntoli, J. Gout and A. H. M. Verkooijen, et al., Characterization of Fast Pyrolysis of Dry Distiller's Grains (DDGS) and Palm Kernel Cake Using a Heated Foil Reactor: Nitrogen Chemistry and Basic Reactor Modeling, Ind. Eng. Chem. Res., 2011, 50(8), 4286–4300 CrossRef CAS.
- Z. Movasaghi, S. Rehman and D. I. ur Rehman, Fourier Transform Infrared (FTIR) Spectroscopy of Biological Tissues, Appl. Spectrosc. Rev., 2008, 43(2), 134–179 CrossRef CAS.
- C. Zhang, X. Tang and L. Sheng, et al., Enhancing the performance of Co-hydrothermal liquefaction for mixed algae strains by the Maillard reaction, Green Chem., 2016, 18(8), 2542–2553 RSC.
- X. Yang, Y. Zhao and R. Li, et al., A modified kinetic analysis method of cellulose pyrolysis based on TG-FTIR technique, Thermochim. Acta, 2018, 665, 20–27 CrossRef CAS.
- Z. Zhang, M. Zhu and D. Zhang, A thermogravimetric study of the characteristics of pyrolysis of cellulose isolated from selected biomass, Appl. Energy, 2018, 2020, 87–93 CrossRef.
- S. Wang, B. Ru, H. Lin and W. Sun, Pyrolysis behaviors of four O-acetyl-preserved hemicelluloses isolated from hardwoods and softwoods, Fuel, 2015, 150, 243–251 CrossRef CAS.
- Y. Fan, Y. Cai and X. Li, et al., Effects of the cellulose, xylan and lignin constituents on biomass pyrolysis characteristics and bio-oil composition using the Simplex Lattice Mixture Design method, Energy Convers. Manage., 2017, 138, 106–118 CrossRef CAS.
- F. Li, S. C. Srivatsa and W. Batchelor, et al., A study on growth and pyrolysis characteristics of microalgae using Thermogravimetric Analysis-Infrared Spectroscopy and synchrotron Fourier Transform Infrared Spectroscopy, Bioresour. Technol., 2017, 229, 1–10 CrossRef CAS PubMed.
- S. Wang, B. Ru and H. Lin, et al., Pyrolysis behaviors of four lignin polymers isolated from the same pine wood, Bioresour. Technol., 2015, 182, 120–127 CrossRef CAS PubMed.
- K. Wang, K. H. Kim and R. C. Brown, Catalytic pyrolysis of individual components of lignocellulosic biomass, Green Chem., 2014, 16, 727–735 RSC.
- Y. Qiao, B. Wang and P. Zong, et al., Thermal behavior, kinetics and fast pyrolysis characteristics of palm oil: analytical TG-FTIR and Py-GC/MS study, Energy Convers. Manage., 2019, 199, 111964 CrossRef CAS.
- Q. Liu, S. Wang and Y. Zheng, et al., Mechanism study of wood lignin pyrolysis by using TG-FTIR analysis, J. Anal. Appl. Pyrolysis, 2008, 82(1), 170–177 CrossRef CAS.
- M. A. Lopez-Velazquez, V. Santes and J. Balmaseda, et al., Pyrolysis of orange waste: a thermo-kinetic study, J. Anal. Appl. Pyrolysis, 2013, 99, 170–177 CrossRef CAS.
- Q. Liu, S. R. Wang and K. G. Wang, et al., Pyrolysis of wood species based on the compositional analysis, Korean J. Chem. Eng., 2009, 26(2), 548–553 CrossRef CAS.
- Z. L. Zhao, F. S. Cannon and C. Nieto-Delgado, Co-pyrolysis characteristics and kinetics of lignin and collagen, J. Anal. Appl. Pyrolysis, 2016, 120, 501–510 CrossRef CAS.
- Z. Q. Ma, D. Y. Chen and J. Gu, et al., Determination of pyrolysis characteristics and kinetics of palm kernel shell using TGA-FTIR and model-free integral methods, Energy Convers. Manage., 2015, 89, 251–259 CrossRef CAS.
- X. Y. Ren, H. Z. Cai and J. M. Chang, et al., TG-FTIR Study on the Pyrolysis Properties of Lignin from Different Kinds of Woody Biomass, Pap. Biomater., 2018, 3(02), 1–7 CrossRef.
- J. Cai, W. Wu and R. Liu, et al., A distributed activation energy model for the pyrolysis of lignocellulosic biomass, Green Chem., 2013, 15(5), 1331 RSC.
- Q. Bu, H. W. Lei and M. Qian, et al., A thermal behavior and kinetics study of the catalytic pyrolysis of lignin, RSC Adv., 2016, 6(103), 100700–100707 RSC.
- L. Wang, A. Kumar and M. A. Hanna, et al., Thermal Degradation Kinetics of Distillers Grains and Solubles in Nitrogen and Air, Energy Sources, Part A, 2009, 31(10), 797–806 CrossRef CAS.
- F. Y. Fan, Y. W. Zheng and Y. B. Huang, et al., Combustion Kinetics of Biochar Prepared by Pyrolysis of Macadamia Shells, Bioresources, 2017, 12(2), 3918–3932 CrossRef CAS.
- Y. H. Park, J. Kim and S. S. Kim, et al., Pyrolysis characteristics and kinetics of oak trees using thermogravimetric analyzer and micro-tubing reactor, Bioresour. Technol., 2009, 100(1), 400–405 CrossRef CAS PubMed.
- M. A. Lopez-Velazquez, V. Santes and J. Balmaseda, et al., Pyrolysis of orange waste: a thermo-kinetic study, J. Anal. Appl. Pyrolysis, 2013, 99, 170–177 CrossRef CAS.
| This journal is © The Royal Society of Chemistry 2024 |