
 Open Access Article
 This Open Access Article is licensed under a Creative Commons Attribution-Non Commercial 3.0 Unported Licence
O-Alkyl derivatives of ferulic and syringic acid as lipophilic antioxidants: effect of the length of the alkyl chain on the improvement of the thermo-oxidative stability of sunflower oil†
Oscar Forero-Doria ab,
Luis Guzmánc,
Whitney Venturinid,
Felipe Zapata-Gomezc,
Yorley Duartee,
Lorena Camargo-Ayalaf,
Cesar Echeverríag and
Javier Echeverría*a
ab,
Luis Guzmánc,
Whitney Venturinid,
Felipe Zapata-Gomezc,
Yorley Duartee,
Lorena Camargo-Ayalaf,
Cesar Echeverríag and
Javier Echeverría*a
aDepartamento de Ciencias del Ambiente, Facultad de Química y Biología, Universidad de Santiago de Chile, Santiago 9170022, Chile. E-mail: javier.echeverriam@usach.cl; Tel: +56-2-27181154
bDepartamento de Ciencias Básicas, Facultad de Ciencias, Universidad Santo Tomás, Talca 3460000, Chile
cDepartamento de Bioquímica Clínica e Inmunohematología, Facultad de Ciencias de la Salud, Universidad de Talca, Maule, Talca 3460000, Chile
dDepartamento de Ciencias Pre-Clinicas, Facultad de Medicina, Universidad Católica del Maule, Talca 3460000, Chile
eCenter for Bioinformatics and Integrative Biology, Facultad de Ciencias de la Vida, Universidad Andrés Bello, Av. República 330, Santiago 8370146, Chile
fLaboratorio de Síntesis Orgánica y Actividad Biológica (LSO-Act-Bio), Instituto de Química de Recursos Naturales, Universidad de Talca, Casilla 747, Talca 3460000, Chile
gATACAMA-OMICS, Laboratorio de Biología Molecular y Genómica, Facultad de Medicina, Universidad de Atacama, 1532502, Copiapó, Chile
First published on 16th July 2024
Abstract
Lipid oxidation is the major cause of the deterioration of fat-containing foods, especially those containing polyunsaturated fatty acids (PUFAs). Antioxidant additives of synthetic origin are added to matrices rich in PUFAs, such as sunflower oil (SO). However, there is controversy regarding their safety, and their low solubility in both water and fat has led to the search for new covalent modifications through lipophilicity. This work presents the synthesis of O-alkyl acid derivatives from ferulic and syringic acids and the study of their antioxidant capacity and effect on the thermoxidative degradation of SO. Antioxidant activities were evaluated by employing ferric reducing antioxidant power (FRAP) and 2,2-diphenyl-1-picrylhydrazyl (DPPH) radical scavenging assays in a concentration range of 10–100 µg mL−1. The IC50 values for DPPH scavenging activity ranged from 15.61–90.43 µg mL−1. The results of the FRAP assay for both O-alkyl ferulic (3a–f) and syringic (5a–f) series revealed a “cut-off” effect on antioxidant activity in carbon five (C5). Thermoxidation study of additives 3b–c and 5b–c showed a decrease in the slope of extinction coefficients K232 and K270 in comparison with SOcontrol. Furthermore, 3c presented higher antioxidant activity than 3b and 1, with a power to decrease the thiobarbituric acid reactive species (TBARS) 6 times higher than SOcontrol at 220 °C. Additives 5b–c exerted a protective effect on the thermoxidation of SO. The results suggest that increasing lipophilic and thermal properties of antioxidants through O-alkyl acid derivatization is an effective strategy for accessing lipophilic antioxidant additives with potential use in food matrices.
1. Introduction
Vegetable edible oils are a significant source of fat for human consumption, providing energy and nutritional components, and the main compounds are triglycerides (∼95%), which are composed of fatty acids (saturated or mono-/polyunsaturated). They also include tocopherols, essential fatty acids, phytosterols, vitamins, phenolic compounds, and volatile organic compounds.1 Chemical and physical refining processes of edible oils lead to the loss of endogenous antioxidants, such as tocopherols, phenolic compounds, and carotenoids, resulting in increased susceptibility to oxidative deterioration.2 The overall stability and oxidation resistance of oils and fats refer to their ability to resist oxidative rancidity (or deterioration) over processing and storage periods depending on their composition and the conditions to which they are subjected. Generally, the oxidation process begins when the oil is exposed to heat, air, light, etc. The degradation process is characterized by a radical mechanism that produces hydroperoxides, which can generate products such as ketones, aldehydes, alcohols, lactones, and acids.3,4 Partially refined and refined edible oils are usually fortified with synthetic or natural antioxidants to compensate for the loss of endogenous compounds.5 There are many studies on the antioxidant properties of polyphenolic compounds from vegetable extracts or of synthetic origin and their ability to improve the thermoxidative stability of edible oils. In this context, Elhamirad and Zamanipoor6 reported the inhibition of the thermal oxidation of sheep tallow olein by a series of antioxidants, such as α-tocopherol, polyphenolic compounds (quercetin and catechin), and simple phenolic acids (caffeic and gallic acids), using the Rancimat method. They reported that the phenolic acids were more effective at a temperature of 120 °C, but at 180 °C, quercetin was the most effective, whereas polyphenolic compounds were more effective than α-tocopherol at all temperatures used; α-tocopherol, despite being one of the most important and studied endogenous antioxidants in oils, is thermally unstable and offered limited protection at high temperatures.7 Owing to the issues and drawbacks of antioxidants obtained from natural extracts, the use of synthetic or semi-synthetic antioxidants has been extensively promoted to improve the thermal-oxidative stability of edible oils. Therefore, synthetic antioxidants, such as butylated hydroxytoluene (BHT), tert-butylhydroquinone (TBHQ), and butylated hydroxyanisole (BHA), are commonly added to extend the shelf life of edible oils.8,9 TBHQ is considered more effective than BHT and BHA in preventing the thermoxidation of frying oils and increasing oxidative stability.10 Despite the positive effects of preventing the oxidation of edible oils, there is controversy regarding their safety; studies refer to cytotoxic effects and severe damage to the liver and kidney tissues.11,12 In addition, the low solubility of these compounds in both water and fat has led to the search for new covalent modifications of antioxidants through lipophilization as this is an important field of research aiming at developing antioxidants with improved physicochemical properties.13Lipophilic phenolic compounds (Lipo-PCs), whether derived from natural sources or synthesized, have emerged as a promising option for preventing the oxidation of lipids. The synthesis of Lipo-PCs from natural hydrophilic phenolic compounds (Hydro-PCs) is ongoing via chemical or enzymatic acylation/alkylation.14 In this context, the synthesis of ester derivatives from natural phenolic acids was described with a gradual increase in their alkyl chains. Thus, caffeates of medium alkyl chain-length (butyl, octyl, and dodecyl) added to fish oil-enriched mayonnaise resulted in better oxidative stability than caffeates with shorter (methyl) or longer (octadecyl) alkyl chains,15 while the addition of the octanoate ester of caffeic acid increased the induction time of sunflower oil (SO),16 and octyl sinapate enhanced the antioxidant capacity of rapeseed–linseed oil mixture.17
Moreover, an assessment was conducted involving ferulic acid, caffeic acid, and their respective esters in fish oil-enriched milk. The results indicated that the most effective antioxidants were short-chain esters (with chain lengths of C1 or C4) for both phenolic compounds.15,18 Notably, when phenolipids with longer chain lengths were considered, significant distinctions emerged between caffeic acid esters and ferulic acid esters. Medium alkyl ferulates, such as octyl ferulate and dodecyl ferulate, exhibited a notable prooxidative effect at a specific antioxidant concentration, while longer alkyl ferulates (C16 and C20) displayed either weak prooxidant or weak antioxidant properties. In contrast, caffeic acid esters, including medium and long-chain esters, did not exhibit prooxidative effects; instead, they functioned as weak antioxidants.
Studies of homologous series of antioxidants have shown that antioxidant capacity increases as the alkyl chain length increases until a hydrophobicity threshold (i.e., critical chain length) is reached. If the alkyl chain continues to increase, a collapse of the antioxidant capacity occurs (e.g. “cut-off” theory).19,20
Moreover, ester derivatives have poor stability at high temperatures. Propyl gallate (PG) is a food additive that is slightly soluble in both water and fat. Nevertheless, PG is inadequate for frying at temperatures higher than 190 °C because of its poor stability at high temperatures.21,22
Previous reports highlight the importance of the carboxylic acid group in antioxidant capacity; for example, gallic acid was found to be a DPPH radical scavenger (DPPH˙) significantly stronger than pyrogallol due to better solvent-based molecular interactions arising from the –COO-electron donor group.23 In the same way, it has been shown that alkoxy groups also play a crucial role in the antioxidant capacity of phenolic compounds.24 In phenolic compounds, the antioxidant potency can be promoted by the introduction of different electron-donating/withdrawing groups to specific positions of the phenolic ring.21 For example, functional groups substituted to the ortho- or para-positions of phenolic rings are reported to be more effective than those attached to meta-position in changing the performance of phenolic antioxidants.25
Despite the important antioxidant properties presented by phenolic acid esters, there is great interest in new compounds with better antioxidant capacity/lipophilicity/thermal stability ratios that can become new safe alternatives for use as antioxidant additives on lipids, especially edible oils. For this reason, in the present research, a new approach based on the generation of ethers derived from phenolic acids was investigated. It is known that ethers derived from hydroxytyrosol present good antioxidant capacity despite having the hydroxyl group blocked.26 Ferulic and vanillic acids have proven effects over the inhibition of the lipoperoxidation process,27,28 and limited efficiency due to solubility and thermal stability issues.
In the present study, the antioxidant capacity and thermostability activity of O-alkyl functionalized phenolic derivatives were evaluated by applying different methods to assess the physical-chemical characteristics such as hydrophilicity/hydrophobicity and structure–activity relationships responsible for modulating and improving the thermoxidative stability of edible oils, such as SO.
2. Experimental
2.1. Chemicals and reagents
Ferulic and syringic acids and alkyl bromides (ethyl, propyl, pentyl, hexyl, octyl, and decyl bromides) were purchased from Merck Millipore (Burlington, Massachusetts, USA). Methanol and hexane were obtained from Arquimed (Santiago, Chile), while gallic acid, Folin–Ciocalteu reagent, and 2,2-diphenyl-1-picrylhydrazyl (DPPH) were purchased from Sigma Aldrich (St. Louis, MO, USA). All reagents were of analytical grade.2.2. Vegetable oils
The olive and sunflower virgin oils used in this study were obtained from the local market.2.3. General procedure for the synthesis of O-alkyl benzoic and hydroxycinnamic acid derivatives
The O-alkyl phenolic acid derivatives were synthesized and purified following the methodology reported by Tandel et al., 2014 (ref. 29) with slight modifications. Briefly, commercially available ferulic (1) and syringic (4) acids (1.44 mmol) were O-alkylated using the respective alkyl bromides (1.44 mmol; ethyl (2a), propyl (2b), pentyl (2c), hexyl (2d), octyl (2e) and decyl (2f) bromides) and sodium hydroxide (2.88 mmol) in EtOH/H2O (6 mL) 2![[thin space (1/6-em)]](https://www.rsc.org/images/entities/char_2009.gif) :1 solution in a 1:1:2 equivalent molar. The reaction mixture was refluxed for 17 h. After completion of the reaction, the mixture was poured over ice water, and 20 mL of HCl (1 M) was added. The precipitate obtained was filtered, washed with water, and dried to result in the corresponding O-alkyl phenolic acid derivatives. Structure confirmation was achieved based on spectroscopic analyses (1H-NMR and 13C-NMR) (see ESI: Fig. S1–S18†). The synthetic procedure for obtaining the O-alkyl phenolic derivative acids 3a–f and 5a–f is outlined in Scheme 1.
:1 solution in a 1:1:2 equivalent molar. The reaction mixture was refluxed for 17 h. After completion of the reaction, the mixture was poured over ice water, and 20 mL of HCl (1 M) was added. The precipitate obtained was filtered, washed with water, and dried to result in the corresponding O-alkyl phenolic acid derivatives. Structure confirmation was achieved based on spectroscopic analyses (1H-NMR and 13C-NMR) (see ESI: Fig. S1–S18†). The synthetic procedure for obtaining the O-alkyl phenolic derivative acids 3a–f and 5a–f is outlined in Scheme 1.
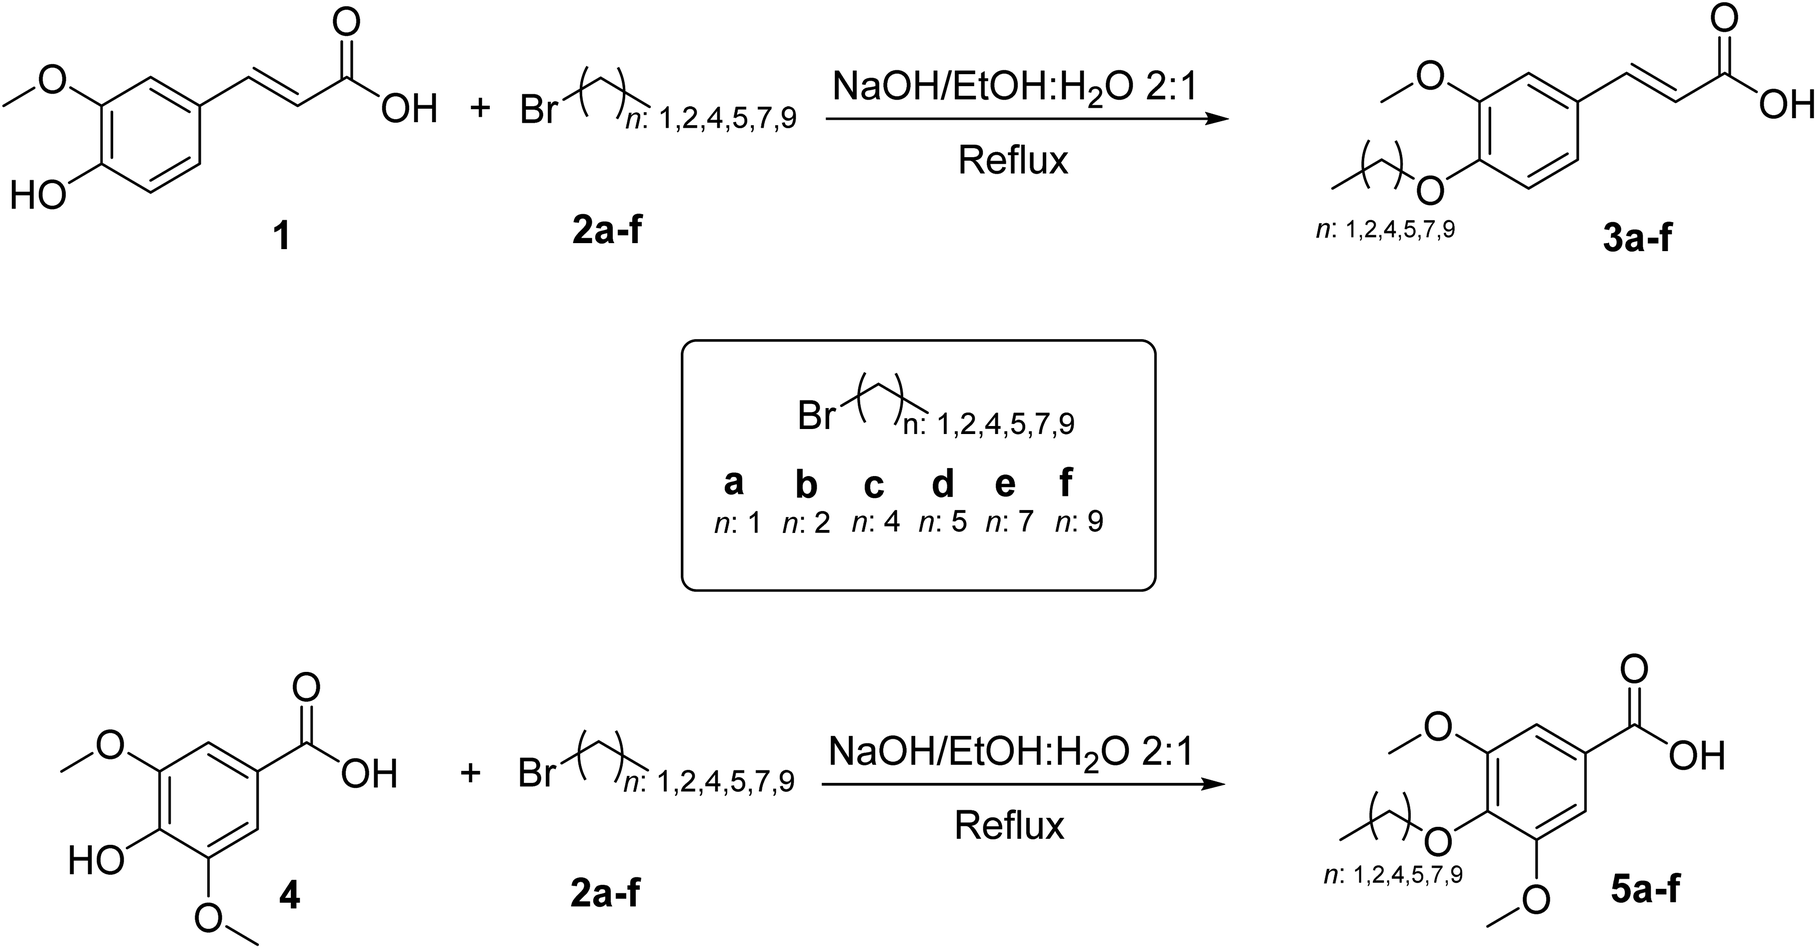 | ||
| Scheme 1 Synthesis of O-alkyl ferulic (3a–f) and syringic (5a–f) acid derivatives. | ||
2.4. Thermal analysis
The study aimed to assess the thermal stability of the treated oils by subjecting them to thermal analysis using a TGA-Q500 thermogravimetric analyzer (TAI Instruments, USA) at a constant heating rate of 5 °C min−1. The analysis involved heating the oils in air, as the reactive gas, from ambient temperature to 700 °C. A mass flow of 60 mL min−1 was maintained for the reactive gas, while 40 mL per minute of N2 was utilized as a protective gas in the electronic balance. Each analysis involved placing approximately 10 mg of the oil into a Pt crucible. After the analysis of TG/DTG curves, specific temperatures were chosen to monitor the oil degradation process. These temperatures included room temperature (25 °C), an intermediate temperature between room temperature and the initial degradation point (100 °C), the frying temperature (180 °C), and the onset of degradation temperature (220 °C).2.5. Heating of oils
A 1 mL sample of sunflower oil (SO) and olive oil (OO) was introduced into a 5 mL beaker; then, this beaker was subsequently positioned on a hot plate equipped with a thermometer for temperature regulation. The samples were exposed to various heating temperatures (25, 100, 180, and 220 °C) for 30 minutes. The determinations of extinction coefficients (K232 and K270) and lipoperoxidation assay (TBARS assay) were performed in triplicate for each selected temperature.2.6. Determination of antioxidant capacity
:1:1 (v/v/v) ratio and then heated to 37 °C in a water bath. Subsequently, 1.5 mL of the FRAP reagent was added to a test tube, and an initial reading was taken at 593 nm. To this mixture, 50 µL of additional antioxidant compounds and 150 µL of distilled water were introduced into the cuvette. After adding the sample to the FRAP reagent, a second reading was taken at 593 nm following a 90 minute incubation at 37 °C. Changes in absorbance 90 minutes after the initial blank reading correlated with a standard curve. Known standards of Fe2+ concentrations were analyzed, encompassing concentrations ranging from 0.1 to 1 mM, and a standard curve was generated by plotting the FRAP values of each standard against its concentrations. The outcome was expressed as the concentration of antioxidants with ferric reducing capacity in 1 gram of the sample (µmol Fe2+ g−1). Ferulic and syringic acids were employed as reference compounds, and each measurement was conducted in triplicate.2.7. Determination of oxidation parameters
2.8. Cytotoxicity
2.9. Prediction of physicochemical properties and pharmacokinetic properties
The physical and chemical characteristics, along with the pharmacokinetic parameters, such as absorption, distribution, metabolism, excretion, and toxicity (ADMET), for all the compounds were forecasted using the ADMETLab 2.0 platform.413. Statistical analysis
The data are presented as the mean ± standard deviation (SD). Statistical analysis ANOVA was carried out using the software Statistical Product and Service Solutions (SPSS) version 15.0 (SPSS Inc., Chicago, IL, USA). The significance level for statistical tests was defined as p < 0.05.4. Results and discussion
The O-alkyl ferulic (3a–f) and syringic (5a–f) derivatives were obtained with overall yields of 20–59% and 18–38%, respectively. Some of the synthesized compounds have been reported in previous works.29,42–45 The 1H- and 13C-NMR spectra and HPLC analysis are displayed in ESI: Fig. S1–S18.†To evaluate the in vitro antioxidant effects of O-alkyl phenolic derivatives 3a–f and 5a–f, DPPH and FRAP assays were applied. The values for the DPPH and FRAP assays of the O-alkyl phenolic derivative 3a–f–5a–f are shown in Table 1 and Fig. 2, respectively. The antioxidant capacities for both methods were evaluated in a concentration range of 10–100 µg mL−1, and the IC50 range of values for DPPH scavenging activity was 4.53 ± 0.19–90.43 ± 1.63 µg mL−1.
| Compound | IC50 (µg mL−1) | Compound | IC50 (µg mL−1) |
|---|---|---|---|
| 1 | 15.61 ± 1.82 | 4 | 4.53 ± 0.19 |
| 3a | 56.50 ± 2.38 | 5a | 9.20 ± 0.91 |
| 3b | 90.43 ± 1.63 | 5b | 11.47 ± 0.58 |
| 3c | >100 | 5c | 34.98 ± 2.23 |
| 3d | >100 | 5d | >100 |
| 3e | >100 | 5e | >100 |
| 3f | >100 | 5f | >100 |
These results attest that the radical scavenging activities of the O-alkyl ferulic acid 3a–b (IC50 = 56.50 ± 2.38 µg mL−1 (3a); 90.43 ± 1.63 µg mL−1 (3b)) and O-alkyl syringic acid 5a–c (IC50 = 9.20 ± 0.91 µg mL−1 (5a); 11.47 ± 0.58 µg mL−1 (5b); 34.98 ± 2.23 µg mL−1 (5c)) were higher in comparison with O-alkyl ferulic (3c–f) (IC50 = >100 µg mL−1) and O-alkyl syringic (5d–f) (IC50 = >100 µg mL−1) acids, respectively.
It is well-accepted that phenolic compounds scavenge radicals by proton donation.21 Furthermore, it is a well-established fact that the number and position of the hydroxyl group on the ring in the ortho-position increases the radical scavenging activity.46
In the O-alkyl phenolic compounds reported in the present study, the hydroxyl group was blocked, highlighting that the antioxidant capacity depends on the number of O-alkyl groups present in the molecule, e.g. methoxy, which leads to an increase in the radical scavenging activity of the antioxidant.47 As an example, the O-alkyl syringic acid 5a (IC50 = 9.20 ± 0.91 µg mL−1) is almost six times more powerful as an antioxidant than the O-alkyl ferulic acid 3a (IC50 = 56.50 ± 2.38 µg mL−1). In this same line of comparison, 5b is approximately eight times more powerful than 3b. Moreover, it is evident that the antioxidant capacity decreases as the O-alkyl phenolic derivative length increases. Thus, the antioxidant capacity in decreasing order was 3a > 3b > 3c and 5a > 5b > 5c for ferulic and syringic O-alkyl phenolic acid derivatives, respectively. Furthermore, it was observed that the influence of –CO2H and –CH![[double bond, length as m-dash]](https://www.rsc.org/images/entities/char_e001.gif) CH–CO2H groups was not explicit.
CH–CO2H groups was not explicit.
The different radical-scavenging effects observed can be attributed to the different abilities of the individual phenolic acids to react with DPPH•, giving a stable non-radical product. A proposed chemical mechanism for the reaction between DPPH˙ and rosmarinic acid was presented by Brand-Williams et al., 1995.33
Additionally, Karamać et al.48 reported that the hydroxybenzoic acid, syringic acid (4), was more active than its hydroxycinnamic acid counterpart, sinapic acid. This trend of higher antioxidant capacity of hydroxybenzoic acids over hydroxycinnamic acids was also observed in the present study when the antioxidant capacity of syringic acid 4 (IC50 = 4.53 ± 0.19 µg mL−1) was compared to that of ferulic acid 1 (IC50 = 15.61 ± 1.82 µg mL−1). This tendency was maintained throughout the O-alkyl series of syringic acid (5a–c) over the O-alkyl series of ferulic acid (3a–c).
However, the O-alkyl ferulic (3a–f) and syringic (5a–f) acid series were selected for the FRAP scavenging activity study (Fig. 1). The FRAP values in increasing order for the O-alkyl ferulic and syringic acid series were 3a > 3b > 3c and 5a > 5b > 5c, respectively. The decrease in ferric reducing/antioxidant power when the O-alkyl length increases is in agreement with the values of DPPH scavenging activity. The comparison of antioxidant capacity values between 3a–b and 3c–f showed a significant difference (p < 0.001). In the same way, the comparison between 5a–c and 5d–f showed a significant difference (p < 0.001) in the FRAP values.
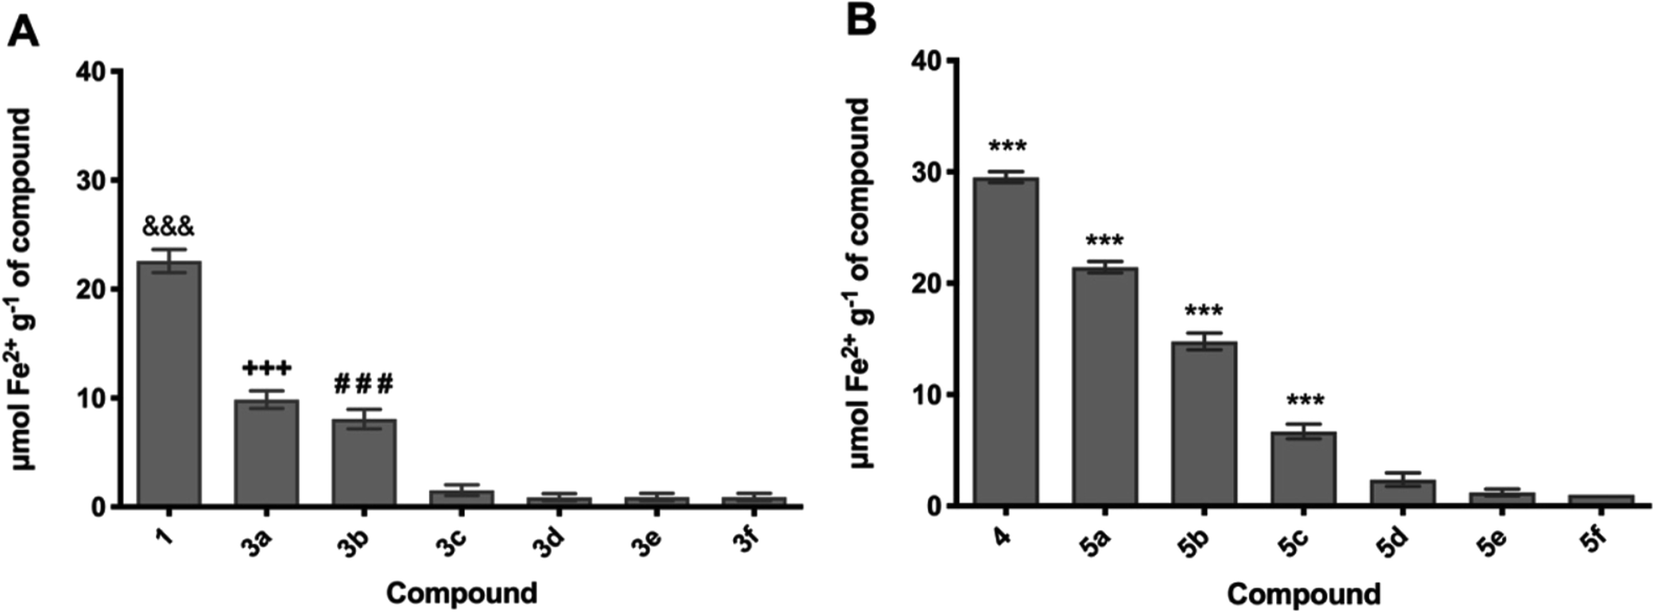 | ||
| Fig. 1 Ferric reducing/antioxidant power (FRAP) of the evaluated compounds. (A) Ferulic acid and O-alkyl derivatives (3a–f), and (B) syringic acid and O-alkyl derivatives (5a–f). &&& p < 0.001 against (3a–f), *** p < 0.001 against all compounds. | ||
To evaluate and verify the influence of the structure and composition on the thermal degradation of OO and SO oils, thermal analysis of the samples was undertaken in a temperature range of 25–700 °C. The mass loss (TG) and derivative (DTG) curves are presented in Fig. 2 and 3, respectively. A plateau was observed in both oils, indicating thermal stability of the materials of up to 200 °C. The thermal oxidative decomposition processes occurred in the temperature range of 200–600 °C for OO and SO. OO decomposed in three steps, with a total mass loss of 95%, while SO decomposed in four steps, with a total mass loss of 98%. The maximum degradation temperature for OO was 407 °C, while that for SO was 327 °C. This high thermal stability of OO can be largely attributed to the endogenous presence of polyphenolic compounds, such as hydroxytyrosol and oleuropein.49,50
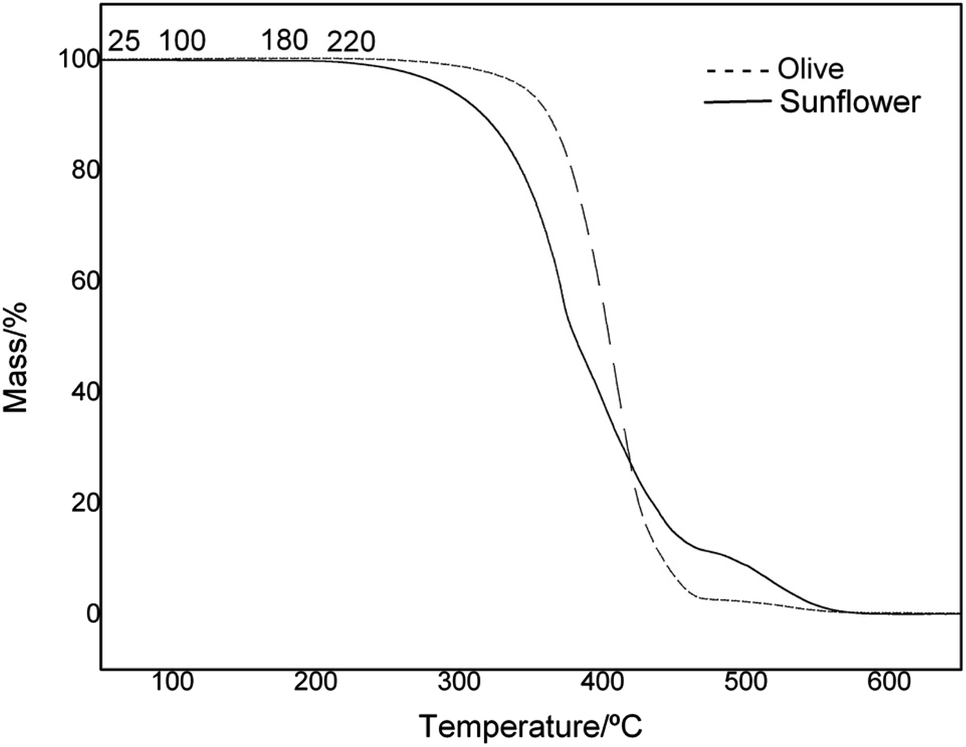 | ||
| Fig. 2 Comparison of TG curves for sunflower and olive oils at the selected temperatures. | ||
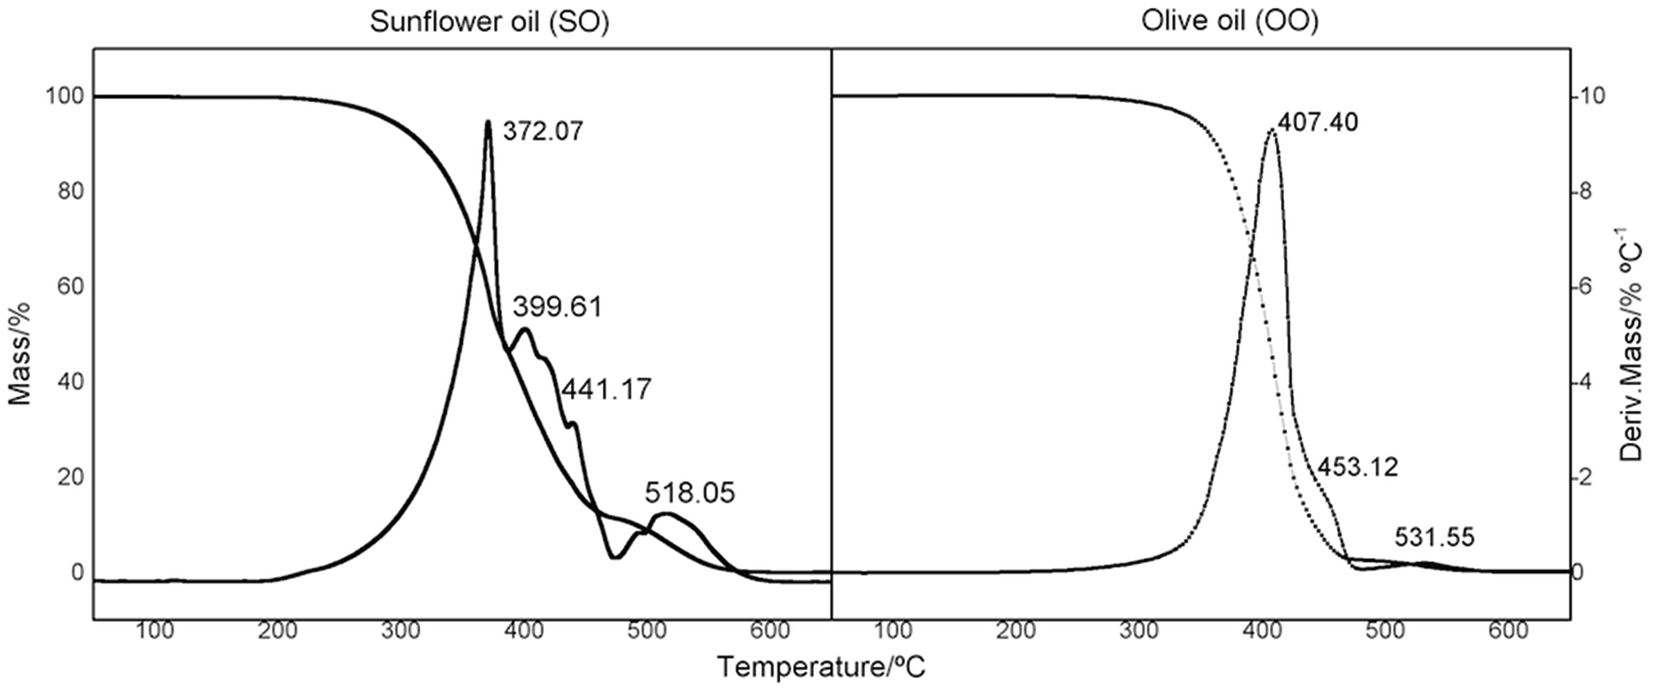 | ||
| Fig. 3 Comparison of TG/DTG curves for sunflower and olive oils. | ||
As the thermal behaviour was similar in both oils (OO and SO), four temperatures (25, 100, 180, and 220 °C) were chosen from the TG curve for the study of improvement of the thermal stability of SO with additives 3b, 3c, 5b, and 5c.
A concentration of 200 ppm of additives 3b, 3c, 5b, and 5c was added to the samples of SO based on the existing food additive regulation of the U.S. Food and Drug Administration (FDA). This regulation allows the use of BHA and BHT individually or in combination at a maximum level of 0.02% or 200 ppm, including their use in edible animal fats and vegetable oils, based on the lipid content of food products, as specified by the Code of Federal Regulations (CFR).51,52
To analyze the thermal stability of SO supplemented with 3b, 3c, 5b, and 5c at 200 ppm concentration, thermal analyses were performed in an interval of 20–700 °C. The TG curves are shown in Fig. 4 (from 20 to 600 °C).
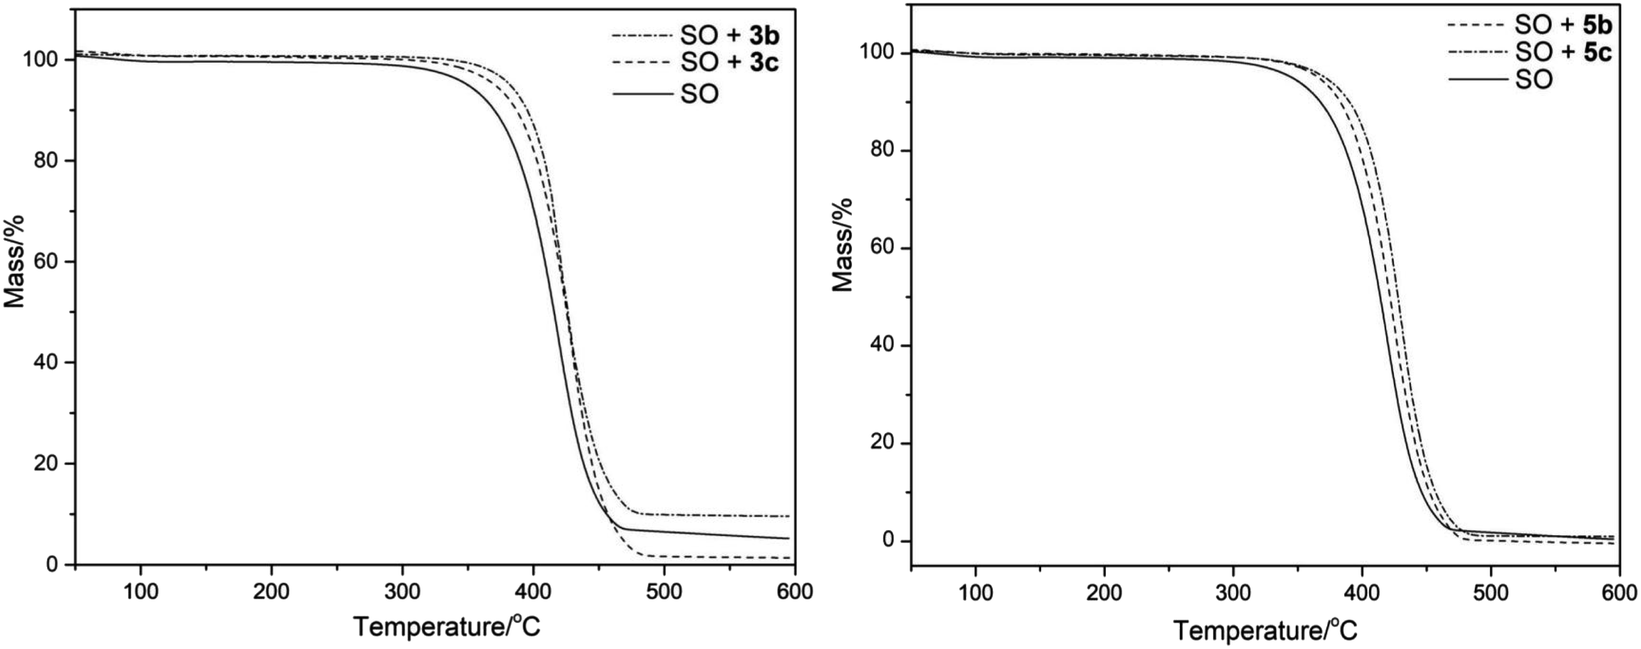 | ||
| Fig. 4 TG curves of sunflower oil (SO) and SO supplemented with the O-alkyl derivatives 3b–c and 5b–c. | ||
The TG plateaus for SO + 3b, 3c, 5b, and 5c showed differences in the onset temperature of mass loss (Tonset/°C) (Table 2) in comparison with SO. The additive 3b–c had an increase of approx. 63 °C, while the additive 5b and 5c increased by 24 and 37 °C, respectively.
The SO degradation temperatures associated with the loss of mass of 5, 10, and 50% obtained were 341, 365, and 419 °C, respectively. Additionally, the treatments with additives 3b–c and 5b–c showed an increase in these values. In this regard, additive 3b showed the highest values with differences of 35, 25, and 4 °C in comparison to SO at 5, 10, and 50% mass loss, respectively. In addition, a small difference was observed between the same series of additives; for example, the Tonset/°C of 3b (C3) in comparison with 3c (C5) was only 1 °C, with the trend being observed throughout 5, 10, and 50% of the mass loss. However, in the 5b–c series, the difference in the Tonset/°C of 5b (C3) in comparison to 5c (C5) was 13 °C, and the temperatures corresponding to the 5, 10, and 50% of the mass loss are similar with a variation of 4–6 °C.
The homogenized samples were heated to 25, 100, 180, and 220 °C and kept at these temperatures for 30 min with a heating ramp of 2 °C min−1. Extinction coefficients K232 and K270 and TBARS values were measured through heating as SO oxidation parameters. In Fig. 5 and 6, the evolution in K232 and K270 values is presented, respectively. As expected, both K232 (primary oxidation) and K270 (secondary oxidation) indexes increased in a temperature-dependent manner, which indicated the formation of conjugated dienes and trienes over time.
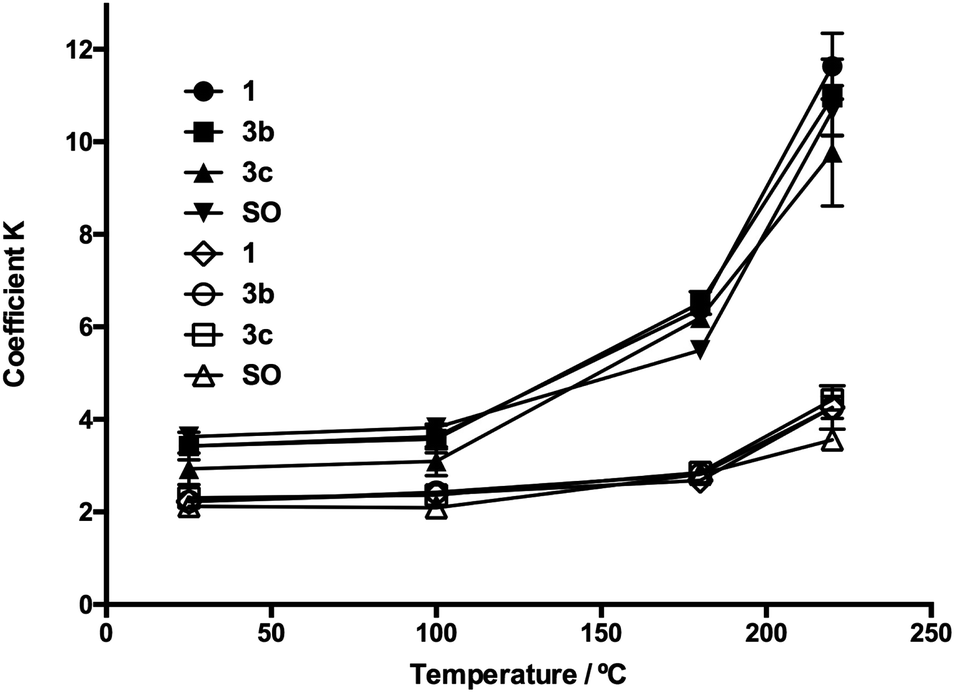 | ||
| Fig. 5 Evolution of extinction coefficients K232 and K270 through the heating process for oil additives 3b and 3c. SO: sunflower oil without additive, K232: symbol in black, and K270: symbol in white. | ||
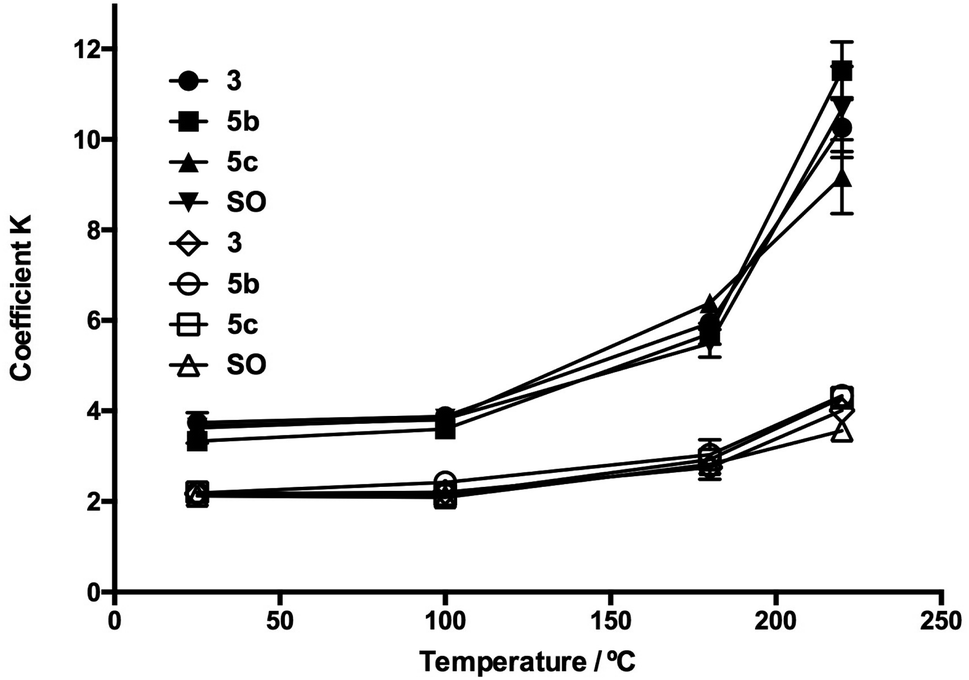 | ||
| Fig. 6 Evolution of extinction coefficients K232 and K270 through the heating process for oil additives 5b and 5c. SO: sunflower oil without additive, K232: symbol in black, and K270: symbol in white. | ||
The K232 (3.32) and K270 (1.68) values obtained at 25 °C for SO resemble those reported by Kalantzakis and coworkers.53 The values of K232 and K270 showed a lower increase in the range of 25–100 °C, not observing differences in the treatments with compounds 3b–c and 5b–c. Simultaneously, at frying temperature (180 °C), it was observed that the slopes of the K232 and K270 curves were low compared with the corresponding slopes at 220 °C. Thus, in Fig. 5 and 6, these trends are observed at 220 °C, which are much more evident in the O-alkyl phenolic acid derivatives 3c and 5c.
The TBARS assay (Fig. 7 and 8) is the most widely used method for the measurement of secondary oxidation products. In all treatments with the compounds, a continuous and temperature-dependent increase in TBARS values was observed. The SOcontrol exhibited an increase in the TBARS values from 4.30 to 13.80 nmol L−1, while OOcontrol TBARS values declined through heating from 10.47 to 8.46 nmol L−1 in the temperature range of 25–220 °C. The high polyunsaturated fatty acid (PUFA) content, such as linoleic acid content (61.37%), and the absence of endogenous antioxidants are the main factors responsible for the poor resistance of SO to thermoxidation. Although OO contains a low PUFA content (8.576%),54 the presence of different endogenous antioxidants, such as oleuropein, pinoresinol, and tyrosol,55,56 makes it more resistant to thermoxidation.
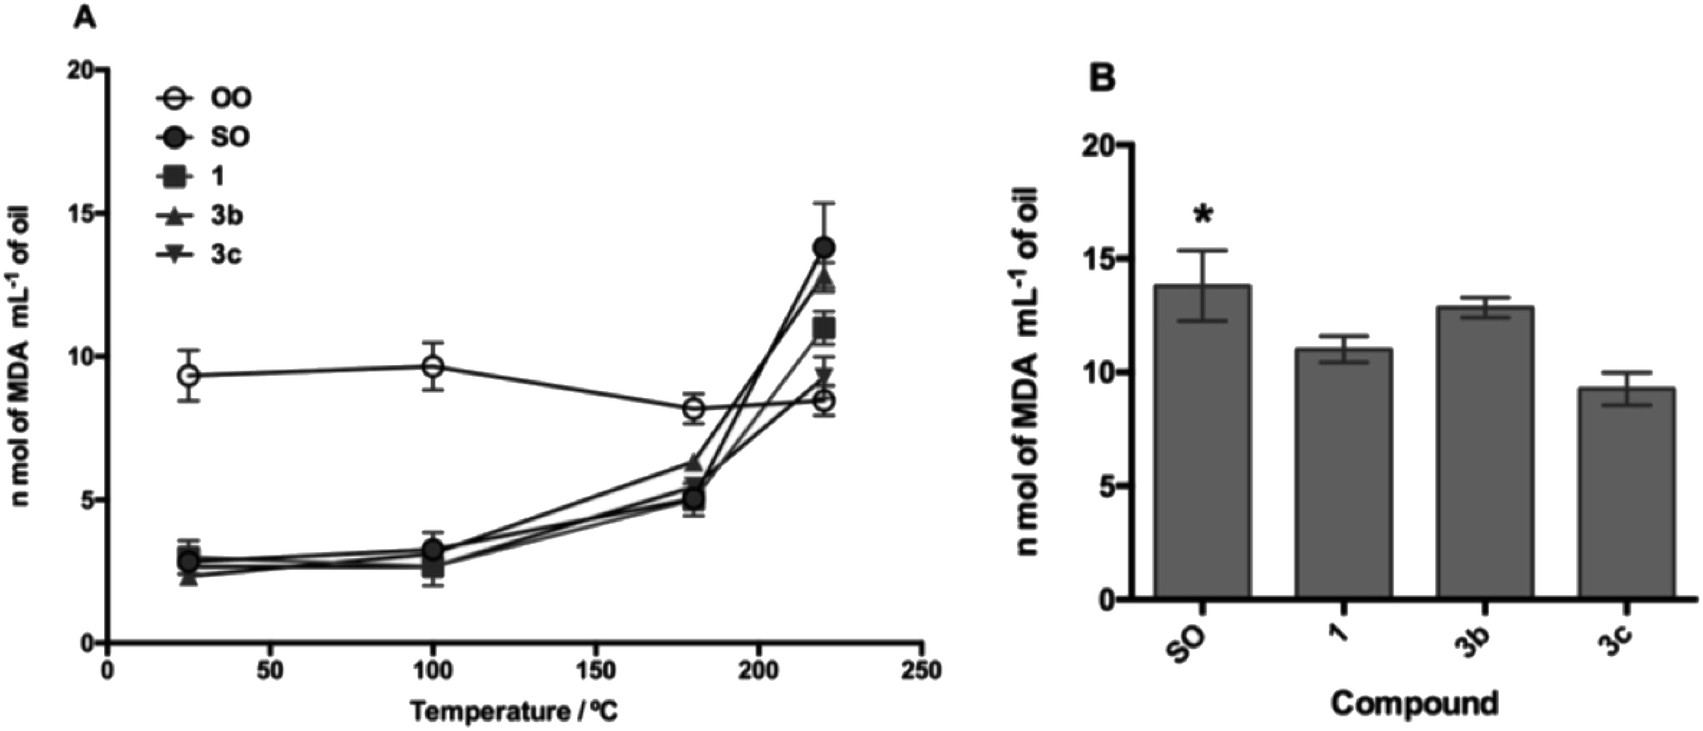 | ||
| Fig. 7 Lipid peroxidation process in the presence of compound 1 and its derivatives 3b and 3c. (A) Lipid oxidation process as temperature increases and (B) statistical analysis of the oxidation process at 220 °C. SO: sunflower oil. *p < 0.05 with respect to 3c. | ||
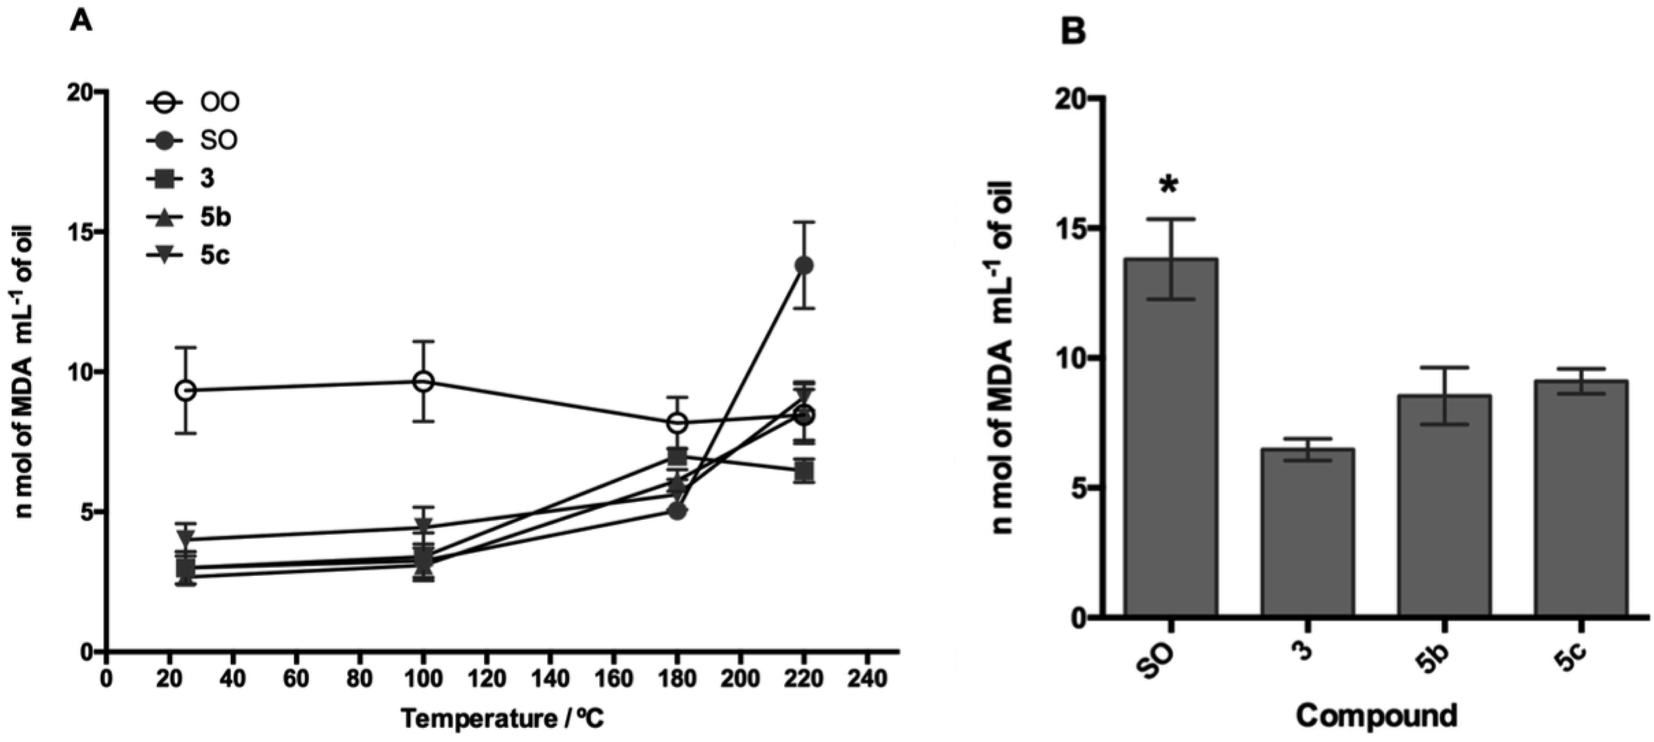 | ||
| Fig. 8 Lipid peroxidation process in the presence of compound 3 and its derivatives 5b and 5c. (A) Lipid oxidation process as temperature increases and (B) statistical analysis of the oxidation process at 220 °C. SO: sunflower oil. *p < 0.05 for compounds 3, 5b, and 5c. | ||
For the evaluation of the O-alkyl phenolic acid derivatives as oil additives, 3b–c and 5b–c were selected, and these compounds showed a slow rate of TBARS formation at 25–100 °C range. With the temperature increase (180 °C), TBARS levels were increased without a significant difference between SOcontrol and the additives, while significant differences were observed when the temperature was increased to 220 °C. In this sense, the O-alkyl syringic acid additives 3b and 3c showed TBARS values of 8.88 and 7.68 nmol mL−1 respectively. The reduction in secondary oxidation to 5 (3b) and 6 (3c) times in comparison with SOcontrol (13.80 nmol L−1) was also observed, with a significant difference (p < 0.05) of SO concerning 3c. Meanwhile, the O-alkyl ferulic acids 5b and 5c reduce the TBARS levels 5 times more than those of SOcontrol. There is no significant difference between 5b and 5c, but there is a considerable difference compared to the SOcontrol (p < 0.05).
In line with our findings, Zhang et al.57 reported the use of carnosic acid (CA) (phenolic diterpene compound) found in the leaves of rosemary as an oil additive to improve the oxidative stability of SO during accelerated storage (60 °C). CA exhibited a stronger antioxidant capacity in SO than in BHT and BHA. However, vegetable extracts have been evaluated as edible oil additives. Recently, our research group investigated the antioxidant potential of maqui (Aristotelia chilensis (Mol.) Stuntz) leaf methanolic extract, which acted as an excellent additive in the thermoxidative process of avocado oil, reduced its oxidation parameters K232, K270, and its content in polar compounds.58 Additionally, an increase in the Tonset/°C temperature of mass loss was observed in the TG-DTG curves of avocado oil fortified with maqui leaf methanolic extract.
Moreover, Kamkar et al.59 demonstrated that aqueous and methanolic extracts and essential oils from pennyroyal (Mentha pulegium L.) act as antioxidants and their use as oil additives showed content−dependent inhibitory effects on retarding lipid oxidation of edible oils under study storage time of 8 days, resulting in low levels of TBARS compared with BHT through the examined range of concentrations (200–1000 ppm).59
It should be noted that these oil additives reported in the present study managed to efficiently reduce the levels of SO oxidation (7.68 nmol L−1: 3c) even below the values for OO (8.46 nmol L−1) at 220 °C.
The aging process of SO and OO supplemented with the best performance additives (5c and 3c) was carried out for 12 days to simulate one year of storage. The values of the K232 extinction coefficient and TBARS are shown in Fig. 9 and 10, respectively.
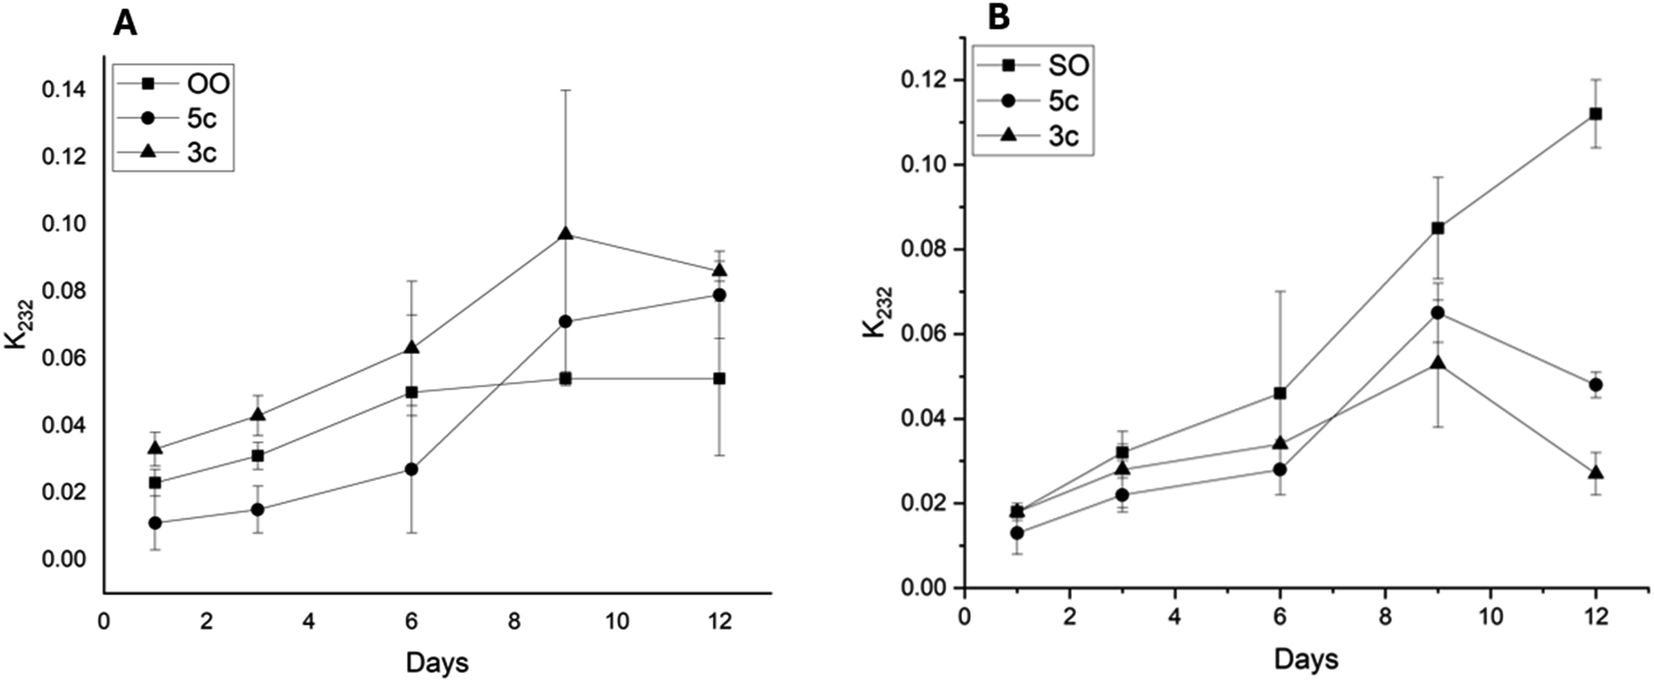 | ||
| Fig. 9 Evolution of extinction coefficients K232 over time of olive oil (A) and sunflower oil (B) supplemented with additives 5c and 3c at 60 °C in the dark. Data points represent mean (n = 3) ± standard error of the mean. | ||
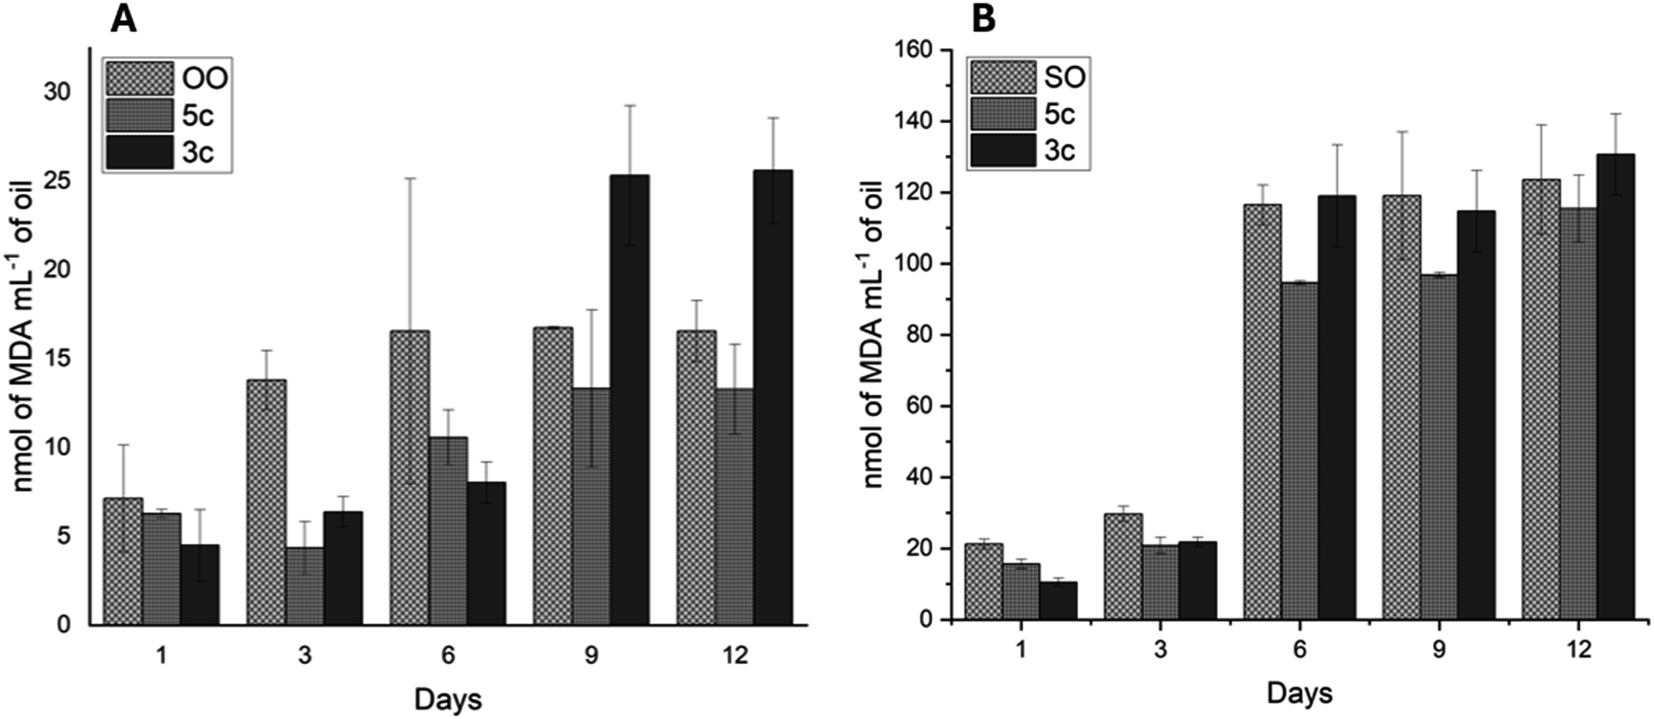 | ||
| Fig. 10 Lipid peroxidation process was measured using the thiobarbituric acid reactive substance (TBARS) assay on olive oil (A) and sunflower oil (B) supplemented with additives 5c and 3c at 60 °C in the dark. Data points represent mean (n = 3) ± standard error of the mean. | ||
The K232 extinction coefficient reveals the presence of conjugated dienes, which are formed from hydroperoxides derived from the unsaturated fatty acids present in the oils. Thus, as illustrated in Fig. 9, a sustained increase in K232 over time for OO and SO was observed. However, the oils supplemented with additives 5c and 3c showed different behaviors. In the case of OO, 5c showed lower values than the OOcontrol, with ΔK values of 0.04 for days 3 and 9. Moreover, 3c exhibited K232 values higher than the OOcontrol. However, SO showed a behavior similar to that presented by OO. In the case of SO, both additives (5c and 3c) decreased the K232 values as a function of time, with additive 3c standing out, which presented ΔK values of 0.04 and 0.09 for days 9 and 12, respectively.
All oil supplements with additives 5c and 3c showed a continuous increase in TBARS values (Fig. 10). The OOcontrol increases the TBARS value from 6 to 15 nmol L−1, while the SOcontrol increases the TBARS value from 20 to 120 nmol L−1 in the 12 days, demonstrating the great stability presented by OO without the presence of additives. For its part, additives 5c and 3c decrease TBARS values. The OO supplemented with 5c and 3c shows TBARS values below that of OOcontrol from days 1 to 6. For 9 to 12 days, only 5c presents values lower than those of the OOcontrol. Regarding SO, additive 5c decreased the TBARS values over 12 days although these values are far above those presented by OO (100 units above from days 6 to 12).
To assess the effect and potential health risk of the use of these lipophilic antioxidants as additives in edible oils, the cytotoxicity of these compounds was evaluated in three cell lines. The results of the cytotoxic effect on Caco-2, HUVEC, and Vero cell lines indicated that only compounds 3e, 3f, 5e and 5f showed an IC50 value below 100 µM (Table 3). It is important to specify that the compounds were examined at quantities significantly higher than those used for additives, indicating their safety for use in edible oils.
| Compound | IC50 ± SD (µM) | ||||||||
|---|---|---|---|---|---|---|---|---|---|
| 24 h | 48 h | 72 h | |||||||
| Caco-2 | HUVEC | Vero | Caco-2 | HUVEC | Vero | Caco-2 | HUVEC | Vero | |
| 3a | >100 | >100 | >100 | >100 | >100 | >100 | >100 | >100 | >100 |
| 3b | >100 | >100 | >100 | >100 | >100 | >100 | >100 | >100 | >100 |
| 3c | >100 | >100 | >100 | >100 | >100 | >100 | >100 | >100 | >100 |
| 3d | >100 | >100 | >100 | >100 | >100 | >100 | >100 | >100 | >100 |
| 3e | >100 | 90.02 ± 1.03 | >100 | >100 | 53.08 ± 1.02 | >100 | 96.19 ± 1.10 | 54.39 ± 1.05 | >100 |
| 3f | >100 | 55.61 ± 1.05 | >100 | 88.72 ± 1.08 | 26.44 ± 1.06 | >100 | 76.77 ± 1.08 | 25.37 ± 1.08 | >100 |
| 5a | >100 | >100 | >100 | >100 | >100 | >100 | >100 | >100 | >100 |
| 5b | >100 | >100 | >100 | >100 | >100 | >100 | >100 | >100 | >100 |
| 5c | >100 | >100 | >100 | >100 | >100 | >100 | >100 | >100 | >100 |
| 5d | >100 | >100 | >100 | >100 | >100 | >100 | >100 | >100 | >100 |
| 5e | >100 | >100 | >100 | >100 | 55.94 ± 1.06 | >100 | >100 | 53.34 ± 1.05 | >100 |
| 5f | >100 | 47.25 ± 1.04 | >100 | 69.96 ± 1.06 | 35.44 ± 1.04 | >100 | 62.79 ± 1.07 | 29.31 ± 1.09 | >100 |
In addition, the physicochemical and pharmacokinetic properties of the compounds were predicted. The results are displayed in the ESI (Tables S1 and S2†). The most active O-alkyl phenolic acid derivatives show very favorable physicochemical properties and no violations of Lipinski's rule. Additionally, lipophilicity (logP), topological polar surface area (TPSA), and water solubility (logS) parameters showed favorable values for adequate hydrophobic interaction between O-alkyl phenolic acid derivatives and triglycerides. Regarding the ADMET properties, the results show that these compounds have acceptable values of physicochemical properties, pharmacokinetic parameters, and low toxicity for use without risk in humans and animals.60
5. Conclusions
Despite the difficulty in stabilizing SO due to its high content of linoleic acid, the results of the present study indicated that the lipophilic antioxidants 3b–c and 5b–c exhibited satisfactory antioxidant capacities during the thermoxidation process of SO; this effect was greater when the physicochemical parameters, such as lipophilicity, melting, and boiling point, increased with O-alkyl chain-length. Thus, these parameters are 3.387, 155–157 °C, 358 ± 37 °C < 3.776, 128–129 °C, 385.8 ± 37 °C and 2.945, 123–125 °C, 390.1 ± 27.0 °C < 3.331, 105–106 °C, 414.2 ± 30 °C for 3b–c and 5b–c, respectively. Furthermore, additive 3c presents an important antioxidant capacity compared to 3b (p < 0.05) and 1, and efficiently reduces SO lipoxidation compared to SO without additive, with the best TBARS values at 220 °C. The additive 5b–c also exerted a protective effect on the thermoxidation of SO with a significant difference of p < 0.05, but unlike 3b–c, there were no significant differences between 5b and 5c. The test for accelerated aging of oils of 12 days shows that additives 5c and 3c reduce TBARS values in olive oil (OO) and sunflower oil (SO). Additive 5c is especially effective in OOcontrol between days 9 and 12, keeping the TBARS value lower than that of OOcontrol. This reduction tendency is also observed in the TBARS values in SO supplemented although it presents higher values than in OO supplemented.This result demonstrated that increasing the lipophilic and thermal properties of natural antioxidants through O-alkyl phenolic acid derivatization consists of a promising and safe alternative approach in the search for lipophilic antioxidants with potential use as oil additives in food matrices.
Data availability
The data supporting this article have been included as part of the ESI.†Conflicts of interest
There are no conflicts to declare.Acknowledgements
The authors JE and O. F.-D. acknowledge the financial support of project DICYT-USACH 022241 EM_Postdoc. O. F.-D. thanks FONDECYT Project No. 11240828.References
- L. Zhang, P. Li, X. Sun, X. Wang, B. Xu, X. Wang, F. Ma, Q. Zhang and X. Ding, J. Agric. Food Chem., 2014, 62, 8745–8751 CrossRef CAS PubMed.
- W. Chaiyasit, R. J. Elias, D. J. McClements and E. A. Decker, Crit. Rev. Food Sci. Nutr., 2007, 47, 299–317 CrossRef CAS PubMed.
- C. Spatari, M. De Luca, G. Ioele and G. Ragno, LWT–Food Sci. Technol., 2017, 76, 147–155 CrossRef CAS.
- N. Vlachos, Y. Skopelitis, M. Psaroudaki, V. Konstantinidou, A. Chatzilazarou and E. Tegou, Anal. Chim. Acta, 2006, 573–574, 459–465 CrossRef CAS PubMed.
- L. Redondo-Cuevas, G. Castellano, F. Torrens and V. Raikos, J. Food Compos. Anal., 2018, 66, 221–229 CrossRef CAS.
- A. H. Elhamirad and M. H. Zamanipoor, Eur. J. Lipid Sci. Technol., 2012, 114, 602–606 CrossRef CAS.
- A. H. Elhamirad and M. H. Zamanipoor, Eur. J. Lipid Sci. Technol., 2012, 114, 602–606 CrossRef CAS.
- J. Li, Y. Bi, S. Sun and D. Peng, Food Chem., 2017, 234, 205–211 CrossRef CAS.
- B. Saad, Y. Y. Sing, M. A. Nawi, N. Hashim, A. S. Mohamed Ali, M. I. Saleh, S. F. Sulaiman, K. M. Talib and K. Ahmad, Food Chem., 2007, 105, 389–394 CrossRef CAS.
- C. C. Akoh, Food Lipids: Chemistry, Nutrition, and Biotechnology, CRC press, 2017 Search PubMed.
- R. S. Farag, G. S. El-baroty and A. M. Basuny, Int. J. Food Sci. Nutr., 2003, 54, 159–174 CrossRef CAS.
- M. Saito, H. Sakagami and S. Fujisawa, Anticancer Res., 2003, 23, 4693–4701 CAS.
- M. Laguerre, C. Bayrasy, J. Lecomte, B. Chabi, E. A. Decker, C. Wrutniak-Cabello, G. Cabello and P. Villeneuve, Biochimie, 2013, 95, 20–26 CrossRef CAS.
- L. Liu, C. Jin and Y. Zhang, RSC Adv., 2014, 4, 2879–2891 RSC.
- M. Alemán, R. Bou, F. Guardiola, E. Durand, P. Villeneuve, C. Jacobsen and A.-D. M. Sørensen, Food Chem., 2015, 167, 236–244 CrossRef PubMed.
- G. J. H. Buisman, C. T. W. van Helteren, G. F. H. Kramer, J. W. Veldsink, J. T. P. Derksen and F. P. Cuperus, Biotechnol. Lett., 1998, 20, 131–136 CrossRef CAS.
- A. Szydłowska-Czerniak, D. Rabiej and M. Krzemiński, J. Sci. Food Agric., 2018, 98, 1625–1631 CrossRef.
- A.-D. M. Sørensen, K. S. Lyneborg, P. Villeneuve and C. Jacobsen, J. Funct. Foods, 2015, 18, 959–967 CrossRef.
- A. S. Elder, J. N. Coupland and R. J. Elias, Food Chem., 2021, 346, 128885 CrossRef CAS.
- M. Laguerre, L. J. López Giraldo, J. Lecomte, M.-C. Figueroa-Espinoza, B. Baréa, J. Weiss, E. A. Decker and P. Villeneuve, J. Agric. Food Chem., 2009, 57, 11335–11342 CrossRef CAS.
- F. Shahidi, P. K. Janitha and P. D. Wanasundara, Crit. Rev. Food Sci. Nutr., 1992, 32, 67–103 CrossRef CAS.
- D. F. Buck and M. K. Edwards, Food Sci. Technol. Int., 1997, 2, 29–33 Search PubMed.
- S. A. Rafiee, R. Farhoosh and A. Sharif, Eur. J. Lipid Sci. Technol., 2018, 120, 1800319 CrossRef.
- R. Farhoosh, S. Johnny, M. Asnaashari, N. Molaahmadibahraseman and A. Sharif, Food Chem., 2016, 194, 128–134 CrossRef CAS.
- J. H. Chen and C.-T. Ho, J. Agric. Food Chem., 1997, 45, 2374–2378 CrossRef CAS.
- A. Madrona, G. Pereira-Caro, R. Mateos, G. Rodríguez, M. Trujillo, J. Fernández-Bolaños and J. Espartero, Molecules, 2009, 14, 1762–1772 CrossRef CAS PubMed.
- J. Kanski, M. Aksenova, A. Stoyanova and D. A. Butterfield, J. Nutr. Biochem., 2002, 13, 273–281 CrossRef CAS PubMed.
- L. R. Fukumoto and G. Mazza, J. Agric. Food Chem., 2000, 48, 3597–3604 CrossRef CAS.
- R. C. Tandel and N. K. Patel, Mol. Cryst. Liq. Cryst., 2014, 593, 114–125 CrossRef CAS.
- A. V Lebedev, A. B. Lebedeva, V. D. Sheludyakov, E. A. Kovaleva, O. L. Ustinova and I. B. Kozhevnikov, Russ. J. Gen. Chem., 2005, 75, 1113–1124 CrossRef.
- Y. Chen, J. Sun, L. Fang, M. Liu, S. Peng, H. Liao, J. Lehmann and Y. Zhang, J. Med. Chem., 2012, 55, 4309–4321 CrossRef CAS PubMed.
- E. Kasztreiner, L. Vargha and J. Borsy, Acta Chim. Acad. Sci. Hung., 1967, 51, 327–337 CAS.
- W. Brand-Williams, M. E. Cuvelier and C. Berset, LWT–Food Sci. Technol., 1995, 28, 25–30 CrossRef CAS.
- P. Molyneux, Songklanakarin J. Sci. Technol., 2004, 26, 211–219 CAS.
- I. F. F. Benzie and J. J. Strain, Anal. Biochem., 1996, 239, 70–76 CrossRef CAS.
- O. Forero-Doria, L. Astudillo, R. I. Castro, R. Lozano, O. Díaz, L. Guzmán-Jofre and M. Gutierrez, Bol. Latinoam. Caribe Plant. Med. Aromat., 2014, 13, 344–350 Search PubMed.
- S. Maqsood and S. Benjakul, Food Chem., 2010, 119, 123–132 CrossRef CAS.
- AOCS Official Method Cg 5–97, Oven storage test for accelerated aging of oils. Sampling and analysis of commercial fats and oils, Methods and Recommended Practices of the AOCS, ed. D. Firestone, AOCS Press, Champaign, IL, USA, 6th edn, 1997, pp. 1–2 Search PubMed.
- D. Michotte, H. Rogez, R. Chirinos, E. Mignolet, D. Campos and Y. Larondelle, Food Chem., 2011, 129, 1228–1231 CrossRef CAS PubMed.
- C. Echeverría, A. Martin, F. Simon, C. O. Salas, M. Nazal, D. Varela, R. A. Pérez-Castro, J. F. Santibanez, R. O. Valdés-Valdés and O. Forero-Doria, Front. Pharmacol, 2022, 13, 1003264 CrossRef PubMed.
- G. Xiong, Z. Wu, J. Yi, L. Fu, Z. Yang, C. Hsieh, M. Yin, X. Zeng, C. Wu, A. Lu, X. Chen, T. Hou and D. Cao, Nucleic Acids Res., 2021, 49, W5–W14 CrossRef CAS.
- V. Desai, V. S. Sharma and R. B. Patel, Mol. Cryst. Liq. Cryst., 2018, 668, 29–47 CrossRef CAS.
- A. V Lebedev, A. B. Lebedeva, V. D. Sheludyakov, E. A. Kovaleva, O. L. Ustinova and I. B. Kozhevnikov, Russ. J. Gen. Chem., 2005, 75, 1113–1124 CrossRef.
- A. R. Ranchchh and U. C. Bhoya, Mol. Cryst. Liq. Cryst., 2018, 665, 43–51 CrossRef CAS.
- H. Shimada, Yakugaku Zasshi, 1952, 72, 63–65 CrossRef CAS PubMed.
- G. Scott, Chem. Ind., 1963, 7, 271–281 Search PubMed.
- S. Saito and J. Kawabata, Tetrahedron, 2005, 61, 8101–8108 CrossRef CAS.
- M. Karamać, A. Kosińska and R. B. Pegg, Pol. J. Food Nutr. Sci., 2005, 55, 165–170 Search PubMed.
- E. Coni, R. Di Benedetto, M. Di Pasquale, R. Masella, D. Modesti, R. Mattei and E. A. Carlini, Lipids, 2000, 35, 45–54 CrossRef CAS PubMed.
- K. L. Tuck and P. J. Hayball, J. Nutr. Biochem., 2002, 13, 636–644 CrossRef CAS PubMed.
- G. M. Williams, M. J. Iatropoulos and J. Whysner, Food Chem. Toxicol., 1999, 37, 1027–1038 CrossRef CAS.
- Joint FAO/WHO Expert Committee on Food Additives, Safety Evaluation of Certain Food Additives, Meeting & World Health Organization, 2006, vol. 65 Search PubMed.
- G. Kalantzakis, G. Blekas, K. Pegklidou and D. Boskou, Eur. J. Lipid Sci. Technol., 2006, 108, 329–335 CrossRef CAS.
- M. A. Sahari, D. Ataii and M. Hamedi, J. Am. Oil Chem. Soc., 2004, 81, 585–588 CrossRef CAS.
- B. Bayram, B. Ozcelik, G. Schultheiss, J. Frank and G. Rimbach, Food Chem., 2013, 138, 1663–1669 CrossRef CAS PubMed.
- M. Andjelkovic, J. Van Camp, M. Pedra, K. Renders, C. Socaciu and R. Verhé, J. Agric. Food Chem., 2008, 56, 5181–5187 CrossRef CAS.
- Y. Zhang, L. Yang, Y. Zu, X. Chen, F. Wang and F. Liu, Food Chem., 2010, 118, 656–662 CrossRef CAS.
- M. Flores, L. Reyes-García, J. Ortiz-Viedma, N. Romero, Y. Vilcanqui, C. Rogel, J. Echeverría and O. Forero-Doria, Antioxidants, 2021, 10, 664 CrossRef CAS PubMed.
- A. Kamkar, A. J. Javan, F. Asadi and M. Kamalinejad, Food Chem. Toxicol., 2010, 48, 1796–1800 CrossRef CAS PubMed.
- X. Xu, A. Liu, S. Hu, I. Ares, M.-R. Martínez-Larrañaga, X. Wang, M. Martínez, A. Anadón and M.-A. Martínez, Food Chem., 2021, 353, 129488 CrossRef CAS PubMed.
Footnote |
| † Electronic supplementary information (ESI) available. See DOI: https://doi.org/10.1039/d4ra01638f |
| This journal is © The Royal Society of Chemistry 2024 |