 Open Access Article
Molecular mechanism of elemental sulfur dissolution in H2S under stratal conditions†
Sheng Yuana,
Ying Wanb,
Li Wangb,
Nong Lib,
Mingli Yang a,
Shengping Yuc and
Li Zhang
 *a
*a
aInstitute of Atomic and Molecular Physics, Sichuan University, Chengdu 610065, China. E-mail: lizhang@scu.edu.cn
bResearch Institute of Exploration and Development, PetroChina Southwest Oil and Gasfield Company, Chengdu 610213, China
cKey Laboratory of General Chemistry of the National Ethnic Affairs Commission, School of Chemistry and Environment, Southwest Minzu University, Chengdu 610041, China
First published on 28th May 2024
Abstract
Resulting from the solubility reduction of elemental sulfur during the development of high sulfur gas formations, sulfur deposition often occurs to reduce the gas production and threaten the safety of gas wells. Understanding the dissolution mechanism of elemental sulfur in natural gas is essential to reduce the risk caused by sulfur deposition. Because of the harsh conditions in the high-sulfur formations, it remains challenging to in situ characterize the dissolution–precipitation processes, making deficient the knowledge of sulfur dissolution mechanism. The dissolution of sulfur allotropes (SN, N = 2, 4, 6 and 8) in H2S, the main solvent of sulfur in natural gas, is studied in this work by means of first-principles calculations and molecular dynamics simulations. While S6 and S8 undergo physical interaction with H2S under the conditions corresponding to those at 1–6 km stratigraphic depths, S2 and S4 react with H2S and form stable polysulfides. Unravelling the mechanism would be helpful for understanding and controlling the sulfur deposition in high-sulfur gas development.
1. Introduction
The development of natural gas resources has become particularly important because of the increasing demand for clean energy around the world. Among the known natural gas reservoirs, those with a high-sulfur content account for a high proportion.1,2 High-sulfur gas reservoirs (HSGR) refer to reservoirs with a relatively high content (>2%) of hydrogen sulfide. In the HSGR development, sulfur deposition often occurs to block the pore throats that are abundant in the formations, remarkably lowering gas productivity.3–5 The occurrence of sulfur deposition comes from the solubility reduction of elemental sulfur in natural gas, which leads to the formation and precipitation of solid sulfur.3–7 Understanding the solubility evolution of elemental sulfur in natural gas is the basis of controlling sulfur deposition in practice.Unfortunately, little is known about the molecular mechanism of sulfur dissolution in natural gas. For example, elemental sulfur has many allotropes, such as SN (N = 2, 3, …, 8), that may coexist under the formation conditions. Their contents vary with buried depth. S2 content increases with temperature, while S8 content decreases with temperature.8 It remains unclear what the solute is among these allotropes, while H2S has been well identified as the main solvent. Furthermore, there remains controversary whether the dissolution is a chemical or a physical process. It has been reported that elemental sulfur forms H2Sn through association with H2S under the temperature and pressure that are comparable to the formation conditions.8–11 Yu et al.11 characterized the H2SN species at 120–250 °C in the S–H2S–CH4–H2O systems with Raman spectroscopy. However, the number of S atoms in the polysulfides was not addressed in the experiments. Moreover, the in situ characterization of H2SN species in high-sulfur gas formation remains challenging. Polysulfides were not detected when the experimental temperature was below 373 K,9 but detected under 393–523 K.11 In a computational study, He et al.12 reported that in the ground-state SN–H2S complexes, the interaction between SN (N = 2, 4, 6 and 8) and H2S is as weak as a typical physical interaction, but the effect of temperature was not considered. Intermolecular physical interaction was assumed in some recent molecular simulations13–16 in which the force fields describing only the non-covalent interactions were used. In practice, however, the dissolution process is treated as a chemical reaction from which the Chrastil model17 is often used to estimate the solubility variations.18–23 It can be concluded that there is not sufficient evidence to classify the sulfur dissolution in natural gas as a chemical or a physical process.
The pronounced distinctions between chemical and physical processes may lead to different strategies in controlling the sulfur deposition in natural gas development. For example, the sensitivity with respect to temperature is usually different between these two processes because of their different energy barriers. Then, different temperature control strategies should be used for these two processes. It is therefore of great significance to identify the molecular mechanism of sulfur dissolution in natural gas. In this work, we first conducted first-principles molecular dynamics (FPMD) calculations on the SN–H2S mixtures of N = 2, 4, 6 and 8, followed by quantum chemical calculations on their reaction paths and activation energies. Direct evidences are provided for the interaction between the solute and solvent molecules under a varying formation depth at which the temperature and pressure vary accordingly. Our study unravels the interaction mechanism of elementary sulfur with H2S at the atomistic level, laying a basis for the further studies of real systems with additional components of CH4, CO2, etc.
2. Computational methods
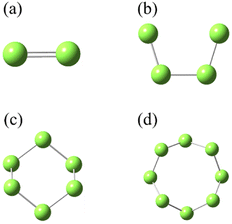
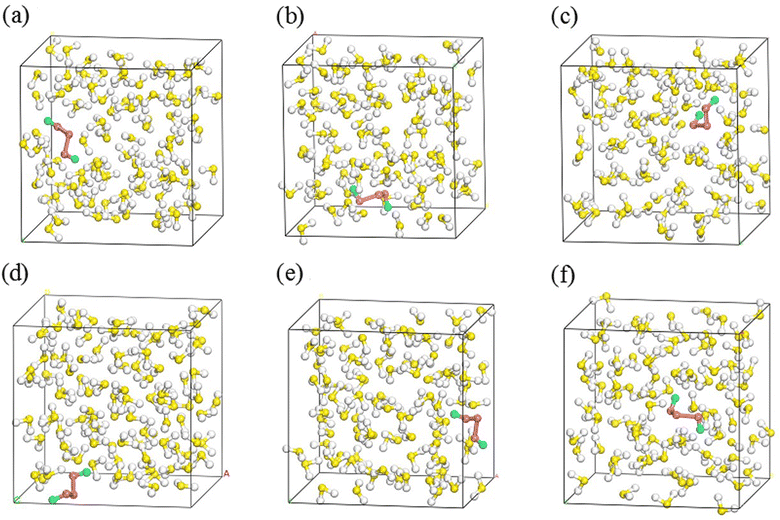
SN (N = 2, 4, 6 and 8) are selected as the solute molecules and H2S as the solvent in our FPMD simulations. The ground-state structures of these allotropes have been well characterized in previous studies.24–26 Fig. 1 illustrates the molecular structures of sulfur oligomers. S4 is a linear molecule with its two end atoms on the same side of the middle two atoms. S6 and S8 are cyclic with C3v and C4v symmetry, respectively. Given the low solubility of elemental sulfur in H2S (about 0.001 in molar ratio), the computational models are constructed by putting randomly one hundred H2S molecules and one SN molecule into a cubic box with an initial density of 0.8 g cm−3. Periodic boundary conditions are applied in the three directions. Fig. 2 illustrates the models in which S2–S8 are surrounded by H2S molecules. The side length of the cubic is about 1.95 nm, which is long enough to avoid from the interaction of two SN molecules in the adjacent boxes.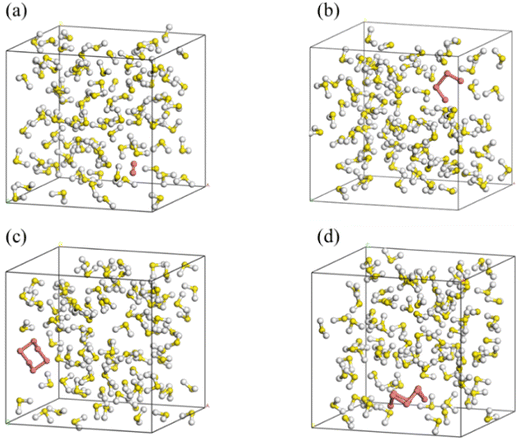 | ||
| Fig. 2 Initial simulation models of S2 (a), S4 (b), S6 (c) and S8 (d) in H2S (red for SN and others for H2S). | ||
The Born–Oppenheimer molecular dynamics (BOMD) simulations27 are carried out under the isothermal–isobaric (NPT) ensemble. The temperature is controlled by using the canonical sampling through velocity rescaling (CSVR) thermostat,28 while the pressure is controlled using the Martyna–Tobias–Klein (MTK) barostat.29 A number sets of temperature and pressure are applied by considering the geological strata at Sichuan Basin in Southwest China, which is one of the main high-sulfur gas reservoirs in the world. Table 1 lists the pressure and temperature at different depths of the geological strata, which are used in our FPMD simulations. A total of 25 ps simulations are applied for all the systems. The simulations, unless otherwise mentioned, usually reach their equilibrations within 15 ps, while the remaining time is used for data collection and analysis. The time step is set to 1 fs. All atoms in the structures underwent unconstrained relaxation to their equilibrium positions without any fixation. Energy minimization was performed using the Orbital Transformation (OT) method, and the convergence criterion was set to 10−6 atomic units (a.u.). The exchange–correlation functional of Perdew–Burke–Ernzerhof (PBE)30 with a semi-empirical DFT-D3 correction31 to the dispersion effect is used in the studied systems that are characterized by their weak intermolecular interaction. The double-ζ basis set (DZVP-MOLOPT)32 combined with Goedecker–Teter–Hutter (GTH) pseudopotentials33 are employed in the DFT calculations. The energy cutoff is set to 400 Ry in the self-consistent calculations. The FPMD calculations are performed using the CP2K package's Quickstep module.34,35
| Depth (km) | Pressure (MPa) | Temperature (K) |
|---|---|---|
| 1 | 15 | 310 |
| 2 | 30 | 340 |
| 3 | 45 | 370 |
| 4 | 60 | 400 |
| 5 | 75 | 430 |
| 6 | 90 | 460 |
The radial distribution function (RDF), denoted as g(r), stands as a frequently employed tool in statistical mechanics for characterizing the microstructure of disordered systems. The g(r) signifies the probability of finding another particle (β) at a radial distance r, with any particle (α) acting as the center. It can be mathematically expressed by16
 | (1) |
Then, the reaction paths and energy barriers for the reactions of Sn with H2S are studied by DFT calculations with B3LYP39,40/6-311++G(d,p)41 and M06-2X42/6-311++G(2d,2p),41 as implemented in the Gaussian 16 package.43 While B3LYP is known for its robust predictive power across a broad range of chemical systems, M06-2X provides enhanced accuracy particularly in systems involving complex non-covalent interactions. All the structures including reactants, intermediates, transition-state structures, and products are optimized and further verified with vibrational frequency calculations at the same level. The frequency scaling factor is 0.987 (ref. 44) under B3LYP/6-311++G(d,p), and 0.970 (ref. 45) under M06-2X/6-311++G(2d,2p). In these calculations, the long-range dispersion effect is considered by including the semi-empirical correction of DFT-D3.31 Since the FPMD simulations indicate that two H2S molecules are involved in their reactions with S2, the reaction paths with both one and two H2S molecules are designed. The synchronous transit guided quasi-Newton (STQN) method46,47 is used to search for the transition-state structure based on the optimized structures, which are further identified by their exact one imaginary frequency in vibrational spectra. The intrinsic reaction coordinate (IRC)34,48 calculations are performed to verify that the transition-state structures are able to connect contiguously the stable reactants, intermediates and products. The Shermo package49 is used to derive the thermodynamic correction terms for the computed structures. Single-point calculations at the CCSD(T)50 level with the aug-cc-pVQZ basis set51 are conducted for the optimized structures. The complete basis set (CBS) extrapolation52 is used to refine the computed values by conducting additional single-point calculations with the aug-cc-pVTZ basis set. The parameters for the CBS extrapolation are taken from the work by Neese et al.53 Finally, the single-point energy is incorporated into the calculated free energy correction to yield the Gibbs free energy (ΔG).54,55
3. Results and discussions
We first verify the validity of our computational strategy by comparing the computed density of pure H2S with the measurements.56 Fig. 3 shows the predicted and measured densities of H2S at a varying depth. The predicted values are the averaged densities obtained from the equilibrium configurations of H2S relaxed in an NPT ensemble consisting of 100 H2S molecules. The predicted densities overestimate the corresponding measurements by about 12–18%. The systematic overestimation in the predicted densities indicates the used functional and dispersion correction are inadequate to describe well the intermolecular interaction in the H2S systems. The small size of the studied model may also have a contribution to the overestimation. The gaps remain almost unchanged between the predicted and measured values in the studied temperature and pressure ranges. It should be mentioned that the critical point is about 373 K and 9 MPa for H2S,57 which is within the studied range. Nevertheless, our computations produce reliable density of pure H2S, appropriate for the comparison of the reactivity of SN allotropes with H2S.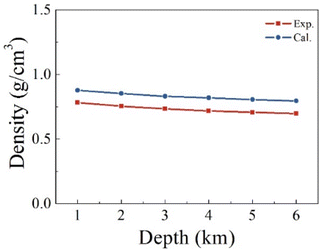 | ||
| Fig. 3 Comparison between the computed and measured density of pure H2S at a varying stratigraphic depth. The corresponding temperatures and pressures are given in Table 1. | ||
In their equilibrium configurations in the S2–H2S mixtures, a new compound, H2S3, is characterized in all the simulations at different stratigraphic depths. Fig. 4 shows the snapshots of the S2–H2S mixtures after reaching their equilibrium states. At 1 km (Fig. 4a), H2S3 is a linear molecule totally different from the combination of H2S and S2. Instead, the bonds in the system are reorganized. The three S atoms are in the middle, ended by two H atoms. The conformers of H2S3 are slightly different in the snapshots at different depths. However, it is evident that chemical reactions occur between H2S and S2 in all the cases.
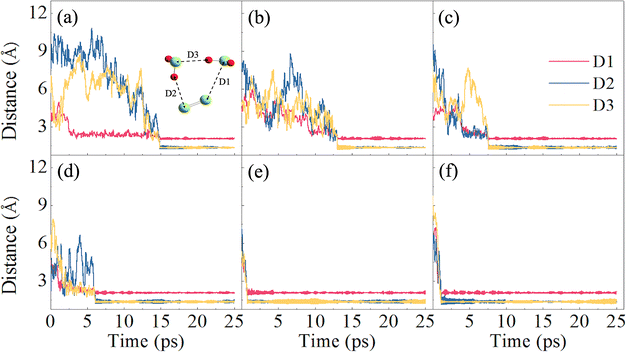
The formation of H2S3 can be illustrated by tracking the interatomic bond lengths. By analyzing the molecular configuration variations in the slides, one finds that two H2S molecules are involved in the chemical reactions. As presented in Fig. 5, the distances of three pairs, D1, D2 and D3, in H2S3 are thus defined for the involved molecules. At low temperature at 1 km, the slow rates allow us to have some details about the reaction. After 2 ps fluctuations, D1 drops to about 2.15 Å, and keeps steadily in the left time, indicating that the S atom of one H2S molecule approaches to the S atom in S2 and form a S–S bond. At about 15 ps, two S–H bonds are formed. One is formed by the other S atom in S2 with the H atom in the second H2S molecule. The other is formed by the H atom in the first H2S molecule with the S atom in the second H2S molecule. It is in fact a reaction catalyzed by the second H2S, which donates one H atom to S2 and accept one H atom from the first H2S.
Under higher temperatures at the deeper stratas, the reactions proceed in a similar path but a fast rate. For example, D1 is formed at about 5 ps at 3 km, while D2 and D3 at about 7 ps. At 5 and 6 km, the formation of the three bonds is completed within 1 ps. The averaged interatomic distances, D1, D2, and D3, in the equilibrium configurations are around 2.08, 1.37, and 1.36 Å, respectively. It is apparent that chemical bonds, one S–S and two S–H, are formed. The bond lengths are in agreement with previous studies58,59 in which the corresponding bond lengths are 2.054, 1.344, and 1.336 Å, respectively. Remember that temperature effect was not included in the previous studies.
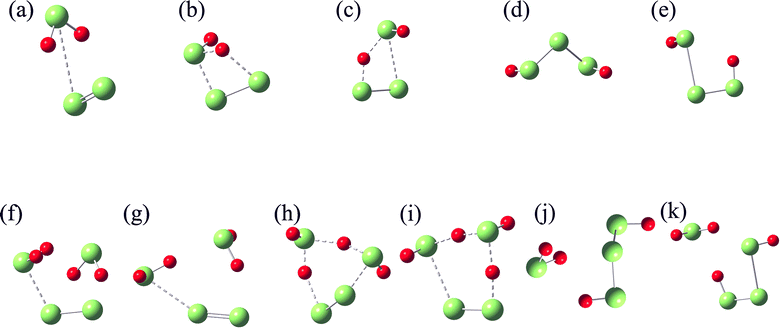
The molecules of S4, S6, and S8 have different experiences during the simulations. At all the studied stratigraphic depths, these three molecules do not show an evident reaction with H2S. As presented in Fig. S1–S3 in the ESI,† the SN molecule in the equilibrium configurations is surrounded by several H2S molecules, but none of which forms a bond with SN. In other words, only non-bonded interaction exists in the systems of H2S and SN (N = 4, 6 and 8). In the previous DFT calculations,12 the interaction energy between H2S and SN (N = 4, 6, and 8) is about 1–3 kcal mol−1, which indicates a typical physical interacting pattern between them. Under harsh conditions at the deepest strata (460 K and 90 MPa), the three molecules retain their structures, as shown in Fig. S1–S3.†
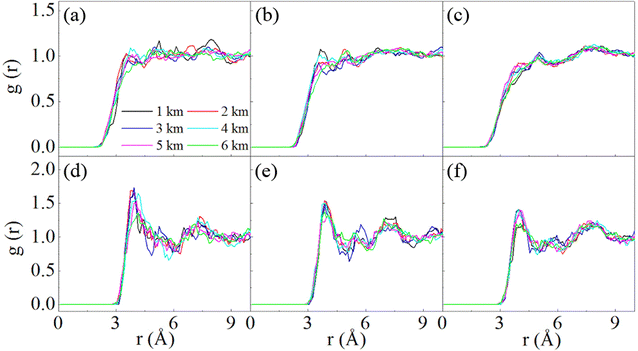
Fig. 6 shows the RDF of the mixtures of SN with H2S. The interatomic distances between the S atom in SN and H/S atom in H2S are given. For S4, the first peaks occur at 3.95 Å for the intermolecular S–S (Fig. 6d), and 3.75 Å for intermolecular S–H (Fig. 6a). It is apparent that no chemical bonds are formed between S4 and H2S at all the studied stratigraphic depths. Similar analysis can be made for S6 and S8 (Fig. 6b, c, e and f), as well as a similar conclusion that S6 and S8 do not form chemical bonds with H2S under the studied conditions. Moreover, the peaks for the intermolecular S–S pairs are outstanding, while those for the S–H pairs are ignorable. This implies that the interaction is dominated by S–S pairs. It is the S atom in H2S that interacts with SN, which is similar to the case of S2 with H2S. The attraction of S–S pairs has also been addressed in other studies.16 The four atoms in S4 may have different activity toward H2S. Fig. S4† compares the RDFs of the central and the terminal atoms with the S atom in H2S. The first peaks for these two types of atoms are similar both in position and height, and disordered H2S distributions are noted at long distances, indicating that these two atoms do not exhibit much differences when they interact toward H2S.
The dissolution of sulfur in H2S thus has two paths, chemical and physical. In the physical path, SN is surrounded by H2S via weak non-bonded forces including Coulomb, van der Waals, dispersion, polarization, etc. The solubility contributed from physical interaction is determined by the strengths of these non-bonded forces. In the chemical path, the solubility is in fact contributed by the chemical reactions of SN with H2S. Understanding the reaction mechanism is thus helpful to control the solubility variations under the stratigraphic conditions. Although our AIMD simulations indicate that S4, S6, and S8 do not react with H2S. Considering the short simulation time, further investigations on their reaction paths and their activation barriers are necessary.
From the stoichiometric view, H2S3 is the combination of one H2S molecule and one S2 molecule, but the FPMD simulations indicate that two H2S molecules sequentially interact with the S2 molecule in the reactions. Therefore, two paths are designed for the reactions, which are presented in Scheme 1. In Path I, S2 first binds with H2S, forming an intermediate (IM1) in which only weak non-bonded interaction exists between them. A reorganization then occurs in IM1 to form a transition-state structure (TS1), followed by the formation of H2S3 (P1). In Path II, its first step, the formation of IM1, is the same with Path I. In the next step, IM1 interacts with the second H2S. After the formation of a transition-state structure (TS2), H2S3 (P1) is formed, accompanied by the release of one H2S molecule. Therefore, Path I contains two steps, while Path II has three steps.
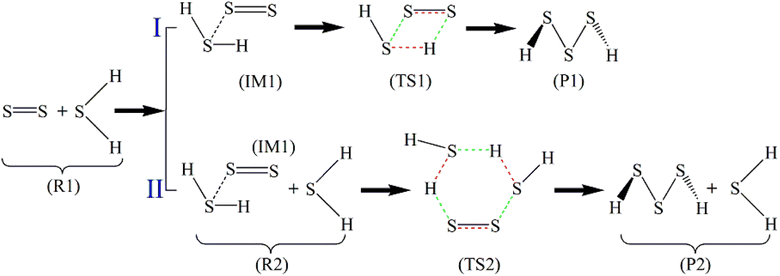 | ||
| Scheme 1 Reaction paths of S2 with H2S (the bonds to be broken are red, and those to be formed are in green). | ||
All the structures shown in Scheme 1 are optimized and further identified with vibrational frequency calculations. Their structures are shown in Fig. 7 and their energy, and Gibbs free energy at 298 K and 0.1 MPa are given in Tables 2 and S1–S4.† Considering that the triplet state of S2 is more stable by 16.98 kcal mol−1 than its singlet, and the singlet state of H2S3 is more stable by 47.29 kcal mol−1 than its triplet, both the singlet and triplet states of these structures are taken into account in the structure optimization and vibrational frequency calculations. For IM1, only the triplet structure is identified, while its singlet structure is unstable.
| R1 | IM1 | TS1 | P1 | R2 | TS2 | P2 | |
|---|---|---|---|---|---|---|---|
| a On the B3LYP/6-311++G(d,p) optimized structures.b On the M06-2X/6-311++G(2d,2p) optimized structures. | |||||||
| B3LYP/6-311++G(d,p) | 23.33 | — | 45.70 | −0.99 | 19.63 | 26.71 | −7.22 |
| (0.00) | (4.67) | (35.06) | (32.71) | (0.00) | (31.89) | (26.38) | |
| CCSD(T)/aug-cc-pVQZa | 17.63 | — | 55.39 | −6.90 | 18.01 | 25.49 | −13.40 |
| (0.00) | (4.89) | (40.89) | (36.48) | (0.00) | (41.58) | (41.58) | |
| CCSD(T)/aug-cc-pVTZa | 17.97 | — | 56.19 | −5.55 | 18.60 | 26.65 | −11.95 |
| (0.00) | (4.79) | (40.37) | (36.14) | (0.00) | (41.51) | (31.33) | |
| M06-2X/6-311++G(2d,2p) | 22.00 | — | 37.69 | −9.31 | 16.45 | 19.05 | −17.10 |
| (0.00) | (5.46) | (37.95) | (34.15) | (0.00) | (32.13) | (25.31) | |
| CCSD(T)/aug-cc-pVQZb | 17.89 | — | 37.07 | −8.48 | 15.93 | 20.14 | −16.40 |
| (0.00) | (5.41) | (40.36) | (36.29) | (0.00) | (36.54) | (27.60) | |
| CCSD(T)/aug-cc-pVTZb | 18.26 | — | 38.73 | −6.86 | 16.83 | 21.74 | −14.78 |
| (0.00) | (5.31) | (40.20) | (36.10) | (0.00) | (36.54) | (27.49) | |
| CCSD(T)/CBSb | 17.78 | — | 36.59 | −8.92 | 15.67 | 19.63 | −16.87 |
| (0.00) | (5.45) | (40.39) | (36.38) | (0.00) | (36.48) | (27.62) | |
Although structures optimized with B3LYP/6-311++G(d,p) and M06-2X/6-311++G(2d,2p) are topologically similar, they exhibit different stability at the CCSD(T) level at the CBS limit. As shown in Table 2, the ΔG values on the B3LYP-optimized structures are higher than those on the corresponding M06-2X-optimized structures. Therefore, the ΔG values obtained at the CCSD(T) level on the M06-2X structures are used for the subsequent analysis. Starting from IM1 in Path I, the H2S molecule rotates about the intermolecular S⋯S linker until one of its H atoms bonds with the other S atom in S2 to form TS1. TS1 has a four-membered ring in which the S–S double bond of S2 is weakened, and becomes a single bond. Meanwhile, its two S atoms form one S–S bond and one S–H bond with H2S, and one of the original S–H bonds is broken. P1 is then formed. Fig. 8 presents the energy landscape of Path I. The triplet structures are more stable for R1 and IM1, but less stable for TS1 and P1 than the corresponding singlet structures. A spin multiplicity transition from the triplet to the singlet states occurs in the formation of TS1. The identified energy barrier is thus between the triplet IM1 and the singlet TS1, 31.66 kcal mol−1, for Path I.
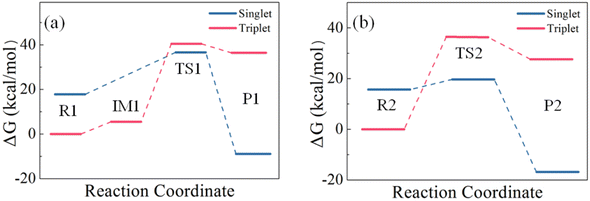 | ||
| Fig. 8 Comparison of the energy barriers of the reactions of (a) one H2S with one S2 and (b) two H2S with one S2. | ||
In Path II, starting from IM1, the second H2S forms a six-membered ring with IM1 (TS2) with its S atom linking to the H atom of the first H2S, and one of its H atoms linking to the S atom of S2. An isodesmic reaction in which the type and number of the bonds formed in the product is identical to those broken in the reactant then occurs by losing two S–H bonds and simultaneously forming two S–H bonds. In the product, the formed H2S is leaving from the H2S3. Similar to Path I, the singlet structures are more stable than the triplet structures for TS2 and P2. The energy barrier of Path II is thus between the triplet R2 and the singlet TS2, 20.14 kcal mol−1. It is evident that Path II has a lower barrier than Path I, which is attributed to the stable six-membered ring structure and the isodesmic reorganization in TS. The isodesmic reactions usually proceed under facile conditions because the required energy for the bond breaking is mostly compensated by the released energy in the bond formation.60–62 It is thus the reactions of S2 with H2S proceed by involving one S2 and two H2S molecules. In both paths, the products have lower energy than the corresponding reactants, indicating that the products are stable and the reactions are exothermic. The revealed kinetics verifies the formation of H2S3 and the reaction mechanism observed in the FPMD simulations.
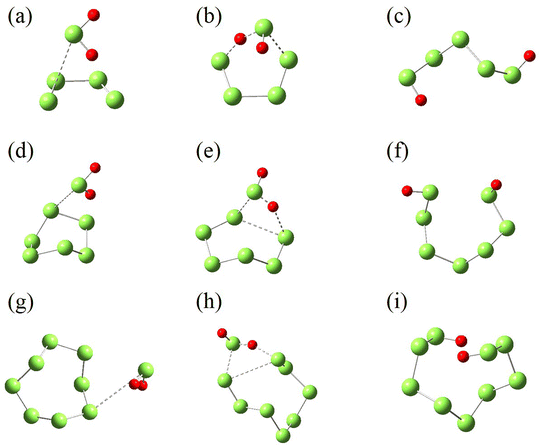
For N = 4, 6 and 8, the reactions start from the attack of S atom in H2S toward the terminal atom in S4, and one atom in S6 and S8, forming the intermediates (IM3, IM4 and IM5 in Fig. 9). Then, one of H atoms in H2S attacks the other terminal S atom in S4, forming the transition-state structure (TS3) with a six-membered ring. H2S5 is then formed by breaking the H–S bond in H2S. For S6 and S8, the transition-state structures (TS4 and TS5) have a four-membered ring consisting of two S atoms in SN and one S and one H atom in H2S. The formation of polysulfides, H2S7 and H2S9, is facilitated by the breaking of S–S bond in SN.
Fig. 10 illustrates the Gibbs free energies of the identified reactants, intermediates, transition-state structures and products shown in Fig. 9, and their optimized structures and thermodynamic parameters in Tables S12–S20 of ESI.† For the reaction of S4 with H2S, the energy barrier is 25.84 kcal mol−1, only 6.21 kcal mol−1 higher than that of S2, indicating that S4 is also reactive toward H2S. The low barrier is attributed to the reactivity of the terminal S atoms in S4, as well as the stable six-membered ring in the transition-state structure. For S6 and S8, the corresponding barriers are 54.02 and 62.54 kcal mol−1, respectively. The high barriers are mainly attributed to the bond-breaking of S–S bond, and the strain in the four-membered rings in the transition-state structures. Therefore, S6 and S8 unlikely react with H2S under typical geological conditions. The dissolution of SN allotropes in H2S has different mechanism, physical for S6 and S8, and chemical for S2 and S4.
4. Conclusions
DFT calculations and MD simulations are carried out to study the dissolution mechanism of elemental sulfur in its main solvent, H2S, in high-sulfur gas formations. The interacting models of sulfur allotropes SN (N = 2, 4, 6 and 8) with H2S molecules are created and simulated with FPMD under the temperature and pressure ranges corresponding the stratal depth of 1–6 km. While FPMD simulations indicate that only S2 is active toward H2S, quantum chemical calculations on the reaction paths reveal that both the reactions of S2 and S4 with H2S have low activation energies, contrast to the high barriers in the reactions of S6 and S8. These SN allotropes have different activities toward H2S, indicating a chemical dissolution for S2 and S4 in H2S under typical geological conditions, and a physical dissolution for S6 and S8. Our computations reveal the molecular mechanism of sulfur dissolution in H2S, which lays the groundwork for future study of the solubility evolution of elemental sulfur in natural gas.Author contributions
Sheng Yuan: conceptualization, data curation, writing original draft. Ying Wan: investigation, methodology, conceptualization. Li Wang: resources. Nong Li: validation, data curation. Mingli Yang: supervision, validation, Shengping Yu: sata curation. Li Zhang: formal analysis, methodology, conceptualization.Conflicts of interest
The authors declare no conflicts of interest.Acknowledgements
This work was supported by the National Natural Science Foundation of China (No. 22173064) and Sichuan Kelite Oil & Gas Technology Service Co. Ltd.References
- Y. Yang, L. Li, X. Wang, N. Qin, R. Zhang, Y. Zhao and Y. Tian, Simulation study of hydrogen sulfide removal in underground gas storage converted from the multilayered sour gas field, Int. J. Coal Sci. Technol., 2023, 10, 71 CrossRef CAS.
- B. Fang, J. Hu, X. Wang and Y. Zhang, Transient analysis of horizontal wells with multiple fractures in sour gas reservoirs, J. Nat. Gas Sci. Eng., 2022, 106, 104730 CrossRef CAS.
- X. Liu, S. Liu, Y. Wang, Y. Xiang, C. Qing, H. Zhang, H. Ren and C. Li, Estimation method of heterogeneous sulfur saturation distribution in high sulfur content gas reservoirs based on well test data, Environ. Earth Sci., 2023, 82, 115 CrossRef CAS.
- X. Guo, P. Wang, J. Ma and C. Jia, Numerical simulation of sulfur deposition in wellbore of sour-gas reservoir, Processes, 2022, 10, 1743 CrossRef CAS.
- C. Zou, X. Wang, J. Hu, Y. Lv, B. Fang and Y. Zhang, A novel model for predicting the well production in high-sulfur-content gas reservoirs, Geofluids, 2021, 2021, 6658711 Search PubMed.
- X. Guo, P. Wang, J. Ma and T. Li, Experiment on gas–liquid sulfur relative permeability under high-temperature high-pressure sour gas reservoir condition, Processes, 2022, 10, 2129 CrossRef CAS.
- M. Shao, Q. Yang, B. Zhou, S. Dai, T. Li and F. Ahmad, Effect of sulfur deposition on the horizontal well inflow profile in the heterogeneous sulfur gas reservoir, ACS Omega, 2021, 6, 5009–5018 CrossRef CAS PubMed.
- R. A. Heidemann, A. V. Phoenix, K. Karan and L. A. Behie, A chemical equilibrium equation of state model for elemental sulfur and sulfur-containing fluids, Ind. Eng. Chem. Res., 2001, 40, 2160–2167 CrossRef CAS.
- P. Cézac, J. P. Serin, J. Mercadier and G. Mouton, Modelling solubility of solid sulphur in natural gas, Chem. Eng. J., 2007, 133, 283–291 CrossRef.
- C. Li, G. Liu and Y. Peng, Solution mechanism of elemental sulfur in hydrogen sulfide under conditions of natural gas transmission, Ind. Eng. Chem. Res., 2018, 58, 440–447 CrossRef.
- Y. Yu, W. Hu, I.-M. Chou, L. Jiang, Y. Wan, Y. Li, Y. Xin and X. Wang, Species of sulfur in sour gas reservoir: Insights from in situ Raman spectroscopy of S–H2S–CH4–H2O system and its subsystems from 20 to 250 °C, Geofluids, 2021, 2021, 6658711 Search PubMed.
- L. He, L. Zhang, Y. Wan, N. Li and Y. Ren, Structures and energetics of elemental sulfur in hydrogen sulfide, J. Cluster Sci., 2022, 33, 1157–1164 CrossRef CAS.
- X. Cui, W. Wang, M. Du, D. Ma and X. Zhang, Molecular simulation to explore the dissolution behavior of sulfur in carbon disulfide, Molecules, 2022, 27, 4402 CrossRef CAS PubMed.
- H. Chen, C. Liu and X. Xu, Molecular dynamic simulation of sulfur solubility in H2S system, Int. J. Mod. Phys. B, 2019, 33, 1950052 CrossRef CAS.
- M. F. P. Mojdehi, M. G. Koli, M. D. O. Bolagh, M. G. Gardeh and S. M. Hashemianzadeh, A detailed computational study on binding of kinase inhibitors into β-cyclodextrin: Inclusion complex formation, Mol. Syst. Des. Eng., 2021, 6, 80–92 RSC.
- Y. Wei, L. Wang, Y. Yang, L. Wen, X. Huo, L. Zhang and M. Yang, Molecular mechanism in the solubility reduction of elemental sulfur in H2S/CH4 mixtures: A molecular modeling study, Fluid Phase Equilib., 2023, 569, 113764 CrossRef CAS.
- J. Chrastil, Solubility of solids and liquids in supercritical gases, J. Phys. Chem., 1982, 86, 3016–3021 CrossRef CAS.
- J. H. Hu, J. Z. Zhao, L. Wang, L. Y. Meng and Y. M. Li, Prediction model of elemental sulfur solubility in sour gas mixtures, J. Nat. Gas Sci. Eng., 2014, 18, 31–38 CrossRef CAS.
- Q. Wang, X. Guo and R. Leng, In-depth study on the solubility of elemental sulfur in sour gas mixtures based on the Chrastil's association model, Petroleum, 2016, 2, 425–434 CrossRef.
- G. Sodeifian, C. Garlapati, F. Razmimanesh and H. Nateghi, Solubility measurement and thermodynamic modeling of pantoprazole sodium sesquihydrate in supercritical carbon dioxide, Sci. Rep., 2022, 12, 7758 CrossRef CAS PubMed.
- S. A. Sajadian, H. Peyrovedin, K. Zomorodian and M. Khorram, Using the supercritical carbon dioxide as the solvent of Nystatin: Studying the effect of co-solvent, experimental and correlating, J. Supercrit. Fluids, 2023, 194, 105858 CrossRef CAS.
- G. Sodeifian, L. Nasri, F. Razmimanesh and M. A. Nooshabadi, Solubility of ibrutinib in supercritical carbon dioxide (Sc–CO2): Data correlation and thermodynamic analysis, J. Chem. Thermodyn., 2023, 182, 107050 CrossRef CAS.
- X. Guo and Q. Wang, A new prediction model of elemental sulfur solubility in sour gas mixtures, J. Nat. Gas Sci. Eng., 2016, 31, 98–107 CrossRef CAS.
- M. Kumar and J. S. Francisco, Elemental sulfur aerosol-forming mechanism, Proc. Natl. Acad. Sci. U. S. A., 2017, 114, 864–869 CrossRef CAS PubMed.
- Y. Jin, G. Maroulis, X. Kuang, L. Ding, C. Lu, J. Wang, J. Lv, C. Zhang and M. Ju, Geometries, stabilities and fragmental channels of neutral and charged sulfur clusters: SnQ (n = 3–20, Q = 0, ±1), Phys. Chem. Chem. Phys., 2015, 17, 13590–13597 RSC.
- R. Jones and P. Ballone, Density functional and Monte Carlo studies of sulfur. I. Structure and bonding in Sn rings and chains (n = 2–18), J. Chem. Phys., 2003, 118, 9257–9265 CrossRef CAS.
- V. Bakken, J. M. Millam and H. Bernhard Schlegel, Ab initio classical trajectories on the Born–Oppenheimer surface: Updating methods for Hessian-based integrators, J. Chem. Phys., 1999, 111, 8773–8777 CrossRef CAS.
- G. Bussi, D. Donadio and M. Parrinello, Canonical sampling through velocity rescaling, J. Chem. Phys., 2007, 126, 014101 CrossRef PubMed.
- G. J. Martyna, D. J. Tobias and M. L. Klein, Constant pressure molecular dynamics algorithms, J. Chem. Phys., 1994, 101, 4177–4189 CrossRef CAS.
- J. P. Perdew, K. Burke and M. Ernzerhof, Generalized gradient approximation made simple, Phys. Rev. Lett., 1996, 77, 3865 CrossRef CAS PubMed.
- S. Grimme, J. Antony, S. Ehrlich and H. Krieg, A consistent and accurate ab initio parametrization of density functional dispersion correction (DFT-D) for the 94 elements H–Pu, J. Chem. Phys., 2010, 132, 15104 CrossRef PubMed.
- J. Vande Vondele and J. Hutter, Gaussian basis sets for accurate calculations on molecular systems in gas and condensed phases, J. Chem. Phys., 2007, 127, 114105 CrossRef PubMed.
- S. Goedecker, M. Teter and J. Hutter, Separable dual-space Gaussian pseudopotentials, Phys. Rev. B: Condens. Matter Mater. Phys., 1996, 54, 1703 CrossRef CAS PubMed.
- C. Gonzalez and H. B. Schlegel, An improved algorithm for reaction path following, J. Chem. Phys., 1989, 90, 2154–2161 CrossRef CAS.
- T. D. Kühne, M. Iannuzzi, M. Del Ben, V. V. Rybkin, P. Seewald, F. Stein, T. Laino, R. Z. Khaliullin, O. Schütt and F. Schiffmann, CP2K: An electronic structure and molecular dynamics software package-Quickstep: Efficient and accurate electronic structure calculations, J. Chem. Phys., 2020, 152, 194103 CrossRef PubMed.
- K. Wang, B. Zhang and T. Kang, Effect of geological depths on CH4 adsorption, diffusion, and swelling in kaolinite by molecular simulations, Energy Fuels, 2020, 34, 1620–1626 CrossRef CAS.
- H. Wu, L. Wen, L. Zhang, D. Wang, N. Li and M. Yang, Gas adsorption capacity of type-II kerogen at a varying burial depth, Energy Fuels, 2022, 36, 7472–7482 CrossRef CAS.
- W. Humphrey, A. Dalke and K. Schulten, VMD: visual molecular dynamics, J. Mol. Graphics, 1996, 14, 33–38 CrossRef CAS PubMed.
- C. Lee, W. Yang and R. G. Parr, Development of the Colle-Salvetti correlation-energy formula into a functional of the electron density, Phys. Rev. B: Condens. Matter Mater. Phys., 1988, 37, 785–789 CrossRef CAS PubMed.
- A. D. Becke, Density-functional exchange-energy approximation with correct asymptotic behavior, Phys. Rev. A, 1988, 38, 3098–3100 CrossRef CAS PubMed.
- M. J. Frisch, J. A. Pople and J. S. Binkley, Self-consistent molecular orbital methods 25. Supplementary functions for Gaussian basis sets, J. Chem. Phys., 1984, 80, 3265–3269 CrossRef CAS.
- Y. Zhao and D. G. Truhlar, The M06 suite of density functionals for main group thermochemistry, thermochemical kinetics, noncovalent interactions, excited states, and transition elements: two new functionals and systematic testing of four M06-class functionals and 12 other functionals, Theor. Chem. Acc., 2008, 120, 215–241 Search PubMed.
- M. J. Frisch, G. W. Trucks, H. B. Schlegel and et al., Gaussian 16, Revision B.01, Gaussian, Inc., Wallingford, CT, 2016 Search PubMed.
- J. P. Merrick, D. Moran and L. Radom, An evaluation of harmonic vibrational frequency scale factors, J. Phys. Chem. A, 2007, 111, 11683–11700 CrossRef CAS PubMed.
- I. Alecu, J. Zheng, Y. Zhao and D. G. Truhlar, Computational thermochemistry: scale factor databases and scale factors for vibrational frequencies obtained from electronic model chemistries, J. Chem. Theory Comput., 2010, 6, 2872–2887 CrossRef CAS PubMed.
- C. Peng and H. Bernhard Schlegel, Combining synchronous transit and quasi-newton methods to find transition states, Isr. J. Chem., 1993, 33, 449–454 CrossRef CAS.
- C. Peng, P. Y. Ayala, H. B. Schlegel and M. J. Frisch, Using redundant internal coordinates to optimize equilibrium geometries and transition states, J. Comput. Chem., 1996, 17, 49–56 CrossRef CAS.
- C. Gonzalez and H. B. Schlegel, Reaction path following in mass-weighted internal coordinates, J. Phys. Chem., 1990, 94, 5523–5527 CrossRef CAS.
- T. Lu and Q. Chen, Shermo: A general code for calculating molecular thermochemistry properties, Comput. Theor. Chem., 2021, 1200, 113249 CrossRef CAS.
- K. Raghavachari, G. W. Trucks, J. A. Pople and M. Head-Gordon, A fifth-order perturbation comparison of electron correlation theories, Chem. Phys. Lett., 1989, 157, 479–483 CrossRef CAS.
- D. E. Woon and T. H. Dunning Jr, Gaussian basis sets for use in correlated molecular calculations. III. The atoms aluminum through argon, J. Chem. Phys., 1993, 98, 1358–1371 CrossRef CAS.
- K. A. Peterson, D. E. Woon and T. H. Dunning Jr, Benchmark calculations with correlated molecular wave functions. IV. The classical barrier height of the H + H2 → H2 + H reaction, J. Chem. Phys., 1994, 100, 7410–7415 CrossRef CAS.
- F. Neese, A. Hansen and D. G. Liakos, Efficient and accurate approximations to the local coupled cluster singles doubles method using a truncated pair natural orbital basis, J. Chem. Phys., 2009, 131, 064103 CrossRef PubMed.
- J. Luo, C. Cui, S. Sun, Z. Hu, R. Ma, M. Wang and J. Lin, Leveraging CO2 to directionally control the H2/CO ratio in continuous microwave pyrolysis/gasification of waste plastics: Quantitative analysis of CO2 and density functional theory calculations of regulation mechanism, Chem. Eng. J., 2022, 435, 134794 CrossRef CAS.
- S. Liu, L. Shan, G. Li, B. S. Underwood and C. Qi, Molecular-based asphalt oxidation reaction mechanism and aging resistance optimization strategies based on quantum chemistry, Mater. Des., 2022, 223, 111225 CrossRef CAS.
- N. Sakoda and M. Uematsu, A thermodynamic property model for fluid phase hydrogen sulfide, Int. J. Thermophys., 2004, 25, 709–737 CrossRef CAS.
- A. Cubitt, C. Henderson, L. Staveley, I. Fonseca, A. Ferreira and L. Lobo, Some thermodynamic properties of liquid hydrogen sulphide and deuterium sulphide, J. Chem. Thermodyn., 1987, 19, 703–710 CrossRef CAS.
- M. Liedtke, K. Yamada, G. Winnewisser and J. Hahn, Molecular structure of cis-and trans-H2S3, J. Mol. Struct., 1997, 413, 265–270 CrossRef.
- R. L. Cook, F. C. De Lucia and P. Helminger, Molecular force field and structure of hydrogen sulfide: recent microwave results, J. Mol. Struct., 1975, 28, 237–246 CrossRef CAS.
- W. J. Hehre, R. Ditchfield, L. Radom and J. A. Pople, Molecular orbital theory of the electronic structure of organic compounds. V. Molecular theory of bond separation, J. Am. Chem. Soc., 1970, 92, 4796–4801 CrossRef CAS.
- S. E. Wheeler, K. N. Houk, P. v. R. Schleyer and W. D. Allen, A hierarchy of homodesmotic reactions for thermochemistry, J. Am. Chem. Soc., 2009, 131, 2547–2560 CrossRef CAS PubMed.
- J. Xue, Y. S. Zhang, Z. Huan, J. D. Yang and J. P. Cheng, Deoxygenation of phosphine oxides by PIII/PV = O redox catalysis via successive isodesmic reactions, J. Am. Chem. Soc., 2023, 145, 15589–15599 CrossRef CAS PubMed.
Footnote |
| † Electronic supplementary information (ESI) available. See DOI: https://doi.org/10.1039/d4ra01764a |
| This journal is © The Royal Society of Chemistry 2024 |

