 Open Access Article
Humidity-tolerant and highly sensitive gas sensor for hydrogen sulfide based on WO3 nanocubes modified with CeO2
Zhixiang Denga,
Zhixuan Wub,
Xinkuan Liua,
Zhengai Chenb,
Yan Sun *b,
Ning Dai
 b and
Meiying Ge*c
aSchool of Material and Chemistry, University of Shanghai for Science and Technology, Shanghai 200093, China. E-mail: d18816470611@163.com
bState Key Laboratory of Infrared Physics, Shanghai Institute of Technical Physics, Chinese Academy of Sciences, Shanghai 200083, China. E-mail: sunny@mail.sitp.ac.cn
cNational Engineering Research Center for Nanotechnology, Shanghai 200241, PR China. E-mail: meiyingge@163.com
First published on 8th May 2024
Abstract
The influence of ambient humidity on the gas-sensing characteristics of metal oxide semiconductors has been one of the greatest obstacles for gas-sensing applications. In this paper, the pure WO3 and CeO2-modified WO3 nanocubes were prepared by a simple hydrothermal method, and their gas-sensing characteristics in dry and humid atmospheres were investigated. The results show that CeO2/WO3 demonstrated excellent gas-sensing properties toward H2S with high sensitivity and high selectivity at 115 °C. Noteworthy, the humidity independence of the CeO2/WO3 increased compared to the WO3. The response retentions over the whole humidity range of the CeO2/WO3-6 and CeO2/WO3-15 sensors were 70.3, and 76%, respectively, which were much higher than the WO3 sensor (17.9%). The gas-sensing mechanism of CeO2-modified WO3 is discussed based on the gas sensitivity properties. The obtained results provide a promising route to enhance the anti-humidity properties of metal oxide semiconductor gas sensors.
1. Introduction
Hydrogen sulfide (H2S) is a flammable and highly toxic gas, that is widespread in nature and industrial processes. Inhalation of this gas by human beings can easily lead to paralysis of the central nervous system and respiratory system or even death. Consequently, highly sensitive, reliable, and stable H2S sensors are in great demand. Metal oxide semiconductors (MOS) gas sensors have become one of the most practical gas sensors due to their high sensitivity, low power consumption, real-time monitoring, and portability.1–3 However, atmosphere water vapor (H2O) will affect the sensitivity and accuracy of the practical detection to H2S. Consequently, eliminating the humidity cross-sensitivity is a challenge that needs to be solved.4–6Recently, various strategies have been explored to suppress the humidity dependence of gas-sensing properties.7–10 Endowing the sensing material with hydrophobic properties could efficiently prevent the H2O molecules from contacting with the sensing surface, and enhance the anti-humidity property of the gas sensor.11–13 Gao et al. synthesized the hydrophobic sensing material by coating the polydimethylsiloxane layer onto the Pd/TiO2 surface. The sensors exhibited excellent humidity resistance when humidity was varied across a wide range (0–90% RH).14 Jia et al. coated the surface of ZnSnO3 hollow microspheres with 1H,1H,2H,2H-perfluorodecyltriethoxysilane (PFDS) layer. The PFDS/ZnSnO3 sensors maintained a stable response as the condition changed from dry to 80% RH.15 Although the anti-humidity property was highly improved by surface modifications, their gas-sensing properties were inevitably suppressed because the active sites of the sensing surface were covered by the hydrophobic layers. Loading or doping of the materials with high affinity to H2O molecules has been verified effective in promising humidity resistance of gas sensors.16,17 Choi et al. overcame the humidity dependence problems of gas sensors by loading the CuO to SnO2 hollow spheres. The CuO acts as a hydroxyl absorber to preferentially capture water vapor and form a Cu–OH bond. The sensing materials exhibited nearly consistent responses toward H2S in humidity variation.18 Jeong et al. suppressed the humidity dependence by introducing the calcium silicate nanosheet as a water-trapping layer in SnO2 nanowires. The sensors achieved high humidity resistance in NO2 gas sensing.19 However, the water-trapping effect may easily get saturated, when the sensors are exposed to highly humid atmospheres. Additionally, their selectivity and gas sensitivity will be partially reduced due to their complex modulation methods. To date, the design of the gas sensor that simultaneously possesses excellent gas-sensing properties and humidity resistance is still in the initial stages, and requires an efficient new route to further breakthroughs in high and continuously changing humidity.
Herein, we achieved the enhancement in both the gas sensing and humidity-resistant properties of the MOS-based gas sensors by employing the CeO2-modified WO3 as the sensing material. The gas-sensing properties of WO3 with different CeO2 loading concentrations were investigated to understand the anti-humidity mechanism. The main focus of this work is to design CeO2/WO3 heterojunction and confirm the optical CeO2 lading concentration to increase the humidity independence of the gas-sensing properties and accomplish high sensitivity and selectivity towards H2S in highly humid environments.
2. Experimental section
2.1. Chemicals and materials
All of the chemical reagents are of analytical grade and used without purification, including sodium tungstate dehydrate (Na2WO4·2H2O, A. R. Aladdin), cerium acetate hydrate ((CH3CO2)3Ce·xH2O, A. R. Aladdin). All chemicals were used as received without any purification.2.2. Preparation of CeO2-modified WO3 nanocubes
The WO3 nanocubes were fabricated via the hydrothermal process reported before.20 The CeO2-modified WO3 was obtained by a secondary hydrothermal process using cerium acetate ((CH3CO2)3Ce·xH2O) as the Ce source, the synthesis route is shown in Fig. 1a. 0.232 g WO3 powder was dispersed in ethanol solution and stirred continuously for 20 min, followed by adding 10 mL cerium acetate solution to the mixture. The mixing solution was transferred to the 100 mL Teflon-lined stainless autoclave and subjected to hydrothermal reaction at 180 °C for 12 h. The synthesized powder was collected and alternately washed with deionized water and ethanol, then dried for subsequent use. The CeO2/WO3 composites with different Ce concentrations (0.5 at%, 2 at%, 6 at%, 15 at%) were obtained by adjusting the concentration of the cerium acetate solution. These samples are labeled as CeO2/WO3-0.5, CeO2/WO3-2, CeO2/WO3-6, and CeO2/WO3-15 with Ce concentrations 0.5 at%, 2 at%, 6 at%, 15 at%, and the pure WO3 nanocubes is labeled as WO3.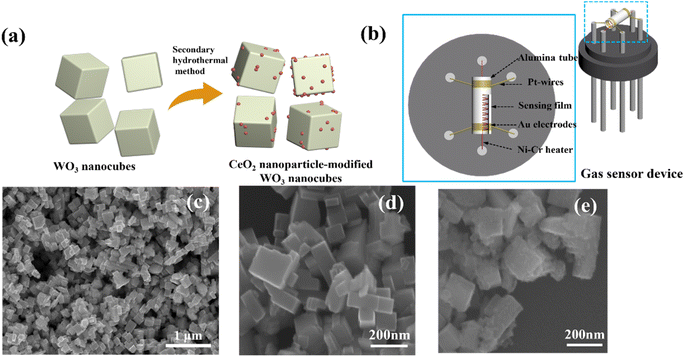 | ||
| Fig. 1 (a) Synthetic route of the CeO2-modified WO3 nanocubes; (b) the structure diagram of the sensor device; typical SEM images of (c and d) WO3 nanocubes and (e) CeO2-modified WO3 nanocubes. | ||
2.3. Material characterization
The morphology of materials was characterized by scanning electron microscopy (SEM, FEI Sirion 200, FEI, The Netherlands) and transmission electron microscopy (TEM, FEI Tecnai G2 F20 S-YWIN). The crystal structure of materials was investigated by powder X-ray diffraction (XRD, D/max-2600PC, Rigaku Corporation, Tokyo, Japan). The surface composition and chemical state were measured by an X-ray photoelectron spectrometer (XPS, ESCALAB 250Xi, Thermo Scientific, Waltham, MA, USA).2.4. Fabrication and evaluation of gas sensors
The fabrication of the gas sensor is described as follows. First, a proper amount of sample was dispersed into distilled water to form the paste. Then, the paste was coated onto a ceramic tube to develop the sensing layer, followed by annealing at 500 °C for 2 h in air. The corresponding gas sensor device structure is displayed in Fig. 1b. The gas-sensing properties of the as-fabricated sensor were measured by a WS-30A system (Winsen Electronics Technology Co., Ltd, Zhengzhou, China). The response was defined as the ratio of the sensor resistance (Ra) in the air to the sensor resistance (Rg) in the target gas. The response and recovery time were defined as the times of the gas sensor reaching 90% of its resistance changes upon exposure to the target gas and to the air.3. Result and discussion
3.1. Characterizations of materials
The morphology and microstructure of the materials were characterized by SEM and TEM images. As shown in Fig. 1c and d, the microstructure of the pure WO3 is composed of typical nanocubes, and the length size is 80–150 nm. After the CeO2 modification, the surface of WO3 nanocubes appears more rough and uneven according to Fig. 1e.To investigate the more detailed morphology and characteristics of CeO2-modified WO3, we selected typical samples for TEM characterization. As recorded in Fig. 2a–f, the CeO2 particles attach randomly on the WO3 surface. The intensity of CeO2 nanoparticles on the WO3 nanocube surfaces increases as the CeO2 loading concentration increases. However, as the CeO2 concentration further increases to the maximum, these CeO2 nanoparticles are very compactly distributed on the surface of WO3 and form a stacking layer. The sensing surface of the WO3 nanocube is wrapped by the CeO2 nanoparticle layer, which may significantly affect the surface defects and absorption sites for the sensing layer. More detailed crystalline features of the CeO2-modified WO3 nanocubes have been characterized by HRTEM images of the typical samples, as shown in Fig. 2g and h. The nanoparticles with an average diameter of 5–10 nm on the nanotube can be clearly visible. The crystal plane spacing of 0.313 nm and 0.314 nm correspond to the (111) plane of cubic CeO2.21 Additionally, the lattice fringes of 0.364 nm and 0.363 nm correspond to the (200) plane of monoclinic WO3.22
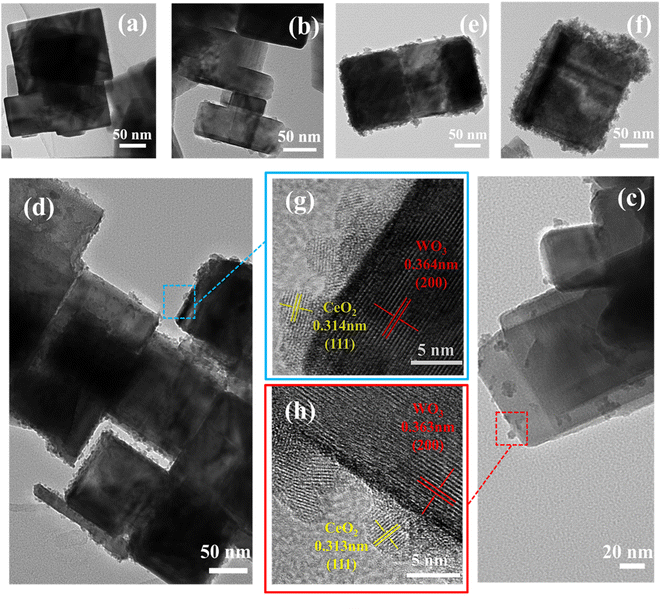 | ||
| Fig. 2 Low-magnification TEM image of (a) WO3 nanocubes, (b) CeO2/WO3-0.5, (c) CeO2/WO3-2, (d and e) CeO2/WO3-6, (f) CeO2/WO3-15; corresponding HRTEM images of the marked positions (g and h). | ||
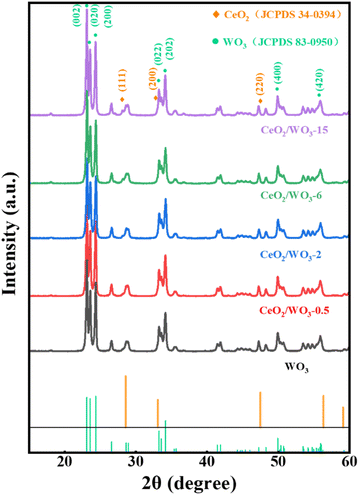
X-ray powder diffraction was employed to analyze the phases and crystal structure of the materials. As can be seen in Fig. 3, the diffraction peaks at 23.2°, 23.6°, 24.4°, 33.3°, 34.2°, 49.9°, and 55.9° correspond to the (002), (020), (200), (022), (202), (400) and (420) crystallographic facets of the monoclinic WO3 (JCPDS 83-0950), respectively.23 It indicates that the WO3 nanocubes are well crystallized, which is consistent with the TEM results. Apart from the peaks that belong to the WO3, the diffraction peaks of CeO2/WO3 located at 28.5°, 33.1°, and 47.5° correspond to the (111), (200), (220) planes of fluorite cubic CeO2 (JCPDS 34-0394).24
XPS analysis was employed to further investigate the surface elemental composition and the chemical state of the materials. The W 4f narrow-scanning spectrum of the CeO2/WO3-2 is shown in Fig. 4a. The two peaks are attributed to the W 4f7/2 W 4f5/2 state of WO3, respectively.25 As recorded in Fig. 4b, it indicates that there is a certain amount of Ce3+ existence in CeO2/WO3-2. This may be attributable to the unique chemical properties of CeO2. Due to the high mobility of lattice oxygen of CeO2, the unstable lattice oxygen may be transported and adsorbed on the surface of the WO3 nanocubes. Ce4+ will form Ce3+ by capturing the electrons left behind by the lattice oxygen, potentially resulting in the formation of oxygen vacancies.26,27
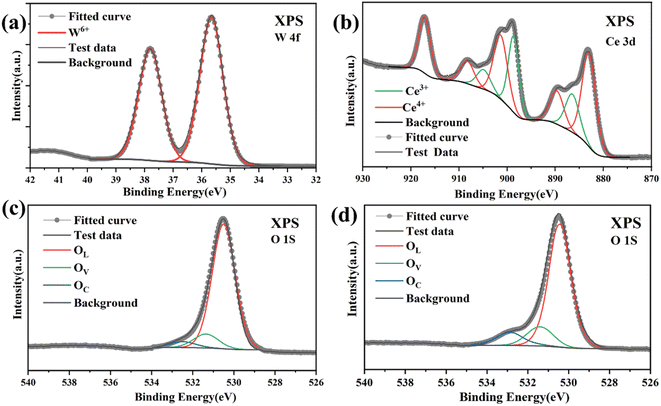 | ||
| Fig. 4 XPS analysis of (a) W 4f; (b) Ce 3d of CeO2/WO3-2; (c) O 1s spectra of pure WO3. (d) O 1s spectra of CeO2/WO3-2. | ||
It is well known that the gas-sensing properties are closely related to the oxygen adsorption on the sensing surface.28 To verify the oxygen adsorption state of the materials. The O 1s XPS pattern of CeO2/WO3-2 is displayed in Fig. 4d. The pattern can be deconvoluted into three peaks located at 530.45 eV, 531.40 eV, and 532.75 eV, which correspond to lattice oxygen species (OL), oxygen vacancies (OV), and adsorbed oxygen species (OC), respectively.29 The O 1s XPS spectrum of WO3 is shown in Fig. 4c. It is obvious that both the intensity and area of the OC peak are smaller than the results of CeO2-modified WO3. This suggests that CeO2 modification has resulted in a higher adsorption capacity of the WO3 nanocubes for chemisorbed oxygen species. Therefore, the ability of chemisorbing oxygen highly contributes to the gas-sensing toward H2S gas.
3.2. Gas sensing performance
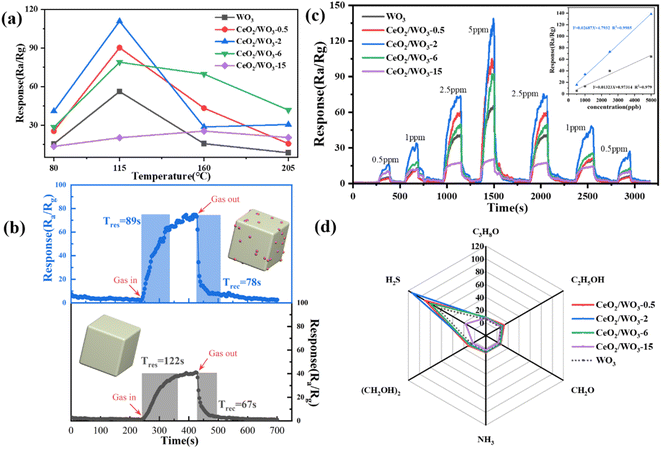
To investigate the effect of CeO2 modification on the gas-sensing properties, the WO3 and CeO2/WO3 were employed as sensing materials to prepare gas sensor devices. It is well known that the operating temperature significantly affects the gas-sensing properties of the gas sensors. The response of the sensors to 5 ppm H2S gas at different operating temperatures of 80 °C, 115 °C, 160 °C, and 205 °C are shown in Fig. 5a. The response gradually increases with a temperature rise from 80 °C to 115 °C, which may be caused by two factors. One aspect is that the temperature increase enables the gas molecules to overcome the activation energy barrier of the surface reaction. The other is that the carrier concentration of sensing layer rises with increasing the operating temperature, which promotes the adsorption of chemisorbed oxygen on the surface. However, the response decreases with further increasing the operating temperature to 205 °C. The decrease in response can be attributed to the significant desorption of gas molecules at higher temperatures, thereby impeding the gas-sensing reaction. Therefore, it could be confirmed that the optimal working temperature of the gas sensor is 115 °C. The sensors in this work show the best response at a much lower temperature relative to the results reported previously, which means lower power consumption for sensors in practical applications.30 All subsequent gas-sensing properties were investigated at an operating temperature of 115 °C.As can be seen in Fig. 5a, the response values of sensors have been significantly improved for CeO2/WO3-0.5 and CeO2/WO3-2. However, the response values deteriorate notably for further increasing the concentration of CeO2. The CeO2/WO3-2 sensor exhibits the maximum response (Ra/Rg = 113) to 5 ppm H2S gas, which is significantly higher than the WO3 sensor under identical conditions. The enhanced response performance is attributed to the modification of CeO2 nanoparticles. Based on the TEM image, the CeO2 nanoparticles are randomly distributed on the surface of WO3 nanocubes. For the CeO2-modified WO3, such ultrafine CeO2 nanoparticles might have endowed CeO2 with a highly active surface and formed the CeO2/WO3 heterojunction to promote the gas-sensing properties. When the CeO2 nanoparticle loading concentration increases to a certain amount, the excess CeO2 nanoparticles on the WO3 nanocube surfaces hinder electron transport and reduce the efficiency of the gas-sensing reaction.31 This reveals that a suitable amount of CeO2 modification can effectively enhance the response properties of WO3 nanocubes to H2S gas.
The response and recovery properties of gas sensors are also additional parameters in practical applications. Fig. 5b shows the response and recovery time curves of the WO3 sensor and CeO2/WO3-2 sensor to 2.5 ppm H2S. It is observed that the response time of the CeO2/WO3-2 sensor is shorter than the WO3 sensor. To further investigate the response characteristics of the gas sensors, Fig. 5c presents the dynamic response curves of the sensors to 0.5–5 ppm H2S. As shown, the response of CeO2/WO3-2 is significantly higher than the WO3 sensor at different H2S gas concentrations. It is observed that the response values of sensors rise with increasing H2S gas concentration. Additionally, the inset in Fig. 5c demonstrates the linear fitting function curves based on the response and concentration. The fitting coefficient (R2) of the CeO2/WO3-2 sensor is also significantly higher than the WO3 sensor, which indicates the CeO2/WO3-2 sensor possesses better linearity.
Selectivity is another important parameter in terms of gas sensors. The selectivity of the sensors was studied by measuring the response to C3H8O, C2H5OH, CH2O, NH3, (CH2OH)2, and H2S gas. The responses of the sensors to different volatile gases are shown in Fig. 5d. It can be seen that the response of the sensors to H2S is significantly higher than those for other volatile gases. The results indicate that all the sensors showed a high selectivity to H2S against other gases.
3.3. Anti-humidity performance
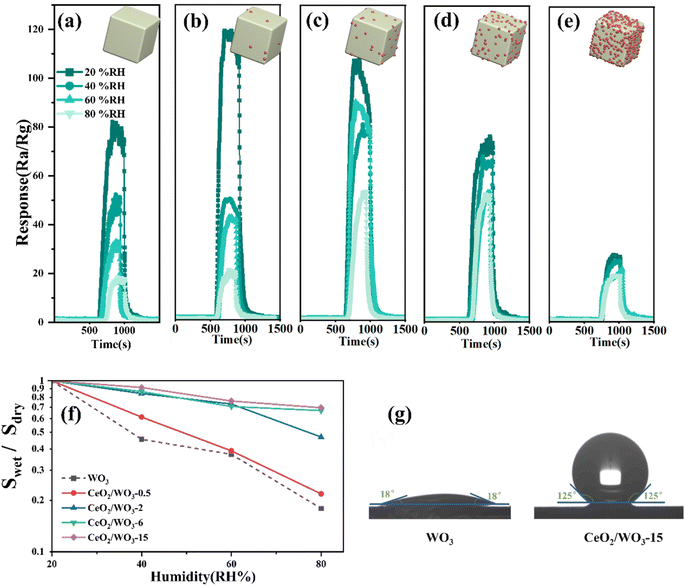
The response–recovery curves of the WO3 sensor and CeO2/WO3 sensors to 5 ppm H2S under relative humidity (RH) in the range of 20–80% are presented in Fig. 6a–e. The plot of response retention as a function of relative humidity for different sensors is shown in Fig. 6f. As presented in Fig. 6a, the response value of the WO3 sensor decreases significantly with the humidity increasing from 20% RH to 80% RH. As shown in Fig. 6f, the response of the WO3 sensor measured under 60% RH and 80% RH was only 37.2%, and 17.9% compared with that measured under 20% RH. It indicates that the WO3 sensor exhibited a typical humidity dependence on the H2S gas-sensing process.The response curves of CeO2/WO3 sensors across various humidity conditions are shown in Fig. 6b–e. Notably, the humidity dependence is slightly mitigated, when the Ce concentration is 0.5–2 at%. As the CeO2 loading concentration further increases, the response CeO2/WO3-6 and CeO2/WO3-15 exhibited much lower degradation over the whole humidity range, compared to the other sensors. When the relative humidity changed from 20% RH to 80% RH, the response retentions of CeO2/WO3-6 and CeO2/WO3-15 were 70.3, and 76%, which is much higher than the pure WO3. Fig. 6g demonstrates the contact angles of WO3 and CeO2/WO3-15, the contact angle of CeO2/WO3-15 is much larger than that of WO3. The excellent moisture resistance of CeO2/WO3-15 could be attributed to the hydrophobic nature of CeO2.32 Additionally, compare the sensitivity of WO3 and CeO2/WO3-6 sensors measured in highly humid atmospheres (60% RH, 80% RH). It can be seen that the response value of the CeO2/WO3-6 sensor was much higher than the WO3 sensor. In conclusion, the humidity dependence of the response steadily decreased with increasing CeO2 loading concentration. A certain amount of CeO2 modification can efficiently enhance the stability of WO3 against changes in humidity, and simultaneously increase the sensitivity in various humidity, particularly within high-humidity conditions.
3.4. Gas sensing mechanism
It is well known that the gas-sensing properties of MOS-based gas sensors are associated with the capacity of adsorbing oxygen onto the surface. Particularly, when the sensing materials are exposed to air, oxygen will adsorb on their surfaces, and form chemisorbed oxygen species by capturing electrons from the conduction band of WO3 and CeO2. This process will result in the formation of an electron depletion region on the surface, which results in an overall high resistance of the gas sensors.Once the gas sensor is exposed to the H2S gas, the chemisorbed oxygen reacts with H2S molecules, which release electrons back into the conduction band of the sensing material. This process causes a decrease in the electrical resistance of the gas sensors, as shown in eqn (1).
| H2S + 3O− → SO2 + H2O + 3e− | (1) |
Compared to the WO3 sensor, the CeO2/WO3 sensors exhibit higher response properties towards H2S gas. The enhanced performance is attributed to the construction of the CeO2/WO3 heterojunction, and the higher adsorption capacity of CeO2/WO3 for chemisorbed oxygen, as confirmed by previous XPS analysis. The formation of heterojunction is considered to be the main factor. The heterojunction is formed as the CeO2 nanoparticles are modified on the WO3 surface. The energy band diagram of the CeO2/WO3 heterojunction is shown in Fig. 7a and b. Since the work function of WO3 (5.2 eV) is larger than CeO2 (4.9 eV), electrons will flow from the conduction band of CeO2 to WO3.21 The electron migration process leads to the formation of a hole accumulation layer on the surface of CeO2 and an electron accumulation layer on the surface of WO3. The hole accumulation layer of CeO2 at the heterojunction interface would further increase the number of electrons that were released from chemisorbed oxygen when the CeO2/WO3 sensors were exposed to H2S gas.33,34 As a result, the CeO2/WO3 sensors exhibit higher resistance variations, namely, greater responses, than the WO3 sensor.
| 2O− + 2H2O → 4OH + 2e− | (2) |
| 4Ce4+ + 2H2O → 4Ce3+ + 4H+ + O2 | (3) |
| Ce3+ + OH + H+ → Ce4+ + H2O | (4) |
| O2 + e− → O− | (5) |
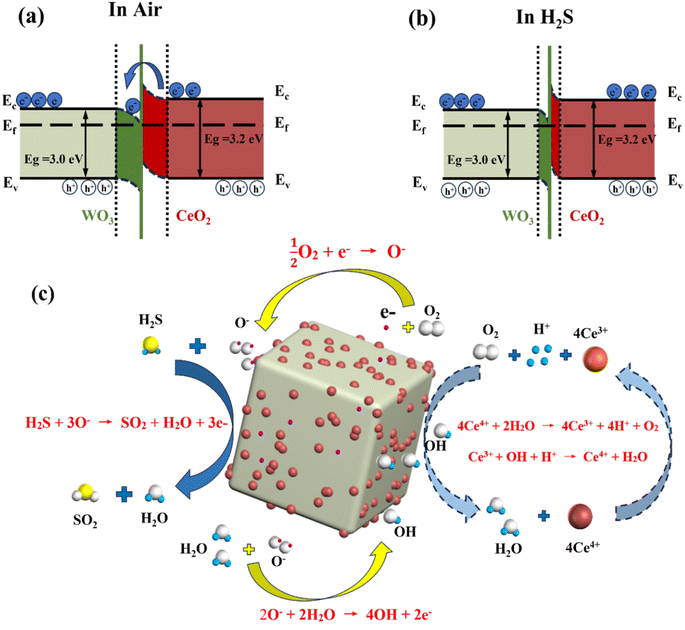 | ||
| Fig. 7 Schematic of the energy bands of CeO2-modified WO3 in the air (a) and H2S atmospheres (b), respectively, and (c) schematic of the anti-humidity detection to H2S gas. | ||
When the sensor is in humid atmospheres, the H2O molecules consume the chemisorbed oxygen on the surface, and generate hydroxyl radicals to occupy the active sites of the sensing layer, which significantly deteriorates the response properties of gas sensors. This humidity-sensitivity process is described by eqn (2).
In contrast to the WO3 sensor, the CeO2/WO3 sensors exhibited a more stable response in humid conditions, which is attributed to the modification of CeO2 to WO3.
Firstly, the CeO2 exhibits excellent hydrophobicity because the Ce atoms tend not to exchange electrons and form hydrogen bonds with interfacial H2O molecules.35,36 Secondly, the humidity dependence of gas sensors can be efficiently suppressed due to the highly reversible redox interaction between the multivalent states of the Ce elements.37,38 when CeO2 is decorated on the surface of WO3, CeO2 preferentially captures H2O molecules and reacts with them as follows. Firstly, Ce4+ ions are reduced to Ce3+ ions, and H2O molecules are decomposed into O2 and H+ (eqn (3)). Then, the hydroxyl radicals produced by humidity-sensitivity are scavenged by Ce3+ (eqn (4)). Additionally, the oxygen (O2) stored on the surface of CeO2 is reionized into active adsorbed oxygen (O−) by electrons captured on the surface (eqn (5)), which promoting the gas-sensing reaction of the H2S gas. The anti-humidity mechanism is explained in Fig. 7c. The above process effectively protects WO3 from interference by H2O molecules while partially enhancing the gas-sensing properties of sensors to H2S.
4. Conclusion
In summary, the pure WO3 and CeO2-modified WO3 were synthesized by hydrothermal method. Compared to the pure WO3 nanocubes, the CeO2-modified WO3 demonstrated excellent gas sensing performance toward H2S gas at 115 °C with high sensitivity and high selectivity. The response of CeO2/WO3-2 sensor reached 113 for 5 ppm H2S at 115 °C, which is two times of the WO3 sensor. The results of humidity stability show that CeO2-modified WO3 can increase the anti-humidity property. When the relative humidity changed from 20% RH to 80% RH, the response retention of CeO2/WO3-15 sensor was 76%, which is four times of the WO3 sensor. The enhanced response sensitivity and humidity stability are attributed to the formation of CeO2/WO3 heterojunctions, and the distinctive physicochemical property of catalytic CeO2 plays a key role in mitigating humidity dependence. Therefore, this work provides a constructive strategy for preparing low-temperature, high-sensitivity, and anti-humidity gas sensors.Author contributions
Zhixiang Deng data curation: lead; investigation: lead; writing – original draft: equal; writing – review & editing: equal. Zhixuan Wu data curation: supporting; investigation: supporting. Zhengai Chen data curation: supporting. Xinkuan Liu data curation: equal; writing – review & editing: supporting. Yan Sun data curation: equal; funding acquisition: lead; supervision: equal; writing – review & editing: lead. Meiying Ge data curation: equal; visualization: supporting; writing – review & editing: equal. Ning Dai funding acquisition: supporting; writing – review & editing: supporting.Conflicts of interest
There are no conflicts to declare.Acknowledgements
This research was funded by the National Natural Science Foundation of China (11933006, U2141240) and the Shanghai Science and Technology Committee (23ZR1473300).References
- A. Staerz, S. Somacescu, M. Epifani, T. Kida, U. Weimar and N. Barsan, ACS Sens., 2020, 5, 1624–1633 CrossRef CAS PubMed.
- J. Zhang, Z. Qin, D. Zeng and C. Xie, Phys. Chem. Chem. Phys., 2017, 19, 6313–6329 RSC.
- N. Kaur, M. Singh and E. Comini, Adv. Mater. Interfaces, 2021, 9, 2101629 CrossRef.
- X. Tong, X. Zhang, H. Wang, Z. Lin, H. Xi and J. Li, J. Electron. Mater., 2022, 51, 5440–5453 CrossRef CAS.
- H. Tai, S. Wang, Z. Duan and Y. Jiang, Sens. Actuators, B, 2020, 318, 128104 CrossRef CAS.
- H. Zhu, Q. Li, Y. Ren, Q. Gao, J. Chen, N. Wang, J. Deng and X. Xing, Small, 2018, 14, 7403 Search PubMed.
- A. Vasiliev, A. Varfolomeev, I. Volkov, N. Simonenko, P. Arsenov, I. Vlasov, V. Ivanov, A. Pislyakov, A. Lagutin, I. Jahatspanian and T. Maeder, Sensors, 2018, 18, 2600 CrossRef PubMed.
- K. Suematsu, M. Sasaki, N. Ma, M. Yuasa and K. Shimanoe, ACS Sens., 2016, 1, 913–920 CrossRef CAS.
- M. Yang, J. Lu, X. Wang, H. Zhang, F. Chen, J. Sun, J. Yang, Y. Sun and G. Lu, Sens. Actuators, B, 2020, 313, 127965 CrossRef CAS.
- Y. Liu, S. Yao, Q. Yang, P. Sun, Y. Gao, X. Liang, F. Liu and G. Lu, RSC Adv., 2015, 5, 52252–52258 RSC.
- N. Liu, Y. Li, Y. Li, L. Cao, N. Nan, C. Li and L. Yu, ACS Appl. Mater. Interfaces, 2021, 13, 14355–14364 CrossRef CAS PubMed.
- S. S. Nair, N. Illyaskutty, B. Tam, A. O. Yazaydin, K. Emmerich, A. Steudel, T. Hashem, L. Schöttner, C. Wöll, H. Kohler and H. Gliemann, Sens. Actuators, B, 2020, 304, 127184 CrossRef CAS.
- M.-S. Yao, W.-X. Tang, G.-E. Wang, B. Nath and G. Xu, Adv. Mater., 2016, 28, 5229–5234 CrossRef CAS PubMed.
- Z. Gao, G. Song, X. Zhang, Q. Li, S. Yang, T. Wang, Y. Li, L. Zhang, L. Guo and Y. Fu, Sens. Actuators, B, 2020, 325, 128810 CrossRef CAS.
- X. Jia, S. Yu, J. Yang, S. Wang, Y. Li, D. Shao and H. Song, IEEE Sens. J., 2022, 22, 1916–1923 CAS.
- H.-R. Kim, A. Haensch, I.-D. Kim, N. Barsan, U. Weimar and J.-H. Lee, Adv. Funct. Mater., 2011, 21, 4456–4463 CrossRef CAS.
- J. Miao, C. Chen and J. Y. S. Lin, Sens. Actuators, B, 2020, 309, 127785 CrossRef CAS.
- K.-I. Choi, H.-J. Kim, Y. C. Kang and J.-H. Lee, Sens. Actuators, B, 2014, 194, 371–376 CrossRef CAS.
- Y. J. Cho, Y. J. Kwon, S. Jin, H. Choi, J.-H. Lee, S.-M. Yang, S.-W. Choi and Y. K. Jeong, J. Hazard. Mater., 2022, 432, 128671 CrossRef CAS PubMed.
- W. Yu, Y. Sun, T. Zhang, K. Zhang, S. Wang, X. Chen and N. Dai, Part. Part. Syst. Charact., 2015, 33, 15–20 CrossRef.
- K. Yuan, C.-Y. Wang, L.-Y. Zhu, Q. Cao, J.-H. Yang, X.-X. Li, W. Huang, Y.-Y. Wang, H.-L. Lu and D. W. Zhang, ACS Appl. Mater. Interfaces, 2020, 12, 14095–14104 CrossRef CAS PubMed.
- A. Ivanova, B. Frka-Petesic, A. Paul, T. Wagner, A. N. Jumabekov, Y. Vilk, J. Weber, J. S. a. d. Günne, S. Vignolini, M. Tiemann, D. Fattakhova-Rohlfing and T. Bein, ACS Appl. Mater. Interfaces, 2020, 12, 12639–12647 CrossRef CAS PubMed.
- K. Pan, K. Shan, S. Wei, K. Li, J. Zhu, S. H. Siyal and H.-H. Wu, Compos. Commun., 2019, 16, 106–110 CrossRef.
- J. Wang, Z. Li, S. Zhang, S. Yan, B. Cao, Z. Wang and Y. Fu, Sens. Actuators, B, 2018, 255, 862–870 CrossRef CAS.
- Y. M. Shirke and S. P. Mukherjee, CrystEngComm, 2017, 19, 2096–2105 RSC.
- J. Liu, M. Dai, T. Wang, P. Sun, X. Liang, G. Lu, K. Shimanoe and N. Yamazoe, ACS Appl. Mater. Interfaces, 2016, 8, 6669–6677 CrossRef CAS PubMed.
- J. Hu, Y. Sun, Y. Xue, M. Zhang, P. Li, K. Lian, S. Zhuiykov, W. Zhang and Y. Chen, Sens. Actuators, B, 2018, 257, 124–135 CrossRef CAS.
- Z. Zhang, Y. Wu, H. Du, Y. Sun, S. Sun, S. Xu, L. Cong and P. Sun, J. Alloys Compd., 2022, 895, 162017 CrossRef CAS.
- M. Al-Hashem, S. Akbar and P. Morris, Sens. Actuators, B, 2019, 301, 126845 CrossRef CAS.
- A. V. Raghu, K. K. Karuppanan and B. Pullithadathil, ACS Sens., 2018, 3, 1811–1821 CrossRef CAS PubMed.
- K. Yuan, C. Y. Wang, L. Y. Zhu, Q. Cao, J. H. Yang, X. X. Li, W. Huang, Y. Y. Wang, H. L. Lu and D. W. Zhang, ACS Appl. Mater. Interfaces, 2020, 12, 14095–14104 CrossRef CAS PubMed.
- S. B. Malik, K. V. Mejia-Centeno, P. R. Martínez-Alanis, A. Cabot, F. Güell, F. E. Annanouch and E. Llobet, Sens. Actuators, B, 2024, 400, 134879 CrossRef CAS.
- Y. Shuai, R. Peng, Y. He, X. Liu, X. Wang and W. Guo, Sens. Actuators, B, 2023, 384, 133625 CrossRef CAS.
- Y. Sun, J. Wang, H. Du, X. Li, C. Wang and T. Hou, J. Alloys Compd., 2021, 868, 159140 CrossRef CAS.
- G. Azimi, R. Dhiman, H.-M. Kwon, A. T. Paxson and K. K. Varanasi, Nat. Mater., 2013, 12, 315–320 CrossRef CAS PubMed.
- Y. Tian and L. Jiang, Nat. Mater., 2013, 12, 291–292 CrossRef CAS PubMed.
- J.-W. Yoon, J.-S. Kim, T.-H. Kim, Y. J. Hong, Y. C. Kang and J.-H. Lee, Small, 2016, 12, 4229–4240 CrossRef CAS PubMed.
- H.-Y. Li, C.-S. Lee, D. H. Kim and J.-H. Lee, ACS Appl. Mater. Interfaces, 2018, 10, 27858–27867 CrossRef CAS PubMed.
| This journal is © The Royal Society of Chemistry 2024 |

