 Open Access Article
Niobic acid as a support for microheterogeneous nanocatalysis of sodium borohydride hydrolysis under mild conditions†
Guilherme Mateus Bousada ac,
Victor Nogueira da Silvaa,
Bárbara Fernandes de Souzaa,
Rodrigo Silva de Oliveira
 a,
Iterlandes Machado Juniora,
Carlos Henrique Furtado da Cunhab,
Didier Astruc
 c,
Robson Ricardo Teixeira
 a and
Renata Pereira Lopes Moreira
 *a
*a
aDepartment of Chemistry, Universidade Federal de Viçosa, Viçosa, Minas Gerais 36570-000, Brazil. E-mail: renata.plopes@ufv.br
bDepartment of Chemical Engineering, Universidade Federal de São Carlos, São Carlos, São Paulo, Brazil
cInstitut des Sciences Moléculaires, Université de Bordeaux, UMR CNRS 5255, Talence 33405 Cedex, France
First published on 17th June 2024
Abstract
This study explores the stabilization by niobic acid, of Pt, Ni, Pd, and Au nanoparticles (NPs) for the efficient microheterogeneous catalysis of NaBH4 hydrolysis for hydrogen production. Niobic acid is the most widely studied Nb2O5 polymorph, and it is employed here for the first time for this key reaction relevant to green energy. Structural insights from XRD, Raman, and FTIR spectroscopies, combined with hydrogen production data, reveal the role of niobic acid's Brønsted acidity in its catalytic activity. The supported NPs showed significantly higher efficiency than the non-supported counterparts regarding turnover frequency, average hydrogen production rate, and cost. Among the tested NPs, PtNPs and NiNPs demonstrate the most favorable results. The data imply mechanism changes during the reaction, and the kinetic isotope assay indicates a primary isotope effect. Reusability assays demonstrate consistent yields over five cycles for PtNPs, although catalytic efficiency decreases, likely due to the formation of reaction byproducts.
Introduction
Since the start of the Industrial Revolution, the increasing and extensive use of non-renewable energy sources has led to significant worldwide changes in the Earth's ecosystems.1,2 Carbon-based energy sources, among which we find fossil fuels, emit highly harmful substances, including nitrogen oxides (NOx) and sulfur oxides (SOx), in addition to CO2, which is the primary actor responsible for global warming.3,4 In South America, for instance, since 2000, there has been a continuous increase in deaths from heat-related events among the elderly in almost all countries.5 Moreover, emissions due to the burning of fossil fuels pose significant health risks, such as respiratory and cardiovascular issues.6 Despite those challenges, modern society increasingly depends on energy consumption for its very survival.Hydrogen has been envisioned as a viable alternative energy carrier that can replace fossil fuels and help reduce dependency on declining oil supplies while providing environmental and health benefits.3,7,8 Indeed, depending on its source, hydrogen gas can be considered a carbon-neutral fuel, making it a promising candidate in the arsenal of strategies to slow down global warming.8 However, despite those advantages, hydrogen gas is highly flammable, and its transport and storage present challenges in terms of economics and safety. These challenges arise from the requirement of high pressure, large vessel storage capacity, and substantial energy consumption to maintain low temperatures.7–9 Another drawback is that most hydrogen currently produced comes from fossil fuels.10
To promote feasible and sustainable hydrogen production, extensive research has focused on water photosplitting/electroreduction and hydrogen evolution from inorganic hydrides.10 Inorganic hydrides, such as boron hydrides like NH3BH3, NaBH4, and B2(OH)4, are promising sustainable hydrogen storage systems.7,10,11 These compounds are solid and stable at room temperature, ensuring safe storage. However, their hydrolysis reactions, although thermodynamically favorable, tend to be kinetically slow. Thus, utilizing catalysts is crucial to facilitate these reactions for efficient hydrogen production, enabling its application as a fuel.12
Among various inorganic hydrides, sodium borohydride (NaBH4) stands out as one of the most studied, simplest, and hydrogen-rich chemical species for hydrogen production, theoretically releasing 4 mol of H2 for every 1 mol of NaBH4 hydrolyzed (eqn (1)).7,12 It is a commonly used reducing agent in both organic and inorganic chemistry,13 being often employed to convert transition metal cationic salts into zero-valent metal nanoparticles when combined with a stabilizer,14 or even acting as a metal nanocatalyst stabilizer itself.15 The reduction of substrates by sodium borohydride can occur through both hydride transfer and single-electron transfer mechanisms due to its very cathodic redox potential.13,16
| NaBH4(aq) + 4H2O(l) → NaB(OH)4(aq) + 4H2(g) | (1) |
Although it slowly reacts with water to produce hydrogen gas, a reaction first recognized by Schlesinger,17 this reaction is accelerated in the presence of transition-metal catalysts,18 among which the use of metal nanoparticles (MNPs) is widespread.19–22 These MNPs exhibit unique electronic properties due to quantum confinement and possess an enhanced surface/volume ratio, providing a greater number of active sites when compared to their bulk counterparts.12 However, their high surface energy makes them prone to self-aggregation, leading to deactivation. To address this issue, various support materials have been proposed, including carbon-based structures, polymers, and metal–organic frameworks.12,23,24 Notably, the use of niobium-based materials for this purpose has received limited attention in the literature, with no examples, to our knowledge, in sodium borohydride hydrolysis.
Niobium (Z = 41) is a group 5 transition metal, commonly found in nature alongside another element from the same group, tantalum (Z = 73).25 This metal holds significant technological importance due to its extensive use in special alloys, being widely known for its exceptional superconducting properties.26 Moreover, Nb has exhibited promising outcomes in catalyzing organic reactions, photocatalysis, and the creation of novel materials.25,27–30
The majority of the world's Nb reserves (>90%) are concentrated in Brazil, making it the dominant producer as well, accounting for ca. 93% of global production.30 Investigations on Nb-catalyzed hydrogen production have used Nb in the form of complexes, combined with other metals, in the form of nanoparticles, and/or supported on other materials. Niobium-based semiconductors, for instance, are especially promising in hydrogen generation from water photosplitting reactions.31,32
Among niobium compounds, hydrated niobium pentoxide (Nb2O5·nH2O), also known as niobic acid, is one of the most widely studied. Considering Nb2O5 polymorphs, it is the one with the highest acidity (H0 = −5.6), despite its high water content, making it also stand out when compared to the acidity of other solids in general. It is an amorphous metal oxide composed mainly of distorted NbO6 octahedra and NbO4 tetrahedra. The highly polarized Nb–O bonds on its surface are responsible for some of the OH groups functioning as Brønsted acid sites. The Lewis acid sites, on the other hand, are mainly found within NbO4 tetrahedra, which, even after the formation of NbO4–H2O adducts, retain effective positive charges. As a heterogeneous catalyst, it is insoluble in water, the holy grail green solvent, making it easily separable from the reaction medium and an interesting alternative for acid-driven reactions in aqueous media.33–37
Fraga et al.37 demonstrated the exceptional efficiency of Nb2O5 as a support material for Pd, Ru, Co, and Ni in the pyrolysis reaction for oil upgrading through hydrodeoxygenation. This support led to a remarkable increase in activity, selectivity, and stability compared to other supports. Building upon these findings, our article reports the investigation of the microheterogeneous catalysis of NaBH4 hydrolysis using MNPs stabilized by niobic acid.
Experimental
Standards and reagents
The experiments used sodium borohydride (NEON, CAS No. 16940-66-2), niobium pentoxide hydrated (Companhia Brasileira de Metalurgia e Mineração, CBMM), gold(III) chloride trihydrate (Sigma-Aldrich, CAS No. 16961-25-4), hexachloroplatinic(IV) acid hexahydrate (Sigma-Aldrich, CAS No. 18497-13-7), potassium tetrachloropalladate(II) (Sigma-Aldrich, CAS No. 10025-98-6), nickel(II) sulfate hexahydrate (Sigma-Aldrich, CAS No. 10101-98-1), acetone (Sigma-Aldrich, CAS No. 67-64-1), and isopropyl alcohol (Sigma-Aldrich, CAS 67-63-0). All reagents were used as received, without any further purification.Synthesis of the catalysts
To synthesize AuNPs, PtNPs, PdNPs, and NiNPs, 34.45 μmol of a metal precursor (gold(III) chloride trihydrate, hexachloroplatinic(IV) acid hexahydrate, potassium tetrachloropalladate(II) or nickel(II) sulfate hexahydrate) was added to 10.0 mL of water and stirred for 15 min. After that, still under stirring, 1.00 mL of a 1.00 mol L−1 NaBH4 solution was added to the system, and stirring continued for another 15 min. The precipitate was then separated by centrifugation at 4000 rpm for 15 min and washed three times with water, with intermediate centrifugations. The supernatant was removed, and the freshly prepared material was used as it was.To synthesize AuNPs, PtNPs, PdNPs, and NiNPs supported on niobic acid, 34.45 μmol of a metal precursor (gold(III) chloride trihydrate, hexachloroplatinic(IV) acid hexahydrate, potassium tetrachloropalladate(II) or nickel(II) sulfate hexahydrate) was added to 10.0 mL of water containing 100 mg of niobic acid. The system was stirred for 15 minutes. After that, still under stirring, 1.00 mL of a 1.00 mol L−1 NaBH4 solution was added to the system, and stirring continued for another 15 min. The solid was then separated by centrifugation at 4000 rpm for 15 min and washed three times with water, with intermediate centrifugations. The supernatant was removed, and the freshly prepared material was used as it was or dried under vacuum after washing with isopropyl alcohol or acetone.
To synthesize Ni![[thin space (1/6-em)]](https://www.rsc.org/images/entities/char_2009.gif) :
:![[thin space (1/6-em)]](https://www.rsc.org/images/entities/char_2009.gif) Pt bimetallic catalysts supported on niobic acid, 34.45 μmol of the metal precursors, nickel(II) sulfate hexahydrate and hexachloroplatinic(IV) acid hexahydrate, in varying molar proportions (80
Pt bimetallic catalysts supported on niobic acid, 34.45 μmol of the metal precursors, nickel(II) sulfate hexahydrate and hexachloroplatinic(IV) acid hexahydrate, in varying molar proportions (80![[thin space (1/6-em)]](https://www.rsc.org/images/entities/char_2009.gif) :
:![[thin space (1/6-em)]](https://www.rsc.org/images/entities/char_2009.gif) 20, 60
20, 60![[thin space (1/6-em)]](https://www.rsc.org/images/entities/char_2009.gif) :
:![[thin space (1/6-em)]](https://www.rsc.org/images/entities/char_2009.gif) 40, 40
40, 40![[thin space (1/6-em)]](https://www.rsc.org/images/entities/char_2009.gif) :
:![[thin space (1/6-em)]](https://www.rsc.org/images/entities/char_2009.gif) 60 or 50
60 or 50![[thin space (1/6-em)]](https://www.rsc.org/images/entities/char_2009.gif) :
:![[thin space (1/6-em)]](https://www.rsc.org/images/entities/char_2009.gif) 50 Ni
50 Ni![[thin space (1/6-em)]](https://www.rsc.org/images/entities/char_2009.gif) :
:![[thin space (1/6-em)]](https://www.rsc.org/images/entities/char_2009.gif) Pt), was added to 10.0 mL of water containing 100 mg of niobic acid. The system was stirred for 15 minutes. After that, still under stirring, 1.00 mL of a 1.00 mol L−1 NaBH4 solution was added to the system, and stirring continued for another 15 min. The solid was then separated by centrifugation at 4000 rpm for 15 min and washed three times with water, with intermediate centrifugations. The supernatant was removed, and the freshly prepared material was used after drying under vacuum after washing with isopropyl alcohol or acetone.
Pt), was added to 10.0 mL of water containing 100 mg of niobic acid. The system was stirred for 15 minutes. After that, still under stirring, 1.00 mL of a 1.00 mol L−1 NaBH4 solution was added to the system, and stirring continued for another 15 min. The solid was then separated by centrifugation at 4000 rpm for 15 min and washed three times with water, with intermediate centrifugations. The supernatant was removed, and the freshly prepared material was used after drying under vacuum after washing with isopropyl alcohol or acetone.
Characterization
For the evaluation of the catalytic performance of the support after heat treatment, the same procedure was repeated with 100 mg of niobic acid or niobic acid after heating at 300, 400, or 500 °C for 2 h. The reactions were performed at room temperature.
To evaluate the catalytic performance of the metallic nanoparticles or the metallic nanoparticles on niobic acid, the identical experimental protocol was employed using the freshly prepared catalysts described in Synthesis of the catalysts. The reactions were performed at room temperature.
To evaluate the catalytic performance of the PtNPs and NiNPs on niobic acid in the presence of sodium hydroxide, the same procedure was replicated with some adjustments: the Kitasato flask was substituted with a 10 mL Schlenk flask, and the volume of water was replaced with 1 mL of aqueous sodium hydroxide solutions (0.000, 0.010, 0.050, 0.100, or 0.200 mol L−1) (Fig. S1†). Additionally, a 1 mL freshly prepared solution (using the sodium hydroxide solution as the solvent) containing 0.5 mmol of NaBH4 was introduced into the system. The reactions were conducted at room temperature. The catalyst was previously vacuum-dried after being washed with isopropyl alcohol.
The same procedure described for the reactions in the presence of sodium hydroxide was used for bimetallic catalysts, substituting sodium hydroxide solution for type II+ water.
All reactions were performed until there was no visible displacement of water. The conversion of hydrogen volume to the amount of substance is described in detail in the ESI.†
Kinetic isotope effect assay
To evaluate the mechanism of the catalytic reaction of the support with Pt nanoparticles, the catalyst, synthesized as described previously, was washed with isopropyl alcohol or acetone and then vacuum-dried. Subsequently, it was added to a 10 mL Schlenk flask. To the flask, either 1 mL of type II+ water or 1 mL of deuterated water was added. The flask was closed with a septum and connected to a water-filled burette. The mixture was continuously stirred before introducing, through a syringe, 1 mL of a freshly prepared aqueous solution containing 0.5 mmol of NaBH4 or 1 mL of a freshly prepared solution containing 0.5 mmol of NaBH4 in deuterated water. The volume of hydrogen gas produced was determined by measuring water displacement in the burette. The reactions were performed at room temperature.To ascertain the kinetic isotope effect (KIE),38 the rate constant for each reaction was calculated as described in the ESI,† focusing on the most significant kinetic region.
Reusability assay
To assess the reusability of the PtNPs and NiNPs-supported catalysts, the catalyst, synthesized following the previously described procedures, was first washed with acetone and dried under vacuum. Next, it was added to a 10 mL Schlenk flask. To this flask, 1 mL of type II+ water was added. The flask was sealed with a septum and connected to a water-filled burette. The mixture was continuously stirred, and then 1 mL of a freshly prepared aqueous solution containing 0.5 mmol of NaBH4 was introduced through a syringe. After the reaction, the catalyst was removed, thoroughly washed with type II+ water, and then centrifuged. The supernatant was discarded, and the catalyst was again washed with acetone and vacuum-dried. This reusability process was repeated for a total of 5 reactions. All reactions were performed at room temperature.Results and discussion
Characterization
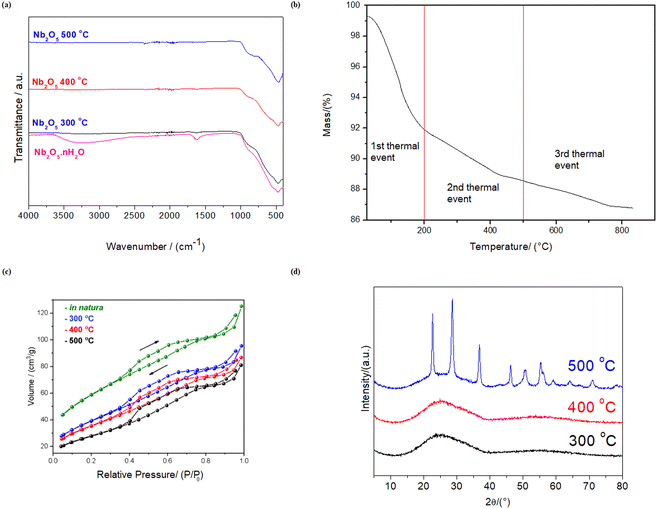
Nb2O5·nH2O is well-known for its significant Brønsted acidity due to the release of protons from hydroxyl groups attached to Nb and coordinated water molecules at NbO4 sites.33–35 However, this Brønsted acidity decreases as the material undergoes dehydration with increasing temperatures. This decrease in Brønsted acidity can be accompanied by the emergence of Lewis acid sites, resulting from inherent structural deficiencies.35The dehydration process of Nb2O5·nH2O is evidenced in the infrared spectrum in Fig. 1a. Upon subjecting Nb2O5·nH2O to temperature treatments at 300, 400, and 500 °C, the O–H stretching band (νO–H = ∼3250 cm−1) and the H–O–H scissoring bend (δH–O–H = ∼1620 cm−1) disappear.39 Additionally, Fig. 1a reveals other important bands, unrelated to the dehydration process, such as the Nb(–)(![[double bond, length as m-dash]](https://www.rsc.org/images/entities/char_e001.gif) )O stretching bands at ∼480–900 cm−1.39b The thermogravimetric analysis (Fig. 1b) also confirms the water loss, with more than a 10% decrease in the mass of niobic acid at temperatures above 500 °C due to the release of water molecules. Using this same analysis, the hydration of Nb2O5 was estimated as 1.4 (Nb2O5·1.4H2O).
)O stretching bands at ∼480–900 cm−1.39b The thermogravimetric analysis (Fig. 1b) also confirms the water loss, with more than a 10% decrease in the mass of niobic acid at temperatures above 500 °C due to the release of water molecules. Using this same analysis, the hydration of Nb2O5 was estimated as 1.4 (Nb2O5·1.4H2O).
The expected decrease in Brønsted acidity following dehydration was confirmed for the heat-treated niobic acid, as shown in Table 1. The heat-treated counterparts release fewer protons into the medium, as evidenced by the observed change in pH. In particular, niobic acid releases 2.6 times more protons into the medium after 10 min of stirring than its heat-treated counterpart at 500 °C.
| Nb2O5·nH2O subjected to different types of heat treatment | pH |
|---|---|
| In natura | 4.46 |
| 300 °C | 4.53 |
| 400 °C | 4.58 |
| 500 °C | 4.88 |
The dehydration process also led to a surface area reduction in niobic acid, as indicated in Table 2, and the adsorption isotherms in Fig. 1c. Specifically, there was a 52% decrease in surface area when comparing the original material to the material treated at 500 °C. A transition from an amorphous phase (Fig. S2† and 1d) to a more crystalline structure (Fig. 1d) also evidenced the dehydration, as suggested in the literature.33,35
| Nb2O5·nH2O subjected to different types of heat treatment (2 h) | Specific surface area (m2 g−1) | Pore diameter (nm) | Pore volume (cm3 g−1) |
|---|---|---|---|
| In natura | 207.010 | 3.07137 | 0.118103 |
| 300 °C | 141.243 | 3.45078 | 0.111984 |
| 400 °C | 127.009 | 3.44728 | 0.102673 |
| 500 °C | 99.977 | 3.44803 | 0.11234 |
The deposition of the metal nanoparticles was confirmed through analysis of the EDS spectra (Fig. S3†), TEM images (Fig. 2 and S4†), and MIP-OES data (Table 3). In addition to niobium and oxygen, sodium (resulting from the synthesis process) and silicon (niobic acid impurity) were also detected alongside the respective nanoparticles. The nanoparticles exhibited a well-dispersed spheroidal shape on the amorphous niobic acid sheets, with average sizes of 5.0 nm for NiNPs, 3.5 nm for PtNPs, 4.2 nm for PdNPs, and 6.1 nm for AuNPs. The interlamellar average distances measured were 0.221 nm for NiNPs, 0.153 nm for PtNPs, 0.291 nm for PdNPs, and 0.174 nm for AuNPs. The selected area electron diffraction (SAED) pattern of the NPs shown in Fig. S5† confirmed their crystalline nature. Furthermore, Fig. S6† illustrated the relationship between pore size and volume for all the NPs supported on niobic acid, revealing only marginal differences in pore size and surface area, except for the composite NiNPs/Nb2O5·nH2O, which exhibited a considerably smaller surface area.
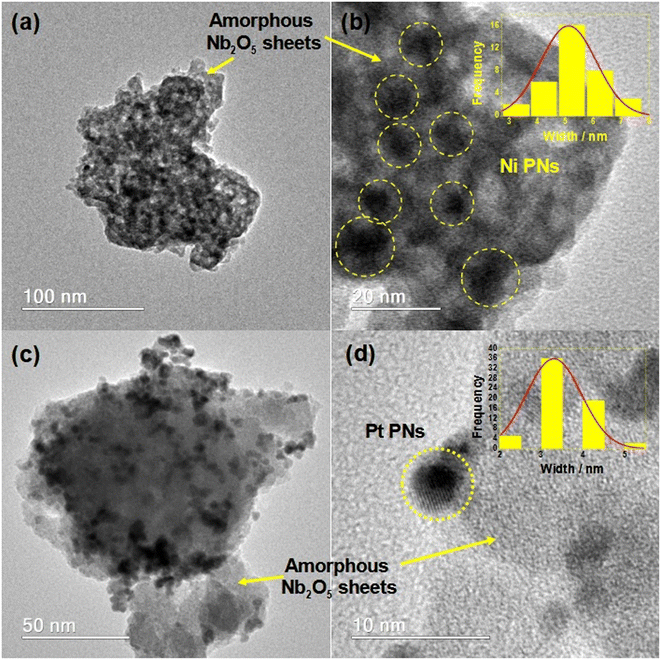 | ||
| Fig. 2 TEM images of the (a and b) NiNPs/Nb2O5·nH2O, inset: NiNPs size distribution. (c and d) PtNPs/Nb2O5·nH2O, inset: PtNPs size distribution. | ||
| Catalyst | H2 yield/(%) | Average ratea/(μmolH2 min−1) | Metal loadingb/(μmol) | TOFc/(mmolH2 molmetal−1 min−1) | Cost for hydrogen productiond/(US$ per mmolH2 min) |
|---|---|---|---|---|---|
| a Total hydrogen produced/time.b Determined by MIP-OES analysis for the supported NPs.c TOF = derivative of the first linear range of H2 production in the reaction/(metal loading). The first linear range corresponds to the linear equation obtained with R2 ≥ 0.99.d Cost = (price of the metal used in the synthesis)/(hydrogen yield × average rate). | |||||
| PtNPs | 67 | 93.6 | 34.45 | 6927 | 48.95 |
| PtNPs/Nb2O5·nH2O | 69 | 1577.7 | 16.71 | 228![[thin space (1/6-em)]](https://www.rsc.org/images/entities/char_2009.gif) 786 786 |
2.82 |
| NiNPs | 58 | 51.4 | 34.45 | 2397 | 0.37 |
| NiNPs/Nb2O5·nH2O | 73 | 240.7 | 26.62 | 13![[thin space (1/6-em)]](https://www.rsc.org/images/entities/char_2009.gif) 368 368 |
0.06 |
| PdNPs | 44 | 50.6 | 34.45 | 1895 | 39.97 |
| PdNPs/Nb2O5·nH2O | 35 | 119.3 | 28.13 | 6063 | 21.31 |
| AuNPs | 5 | 6.3 | 34.45 | 290 | 7460.32 |
| AuNPs/Nb2O5·nH2O | 10 | 17.8 | 23.32 | 1157 | 1320.22 |
Catalyzed hydrolysis of sodium borohydride by niobic acid and its heat-treated counterparts
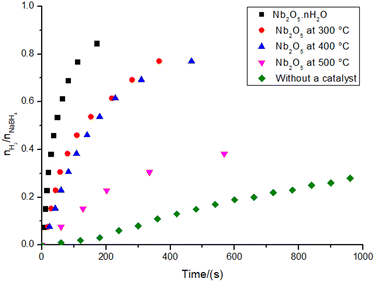
The graph illustrating the hydrogen production for the reactions catalyzed by niobic acid and its heat-treated counterparts can be seen in Fig. 3. All materials produced hydrogen gas in higher yields than the reaction without a catalyst, as well as all the reactions were much faster (2 to 17 times faster). Despite having low activity, Nb2O5·nH2O is still significantly more active than its heat-treated counterparts: the reaction with niobic acid is approximately seven times faster, resulting in twice the hydrogen production compared to its counterpart treated at 500 °C.Upon analyzing the structural insights provided in Fig. 1, the hydrogen production data in Fig. 3, and the variation in the system pH shown in Table 1, we can infer that the Brønsted acidity of Nb2O5·nH2O may play a role in its catalytic activity. This role can be accounted for by the acid-catalyzed hydrolysis of sodium borohydride (eqn (2)–(4)).
In acid catalysis, the borohydride anion reacts with a proton released or abstracted from niobic acid, liberating hydrogen gas and producing borane (eqn (2)). Then, borane is hydrolyzed, producing more hydrogen gas and boric acid (eqn (3)). Finally, boric acid is further hydrolyzed, generating a tetrahydroxyborate anion and liberating a proton (eqn (4)).40
| BH4(aq)− + H(aq)+ → BH3(aq) + H2(g) | (2) |
| BH3(aq) + 3H2O(l) → B(OH)3(aq) + 3H2(g) | (3) |
| B(OH)3(aq) + H2O(l) → B(OH)4(aq)− + H(aq)+ | (4) |
The notable decrease in surface area and pore volume following thermal treatment should also be considered regarding the difference in activity as it may result in reduced accessibility of substrates to the catalyst surface.33,37,41,42 This phenomenon was previously addressed in the discussion of Fig. 1d and Table 2.
Despite the reactions being conducted in water, the dehydrated materials do not rehydrate. This can be attributed to the rearrangement of amorphous Nb2O5·nH2O to the TT-Nb2O5 pseudohexagonal phase, as illustrated in Fig. 1d.33,35 This arrangement hinders the regeneration of Brønsted acidity even after water addition, leading to a decrease in the availability of OH groups. These groups are derived from both hydroxyl groups directly attached to Nb and water associated with NbO4 tetrahedra.33
Catalyzed hydrolysis of sodium borohydride by metal nanoparticles (MNPs) over niobic acid
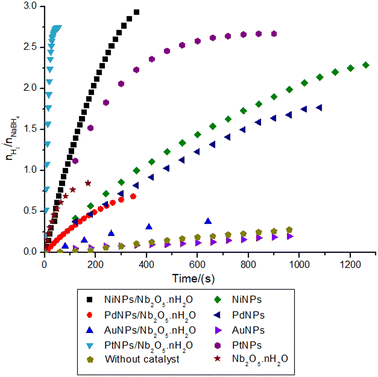
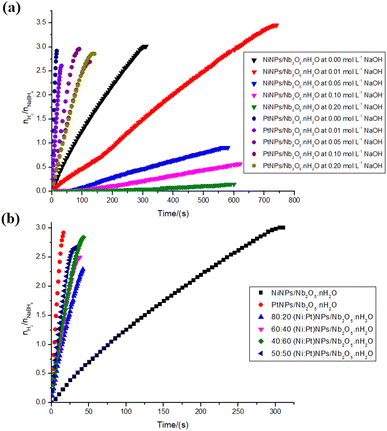
To further evaluate the performance of niobic acid in stabilizing the metal nanocatalysts, the transition metal salt precursors (gold(III) chloride trihydrate, hexachloroplatinic(IV) acid hexahydrate, potassium tetrachloropalladate(II), and nickel(II) sulfate heptahydrate) were reduced onto niobic acid. Fig. 4 illustrates the hydrogen production data for the nanocatalysts that were tested.The first result that requires attention is the incomplete nature of the reactions. According to eqn (1), the hydrolysis of 1 mol of sodium borohydride should yield 4 mol of hydrogen gas. However, as depicted in Fig. 4, the highest nH2/nNaBH4 ratio observed was 3. This trend is consistent with findings from several other studies conducted at room temperature.43–47
There are several possible explanations for these results. First, the increase in the pH of the system, as expected for this reaction, may have helped to stabilize the unreacted starting material, slowing down the hydrolysis process enough to prevent it from completing within the time-frame of the experiment.48 Second, at each hydrolysis step, when a hydroxyl group replaces the hydride, introducing an electron-withdrawing group makes it more challenging for a subsequent hydride transfer. In other words, the last hydride transfer of the final hydridic H atom of B(H)(OH)3 has insufficient hydricity.49
Table 3 provides a performance comparison between metal nanoparticles (MNPs) and MNPs supported on niobic acid, with costs determined using the prices outlined in Table S1.† The findings indicate that the introduction of niobic acid, even with lower incorporation of nanoparticles, yielded significantly better turnover frequency (TOF), average hydrogen production rate, and cost than the non-supported nanoparticles.
Both AuNPs and PdNPs demonstrated unexpectedly low activity despite their potential in heterogeneous catalysis.50–52 For instance, AuNPs/Nb2O5·nH2O exhibited a performance similar to niobic acid treated at 500 °C, the less acidic support, resulting in a final yield (9.6%) comparable to the reaction without any catalyst (7.0%). Interestingly, the infrared spectra of the composites AuNPs/Nb2O5·nH2O and PdNPs/Nb2O5·nH2O showed a higher absorption intensity for the band related to the O–H stretching (νO–H = ∼3250 cm−1) when compared with NiNPs/Nb2O5·nH2O, PtNPs/Nb2O5·nH2O, and Nb2O5·nH2O (Fig. S7†). These findings may suggest that a stronger interaction of AuNPs and PdNPs with OH groups inhibits the reaction, reinforcing the hypothesis that free OH groups in niobic acid contribute to the catalysis, as discussed for the Brønsted acidity. Additionally, the low activity of non-supported AuNPs and PdNPs and the infrared results suggest that these NPs may adsorb water more strongly, slowing the hydrolysis steps.
The top-performing catalysts, PtNPs/Nb2O5·nH2O and NiNPs/Nb2O5·nH2O, saw a significant increase in turnover frequency (TOF): +3202% and +458%, respectively. There was also an increase in the average hydrogen production rate of +1586% and +368% respectively, along with a cost reduction of −94% and −84%. The costs presented in Table 3 were normalized based on average hydrogen production rates and reaction yields relative to the metal utilized in the synthesis. The most efficient catalysts also demonstrated the lowest costs, at 2.82 and 0.06 US$ per mmolH2 min for PtNPs and NiNPs, respectively. Even though the reaction with supported NiNPs is notably slower than the one with PtNPs, the significant difference in reagent price, depending on the intended application, still would favor Ni. A larger-scale synthesis or other engineering approaches could be utilized to circumvent this issue if needed. Except for PdNPs, supporting the NPs on niobic acid either did not impact the hydrogen yield or resulted in a significant improvement (such as a +26% increase for NiNPs).
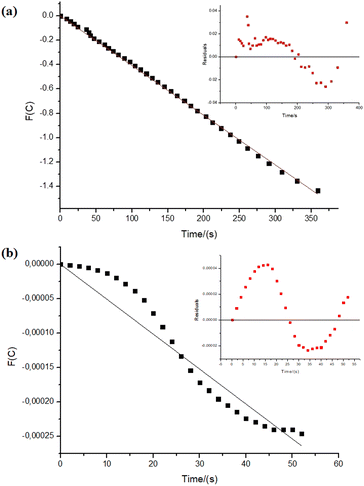
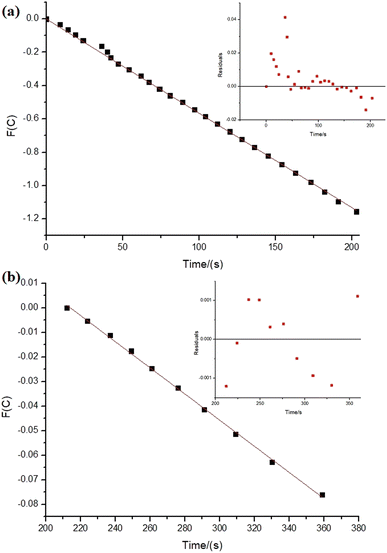
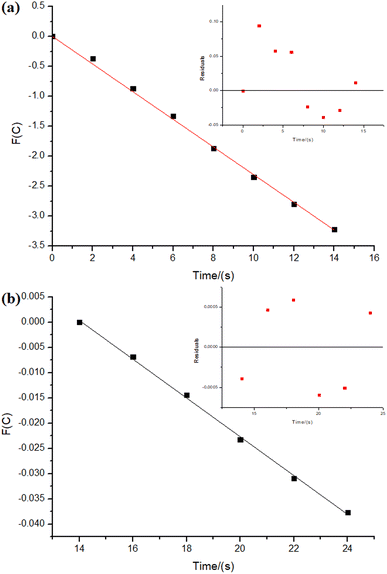
Regarding the reactions with NiNPs/Nb2O5·nH2O and PtNPs/Nb2O5·nH2O, the graphs in Fig. 5 depict the correlations between time and the test function (F(C)), which were used to determine the kinetic parameters for the reactions. The test function is a “mathematical trick” for the linearization of the analytical solutions for the differential equation used to describe the kinetics of the reactions (eqn (S3)–(S7)†). Refer to the ESI† for further details on how the test function was obtained.
At first glance, the data reveals significant differences in the reaction orders for both metals, suggesting distinct mechanisms. The hydrolysis of sodium borohydride by NiNPs/Nb2O5·nH2O approaches a pseudo-first-order reaction (n = 0.97), whereas the hydrolysis by PtNPs displays an unusual, higher-than-pseudo-fourth-order (n = 4.5).
However, upon careful analysis of the graphs, the bias in the dispersion of the residuals (as seen in the inserts in Fig. 5a and b) becomes evident. This bias can be accounted for the concentration-dependent change in the mechanism of sodium borohydride hydrolysis, which can be influenced by various factors, including the reduction of water activity due to an increase in viscosity, and even the interference of the reaction intermediates.40,53 Furthermore, mass transfer can become an issue in the relatively high amount of solvent used in the reaction. Therefore, we decided to examine the reaction considering different time-frames to understand better the possible changes in the hydrolysis mechanism (Fig. 6 and 7).
As depicted in Fig. 6, the reaction with NiNPs/Nb2O5·nH2O initially approaches a pseudo-first-order behavior with respect to sodium borohydride until 203 s of the reaction (n = 0.85), after which it transitions to a pseudo-second-order behavior until the completion of the reaction (n = 1.9). In contrast, the reaction with PtNPs/Nb2O5·nH2O (Fig. 7) exhibits a more complex behavior. It approaches a pseudo-zero-order reaction until 14 s (n = 0.4), followed by a pseudo-second-order reaction until 24 s (n = 1.9). After that, there are multiple mechanism changes along the time, suggested by high reaction orders (n > 10).
For the reaction with PtNPs/Nb2O5·nH2O, after 34 s, the catalyst surface seems to undergo deactivation due to poisoning, caused by the formation of tetrahydroxyborate anions (B(OH)4−), leading to a leveling of the reaction rate.7,54 This deactivation may explain the slightly lower yield for the hydrolysis promoted by PtNPs/Nb2O5·nH2O in comparison to the one promoted by NiNPs/Nb2O5·nH2O. The deactivation of NiNPs might not have happened to the same extent as for PtNPs due to the differences in affinity of borates for the NPs' surface as well as the time required for borates transfer from the catalyst surface to the bulk phase of the reaction. In cases where the reaction proceeds rapidly, the available time for mass transfer decreases, enhancing the likelihood of poisoning.
Catalyzed hydrolysis of sodium borohydride by PtNPs over niobic acid in basic medium
There have been reports suggesting the use of sodium hydroxide in the reaction system to improve the performance of metal nanoparticles during the hydrolysis of NaBH4. This improvement is attributed to the coordination of hydroxide anions onto the surface of the nanoparticles, resulting in an electron-rich surface. As a consequence, the oxidative addition of O–H, a typical step in metal-mediated sodium borohydride hydrolysis, is facilitated.54To determine if this phenomenon is applicable in the current study, as well as to confirm the significance of the Brønsted acidity in the catalysis, the hydrolysis of sodium borohydride was carried out at varying concentrations of sodium hydroxide for the reactions catalyzed by NiNPs/Nb2O5·nH2O and PtNPs/Nb2O5·nH2O, as illustrated in Fig. 8a. The reaction system was reduced to facilitate the experiments (from 21 mL to 2 mL size).
The observed difference in the average speed of the PtNPs/Nb2O5·nH2O-catalyzed reaction (1577.7 μmolH2 min−1 at 27 °C to 5053.8 μmolH2 min−1 at 22 °C) and the NiNPs/Nb2O5·nH2O-catalyzed reaction (240.7 μmolH2 min−1 at 27 °C to 285.5 μmolH2 min−1 at 22 °C), without the addition of sodium hydroxide, may be attributed to the higher concentration of sodium borohydride or the temperature increase during sodium borohydride hydrolysis.55 It is worth noting that a smaller system resulted in similar hydrogen yields (73 and 75% for PtNPs/Nb2O5·nH2O and NiNPs/Nb2O5·nH2O, respectively) and changed the costs for hydrogen production concerning the metal used in the catalyst synthesis: 0.83 and 0.014 US$ per mmolH2 min for Pt and NiNPs, respectively, representing cost reductions of −71% and −77%, respectively.
The ESI† provides details on the calculations for temperature variations, roughly estimated as 0.8 °C for the reaction in 21 mL, and 8.8 °C for the reaction in 2 mL of water (worst-case scenario, without any temperature control). This shows, as expected, that a higher amount of solvent plays a more effective role as a heat sink for the reaction. Even if the system's temperature is controlled by an oil bath, the combination of a short reaction time and a small solvent amount makes it plausible to assume the generation of heat spots that might influence the reaction speed.
Considering now the reactions in the presence of sodium hydroxide, it was shown that the higher the concentration of the base, the slower the kinetics for both nanoparticles tested. A set of different factors might lead to these results.
Firstly, for PtNPs/Nb2O5·nH2O, the most active catalyst, the surface of PtNPs is already electron-rich. Instead of further enriching the surface with electrons, the coordination of hydroxide anions to the surface hinders the active sites. Secondly, the increased viscosity of the reaction medium restricts the mass transfer of the reagent to the catalyst surface.53,54 Additionally, the catalytic activity of niobic acid, as previously demonstrated, appears to be linked to its surface Brønsted acidity. Therefore, the higher basicity of the reaction mixture after the addition of sodium hydroxide reduces the catalytic activity of the support by decreasing the surface's Brønsted acidity. Besides, a more negative surface, linked to the consumption of protons, might also have hindered the approximation of the negatively charged borohydride ion. Finally, the essentially equal outcomes for the higher concentrations of NaOH may be explained by the saturation of the NPs' surface with hydroxide ions.
A similar pattern was found for NiNPs/Nb2O5·nH2O, and the same reasons outlined above can account for this. However, there is one notable contrast: although both PtNPs/Nb2O5·nH2O and NiNPs/Nb2O5·nH2O yield essentially the same results when 2 mL of water (0.000 mol L−1 of NaOH) is used, the reaction with NiNPs showed a significant increase in yield when 0.01 mol L−1 of NaOH was utilized. This unexpected outcome remains to be explained.
Catalyzed hydrolysis of sodium borohydride by bimetallic NPs composites (Pt![[thin space (1/6-em)]](https://www.rsc.org/images/entities/h3_char_2009.gif) :
:![[thin space (1/6-em)]](https://www.rsc.org/images/entities/h3_char_2009.gif) Ni) over niobic acid
Ni) over niobic acid
Trying to find a possible positive synergism between NiNPs and PtNPS, several bimetallic composites were synthesized with varying molar ratios: 80![[thin space (1/6-em)]](https://www.rsc.org/images/entities/char_2009.gif) :
:![[thin space (1/6-em)]](https://www.rsc.org/images/entities/char_2009.gif) 20, 60
20, 60![[thin space (1/6-em)]](https://www.rsc.org/images/entities/char_2009.gif) :
:![[thin space (1/6-em)]](https://www.rsc.org/images/entities/char_2009.gif) 40, 40
40, 40![[thin space (1/6-em)]](https://www.rsc.org/images/entities/char_2009.gif) :
:![[thin space (1/6-em)]](https://www.rsc.org/images/entities/char_2009.gif) 60, and 50
60, and 50![[thin space (1/6-em)]](https://www.rsc.org/images/entities/char_2009.gif) :
:![[thin space (1/6-em)]](https://www.rsc.org/images/entities/char_2009.gif) 50. As in the case of the reactions in basic medium, the experimental setup also involved the use of a lower amount of solvent (2 mL instead of 21 mL). The results for the performance of bimetallic composites over niobic acid are depicted in Fig. 8b.
50. As in the case of the reactions in basic medium, the experimental setup also involved the use of a lower amount of solvent (2 mL instead of 21 mL). The results for the performance of bimetallic composites over niobic acid are depicted in Fig. 8b.
When deposited onto a support, bimetallic catalysts can adopt various configurations, such as alloys, core–shell structures, or assume random orientations.56 The interaction between metals can result in unique properties compared to monometallic catalysts due to synergistic effects.56 In the current study, the presence of NiNPs had a negative impact on both the reaction speed and yield compared to PtNPs alone. Except for the most favorable bimetallic composite (50![[thin space (1/6-em)]](https://www.rsc.org/images/entities/char_2009.gif) :
:![[thin space (1/6-em)]](https://www.rsc.org/images/entities/char_2009.gif) 50), an increase in the amount of NiNPs correlated with a decrease in the reaction speed. This observation can be attributed to factors such as non-cooperative electronic interactions, the potential blocking of the more active platinum surface by nickel, and/or the formation of inactive phases.56
50), an increase in the amount of NiNPs correlated with a decrease in the reaction speed. This observation can be attributed to factors such as non-cooperative electronic interactions, the potential blocking of the more active platinum surface by nickel, and/or the formation of inactive phases.56
Study on the reusability of PtNPs and NiNPs over niobic acid catalyst
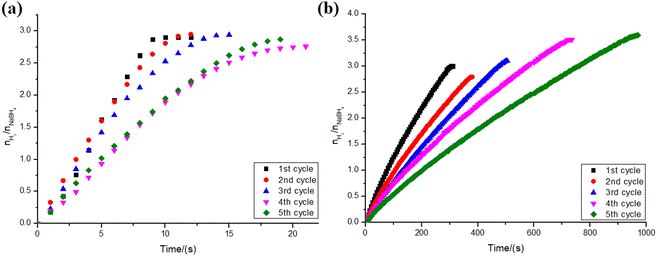
To assess the reusability efficiency of NiNPs and PtNPs over niobic acid in the hydrolysis of sodium borohydride, a series of reactions were conducted. The catalyst was washed and vacuum-dried before each reaction cycle. The results are presented in Fig. 9.As shown in Fig. 9a, there was no significant difference in hydrogen yield throughout the reaction cycles for PtNPs/Nb2O5·nH2O, with values randomly varying from 69% to 74%. However, in terms of reaction kinetics, there was a consistent decrease in the reaction speed along the assays. Despite this observation, there were no significant differences between the first and second cycles, as well as between the fourth and fifth cycles.
The decrease in the kinetics of the reaction might be explained by the formation of a covering film consisting of strongly adsorbed (poly)borates as suggested by other works.53,57 Such a film hinders the NPs' surface, decreasing the number of available active sites. The loss of material between manipulations should also be considered as a source for the differences found.
Although the hydrogen yield for the reactions catalyzed by PtNPs/Nb2O5·nH2O remains consistent across successive cycles, it is noteworthy that the opposite trend is observed when using NiNPs/Nb2O5·nH2O as catalysts (Fig. 9b). Despite a decrease in the reaction speed over time for both catalysts, for the reasons mentioned above, the latter appears to undergo surface restructuring. This self-optimization may have different reasons, such as improved mixing/mass transfer or simply surface activation induced by the reaction intermediates.58 This restructuring potentially enhances hydrogen formation and shifts the equilibrium in its favor, despite a reduction in the number of active sites.
Kinetic isotope effect
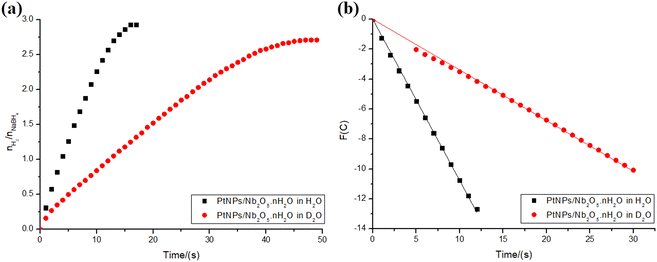
The kinetic isotope effect (KIE) provides a means to study the rate-determining step of a reaction. It is calculated by dividing the rate constants obtained for the reaction involving a light isotopically substituted reactant (κH) and the one involving a heavy one (κD) (KIE = κH/κD).38 The effect can be classified as primary if the KIE is between 2–7, and secondary if it falls between 0.7–1.5. In the former case, a bond involving the isotopically labeled atom is formed or cleavaged in the rate-determining step, explaining the significant difference in the rate constant.38 The latter, however, suggests that there is no bond involving the isotopically substituted atom being cleavaged or formed in the rate-determining step, although it somehow can influence it.38 The KIE can be explained, for example, by the differences in the vibrational modes of bonds due to the variations in the reduced mass of the system when using a heavier isotope. A higher reduced mass leads to lower vibration frequencies, requiring more energy to reach the transition state.59To investigate whether the rate-determining step in the present hydrolysis of NaBH4 also involves water, the reactions catalyzed by PtNPs/Nb2O5·nH2O were performed using both water and deuterated water. Only PtNPs were tested in this section, since they displayed better kinetics and no hydrogen yield difference compared to NiNPs (in the 2 mL reaction system). The results are depicted in Fig. 10a. As shown, the use of deuterated water had a significant impact on the reaction kinetics.
To determine the KIE of the reaction, the main kinetic regions were selected for both reactions: 0–12 s for the hydrolysis in water and 5–30 s for the hydrolysis in deuterated water (including the point at t = 0 s for the latter, though). The correlations between time and the test function, which were used to determine the kinetic parameters for the reactions, were calculated as described in the ESI† and are depicted in Fig. 10b. To compare both rate constants, the reaction order that best fits one of the data sets was fixed for both (n = 0.50). The rate constants were found as 1.1 and 0.34 mmol0.50 L0.50 s−1, for the reactions in water and deuterated water, respectively. This corresponds to a KIE = 3.2, indicating a primary isotope effect.38
While part of the difference in the rate constants could be explained by variations in the stabilization provided by the solvent to the transition state, the primary isotope effect indicates that, indeed, the reaction step involving water corresponds to the rate-determining step of the overall reaction.
To rationalize what might be happening throughout the reaction, it is important to keep in mind that H2O molecules can be easily activated on noble metals.38 In the rate-determining step, water molecules may be adsorbed onto the nanometals' surface and activated.38 The reaction of NaBH4 on PtNPs forms Pt–H in which the H atom is hydridic. This hydrogen then interacts with a hydrogen of water by hydrogen bonding, provoking a weakening of the H–OH bond, which significantly contributes to its cleavage. It cannot be forgotten, however, as was already demonstrated, that the reaction mechanism changes in the course of the reaction due to, among other things, the changes in sodium borohydride concentrations. That being said, it seems that the activation of water molecules remains the rate-determining step, regardless of the mechanism.
Conclusions
This study investigated NaBH4 hydrolysis using Pt, Ni, Pd, and Au nanoparticles stabilized by niobic acid. The new use of the Nb2O5 polymorph in sodium borohydride hydrolysis demonstrated a synergistic effect in hydrogen production due to its Brønsted acidity. PtNPs/Nb2O5·nH2O stood out as the most effective catalyst, revealing concentration-dependent changes in the hydrolysis mechanism. The kinetic isotope assay showed a primary isotope effect, indicating that the cleavage of a H–O bond of water continues to be the slowest step in the reaction mechanism. Reusability assays resulted in sustained yields over five cycles, with a decline in efficiency attributed to reaction byproducts. The results were modest in comparison with other supports but enriched our knowledge of the properties of niobic acid and expanded the sample space of the materials investigated for sustainable hydrogen production.Declaration of use of AI-assisted technologies
During the preparation of this work the authors used LanguageTool, Grammarly, and ChatGPT to improve readability and language.Conflicts of interest
There are no conflicts to declare.Acknowledgements
This work was supported by the Coordenação de Aperfeiçoamento de Pessoal de Nível Superior – Brazil (CAPES) [grant numbers 312400/2021-7]; the Conselho Nacional de Desenvolvimento Científico e Tecnológico (CNPq) [grant number 405828/2022-5]; the Fundação de Amparo à Pesquisa do Estado de Minas Gerais (FAPEMIG) [FAPEMIG RED-00144-22 and FAPEMIG APQ-01275-18]. The first author also thanks for the doctoral stay grant by CAPES (Brazil) at the Institut des Sciences Moleculaires, University of Bordeaux, Talence, France, where he developed part of this research (Edital no. 44/2022, financial code 001). We acknowledge the support of the University of Bordeaux and the Centre National de la Recherche Scientifique (CNRS). Special recognition goes to the Department of Chemistry and the Department of Physics at Universidade Federal de Viçosa for their support, as well as the Center of Microscopy at Universidade Federal de Minas Gerais (https://www.microscopia.ufmg.br) for their technical support.References
- National Research Council, Climate Change: Evidence and Causes: Update 2020, The National Academies Press, Washington, DC, 2020, vol. 34 Search PubMed
.
- K. Ravindra, A. Goyal and S. Mor, The Lancet Regional Health – Southeast Asia, 2023, 15, 100238 CrossRef PubMed
.
- M. Z. Jacobson, W. G. Colella and D. M. Golden, Science, 2005, 308, 1901 CrossRef CAS PubMed
.
- World Health Organization, WHO Global Air Quality Guidelines. Particulate Matter (PM25 and PM10), Ozone, Nitrogen Dioxide, Sulfur Dioxide and Carbon Monoxide, 2021, p. 360 Search PubMed
.
- S. M. Hartinger, M. Yglesias-González and L. Blanco-Villafuerte, et al., The Lancet Regional Health – Americas, 2023, 20, 100470 CrossRef PubMed
.
- R. Vilcassim and G. D. Thurston, EBioMedicine, 2023, 93, 104668 CrossRef CAS PubMed
.
- J. Andersson and S. Grönkvist, Int. J. Hydrogen Energy, 2019, 44, 11901 CrossRef CAS
.
- F. Eljack and M. K. Kazi, Frontiers in Sustainability, 2020, 1, 616762 Search PubMed
.
- Y. Sun, R. F. DeJaco and Z. Li, et al., Sci. Adv., 2021, 7, eagb3983 CrossRef PubMed
.
-
(a) W. Chen, J. Shen and Y. Huang, et al., ACS Sustain. Chem. Eng., 2020, 8, 7513 CrossRef CAS
; (b) C. Wang, Q. Wang, F. Fu and D. Astruc, Acc. Chem. Res., 2020, 53, 2483–2493 CrossRef CAS PubMed
; (c) C. Wang and D. Astruc, Chem. Soc. Rev., 2021, 50, 3437 RSC
.
- S. Akbayrak and S. Özkar, Int. J. Hydrogen Energy, 2018, 43, 18592 CrossRef CAS
.
-
(a) N. Kang, R. Djeda and Q. Wang, et al., ChemCatChem, 2019, 11, 2341 CrossRef CAS
; (b) D. Astruc, Chem. Rev., 2020, 120, 461 CrossRef CAS PubMed
.
-
(a) H. C. Brown, Organic Syntheses via Boranes, John Wiley & Sons, Inc., New York, 1975 Search PubMed
; (b) J. Seyden-Penne, Reductions by the Alumino- and Borohydrides in Organic Synthesis, VCH-Lavoisier, Paris, 1991 Search PubMed
.
- D. Astruc, F. Lu and J. Ruiz, Angew. Chem., Int. Ed., 2005, 44, 7852 CrossRef CAS PubMed
.
- C. Deraedt, L. Salmon, S. Gatard, R. Ciganda, R. Hernandez, J. Ruiz and D. Astruc, Chem. Commun., 2014, 50, 14194 RSC
.
- P. Michaud, D. Astruc and J. H. Ammeter, J. Am. Chem. Soc., 1982, 104, 3755 CrossRef CAS
.
- H. I. Schlesinger, H. C. Brown, A. E. Finholt and J. R. Gilbreath, et al., J. Am. Chem. Soc., 1953, 75, 215 CrossRef CAS
.
-
(a) N. A. Choudhury, R. K. Raman, S. Sampath and A. K. Shukla, J. Power Sources, 2005, 143, 1 CrossRef CAS
; (b) U. B. Demirci, O. Akdim and J. Andrieu, et al., Fuel Cells, 2010, 10, 335 CrossRef CAS
; (c) L. Yu and M. A. Matthews, Int. J. Hydrogen Energy, 2011, 36, 7416 CrossRef CAS
; (d) T. He, P. Pachfule, H. Wu, Q. Xu and P. Chen, Nat. Rev. Mater., 2016, 1, 16059 CrossRef CAS
.
- C. Luo, F. Fu and X. Yang, et al., ChemCatChem, 2019, 11, 1643 CrossRef CAS
.
- M. Farrag and G. A. M. Ali, Sci. Rep., 2022, 12, 17040 CrossRef CAS PubMed
.
- H. Jafarzadeh, C. Karaman and A. Güngör, et al., Chem. Eng. Res. Des., 2022, 183, 557 CrossRef CAS
.
- A. Paksoy, S. F. Kurtoğlu-Öztulum, M. B. Yağcı and Ö. Balcı-Çağıran, Int. J. Hydrogen Energy, 2022, 47, 36898 CrossRef CAS
.
- C. Gao, F. Lyu and Y. Yin, Chem. Rev., 2021, 121, 834 CrossRef CAS PubMed
.
- R. P. Lopes and D. Astruc, Coord. Chem. Rev., 2021, 426, 213585 CrossRef
.
- M. Tarselli, Nat. Chem., 2015, 7, 180 CrossRef CAS PubMed
.
- A. R. Alves and A. dos R. Coutinho, Miner. Eng., 2019, 132, 275 CrossRef CAS
.
- V. Lacerda Jr, D. A. dos Santos and L. C. da Silva-Filho, et al., Aldrichimica Acta, 2012, 45, 19 Search PubMed
.
- C. Zhang, M. Beidaghi and M. Naguib, et al., Chem. Mater., 2016, 28, 3937 CrossRef CAS
.
- I. D. Ivanchikova, I. Y. Skobelev and N. V. Maksimchuk, et al., J. Catal., 2017, 356, 85 CrossRef CAS
.
- P. M. Monte, A. P. P. M. da Silva and L. Fortes, et al., Rev. Virtual Quim., 2021, 13, 1391 CrossRef CAS
.
- A. Islam, S. H. Teo and Y. H. Taufiq-Yap, et al., J. Cleaner Prod., 2021, 318, 128439 CrossRef CAS
.
- C. Zhou, R. Shi, G. I. N. Waterhouse and T. Zhang, Coord. Chem. Rev., 2020, 419, 213399 CrossRef CAS
.
- K. Tanabe, Mater. Chem. Phys., 1987, 17, 217 CrossRef CAS
.
- K. Nakajima, Y. Baba and R. Noma, et al., J. Am. Chem. Soc., 2011, 133, 4224 CrossRef CAS PubMed
.
- Y. Zhao, X. Zhou, L. Ye and S. C. E. Tsang, Nano Rev., 2012, 3, 17631 CrossRef CAS
.
- D. Stošić, S. Bennici and V. Pavlović, et al., Mater. Chem. Phys., 2014, 146, 337 CrossRef
.
- M. M. C. Fraga, J. Vogt and B. L. de O. Campos, et al., Energy Fuels, 2023, 37, 10474 CrossRef
.
- Z. Li, T. He and L. Liu, et al., Chem. Sci., 2016, 8, 781 RSC
.
-
(a) P. Yan, S. Xi and H. Peng, et al., J. Am. Chem. Soc., 2023, 145, 9718 CrossRef CAS PubMed
; (b) D. Drobot, E. Nikishina and E. Lebedeva, et al., Mater. Res. Bull., 2008, 43, 1232 CrossRef CAS
.
- R. Retnamma, A. Q. Novais and C. M. Rangel, Int. J. Hydrogen Energy, 2011, 36, 9772 CrossRef CAS
.
- J. M. Jehng and I. E. Wachs, Chem. Mater., 1991, 3, 100 CrossRef CAS
.
- L. R. V. da Conceição, L. M. Carneiro, J. D. Rivaldi and H. F. de Castro, Ind. Crops Prod., 2016, 89, 416 CrossRef
.
- A. Levy, J. B. Brown and C. J. Lyons, Ind. Eng. Chem., 1960, 52, 211 CrossRef CAS
.
- Y. C. Lu, M. S. Chen and Y. W. Chen, Int. J. Hydrogen Energy, 2012, 37, 4254 CrossRef CAS
.
- N. P. Ghodke, S. Rayaprol and S. V. Bhoraskar, et al., Int. J. Hydrogen Energy, 2020, 45, 16591 CrossRef CAS
.
- Y. Wang and X. Liu, ACS Appl. Nano Mater., 2021, 4, 11312 CrossRef CAS
.
-
(a) G. Sperandio, I. M. Junior and E. Bernardo, et al., Processes, 2023, 11, 3250 CrossRef CAS
; (b) I. Machado Junior, G. H. Sperandio and R. P. Lopes, Int. J. Hydrogen Energy, 2023, 53, 1323 CrossRef
.
- V. G. Minkina, S. I. Shabunya and V. I. Kalinin, et al., Int. J. Hydrogen Energy, 2012, 37, 3313 CrossRef CAS
.
- S. Ilic, A. Alherz, C. B. Musgrave and K. D. Glusac, Chem. Soc. Rev., 2018, 47, 2809 RSC
.
- M. C. Daniel and D. Astruc, Chem. Rev., 2004, 104, 293 CrossRef CAS PubMed
.
- Q. Quach, E. Biehler and A. Elzamzami, et al., Catalysts, 2021, 11, 118 CrossRef CAS
.
- C. Huff, J. M. Long, A. Heyman and T. M. Abdel-Fattah, ACS Appl. Energy Mater., 2018, 1, 4635 CrossRef CAS
.
- U. B. Demirci and P. Miele, C. R. Chim., 2014, 17, 707 CrossRef CAS
.
- S. Doherty, J. G. Knight and H. Y. Alharbi, et al., ChemCatChem, 2022, 14, e202101752 CrossRef CAS
.
- J. Zhang, T. S. Fisher and J. P. Gore, et al., Int. J. Hydrogen Energy, 2006, 31, 2292 CrossRef CAS
.
- A. H. Hatta, A. A. Jalil and N. S. Hassan, et al., Int. J. Hydrogen Energy, 2022, 47, 30981 CrossRef CAS
.
- J. H. Kim, K. T. Kim and Y. M. Kang, et al., J. Alloys Compd., 2004, 379, 222 CrossRef CAS
.
- Y. Zhang, J. Pan and G. Gong, et al., Catalysts, 2003, 13, 120 CrossRef
.
- E. V. Anslyn and D. A. Dougherty, Modern Physical Organic Chemistry, University Science Books, 2006 Search PubMed
.
Footnote |
| † Electronic supplementary information (ESI) available. See DOI: https://doi.org/10.1039/d4ra01879f |
| This journal is © The Royal Society of Chemistry 2024 |

