
 Open Access Article
 This Open Access Article is licensed under a Creative Commons Attribution-Non Commercial 3.0 Unported Licence
Hydrothermal synthesis of modified lignin-based carbon dots derived from biomass waste for fluorescence determination of valsartan
Fatemah Aldakhil ,
Nawal A. Alarfaj,
Salma A. Al-Tamimi and
Maha F. El-Tohamy*
,
Nawal A. Alarfaj,
Salma A. Al-Tamimi and
Maha F. El-Tohamy*
Department of Chemistry, College of Science, King Saud University, P.O. Box 22452, Riyadh 11495, Saudi Arabia. E-mail: moraby@ksu.edu.sa
First published on 21st June 2024
Abstract
Recently, carbon dots (CDs) have been extensively investigated as potential tools for numerous applications. Modified lignin-based CDs have been synthesized and used in the field of drug detection. They were found to be highly selective and sensitive to valsartan (VAL). Using a simple hydrothermal method, phosphorus and chlorine co-doped CDs were synthesized using lignin extracted from date seeds. The fluorescence properties of the synthesized CDs are influenced by several factors, which were investigated in detail. The optimal synthesis conditions were 1.50 g of lignin, 18 mL of 2 M NaOH, 1 mM H3PO4, 3 mM HCl and the mixture was heated at 220 °C for 16 hours. The synthesized lignin-based CDs have excellent FL properties and are well soluble in water with reasonable stability. Characterization of the prepared CDs revealed that they have various functional groups with a graphene oxide-like structure. The developed CDs show a good quantum yield of 37.7%. The FL of the CDs is quenched by VAL at λem 313 nm after λex at 275 nm by a combination of static and dynamic quenching mechanisms. The response of VAL was linear in the range of 4.0–100.0 μg mL−1. The detection and quantification limits of VAL were 1.23 and 3.71 μg mL−1, respectively. The nanoprobe was successfully used to analyze VAL in drug samples and provided satisfactory results.
1. Introduction
Carbon dots (CDs), which are spherical, zero-dimensional carbon-based substances with diameters of less than ten nanometers, are also referred to as carbon quantum dots in some literature studies. CDs are a unique type of “core–shell” nanostructure, usually consisting of a conjugated sp2 core and containing groups based on carbon, nitrogen or oxygen.1 It is important to note that, unlike conventional quantum dots, CDs are usually not crystalline; instead, amorphous CDs are usually formed when organic precursors carbonize. The main building blocks of CDs are carbon sources that have undergone various forms of surface passivation through functionalization or modification.2Considerable progress has been made in the development of synthesis strategies, the mechanistic understanding of CDs, and the investigation of their potential uses. CDs are doped with heteroatoms, such as oxygen, nitrogen, sulfur, phosphorus, and boron, depending on the initial material used in their fabrication. Furthermore, the surface of CDs has been modified with polymers to introduce functional groups onto it.3
The properties of CDs include photophysical and photochemical stability comparable to that of widely recognized and commercially available quantum dots. They also have the significant advantages of being readily soluble in water and exhibiting minimal toxicity, no more toxicity than the chosen molecules for surface functionalization, and favorable biocompatibility. In addition, CDs have been shown to exhibit highly tunable fluorescence (FL) emission and excitation as well as nonblinking FL emission.4 Due to their outstanding properties, CDs have been explored for a wide range of attractive and/or novel applications. Some examples of these applications include photocatalysis,5 bioimaging,6 FL probing and analysis.7
Recently, numerous techniques have been developed for the production of CDs. These include laser ablation,8 chemical oxidation,9 electrochemical exfoliation,10 arc discharge,11 microwave pyrolysis,12 combustion/thermal methods,13 solvothermal methods,14 and hydrothermal synthesis.15
Among these techniques, hydrothermal synthesis is a straightforward approach with no special equipment requirements and is therefore an interesting and affordable method for synthesizing CDs.16 The preparation of CDs using a hydrothermal method offers the advantages of being nontoxic and inexpensive. In general, the aqueous solutions of the mixtures were sealed with Teflon in an oven and subjected to a hydrothermal reaction at high pressure and temperature.17
Biomass is an effective carbon source for the production of biomass-based CDs. Utilizing renewable biomass sources for the production of CDs is helpful in converting low-grade biowaste into useful and valuable materials. Moreover, biomass-based carbon sources are more environmentally friendly than other carbon sources. Biomass containing heteroatoms is the most effective starting material for the production of CDs, unlike CDs from artificial carbon sources, which require the use of external reagents.18
Lignin is one of the most abundant biobased aromatic macromolecules, and is a renewable and green raw material supplied by all agricultural and forestry plants. It can be obtained from lignin-containing biomass waste such as wood, some plant peels, seeds, etc., or can be obtained as a byproduct from the black liquor produced during paper pulping.19 Date seeds consist mainly of cellulose, hemicellulose and lignin. Depending on the type of date seed, the lignin content can be between 21 and 24%.20
Date seeds were selected as a source of lignin because they are abundant as agricultural material in Saudi Arabia, and there are no studies on their use as a source of CDs. Lignin is a perfect carbon source for CDs due to its aromatic conjugate structure, high carbon content, naturally occurring chemical modification and heteroatom doping.21
Lignin-based CDs can be synthesized directly from alkali lignin by hydrothermal treatment and doped with various heteroatoms to improve their optical properties.22 Chen et al. fabricated CDs with particle sizes ranging from 2 to 10 nm using lignin and H2O2.23 Jiang et al. synthesized lignin-based CDs with a FL quantum yield (QY) of 7.95% by subjecting a mixture of lignin, lactic acid, and betaine to a temperature of 300 °C.24 Shi et al. used alkali lignin, formaldehyde, and ethylenediamine to synthesize lignin-based CDs with an 8.1% FL QY under a nitrogen environment at 300 °C.25 It is obvious that the FL QY of the reported lignin-based CDs was quite low, and additional research is required to explore their functionalization. A newly developed method for the preparation of lignin-based CDs with a high FL QY (43.9%) was developed by Sun et al.16 The production of lignin-based CDs with environmentally friendly modifiers that enable a reasonable QY is therefore still a challenge.
One of the most significant applications of CDs is as fluorescent sensors, which are used to detect metal ions, anions and molecules. In most cases, the ions or molecules quenched the FL emission of the CDs. Compared to other ions, Fe is one of the most frequently detected ions due to its efficient combination with CDs.26 Moreover, other anions, such as CrO42− and ClO−,27 can be detected by FL emission signal quenching of CDs. Furthermore, some molecules and drugs can be sensitively detected by interactions with CDs, such as vitamin B12,28 ascorbic acid,29 zoledronic acid,30 baicalin,31 tamsulosin hydrochloride,32 and cholesterol.33
Chronic high blood pressure is a common age-related disease that can debilitate the heart and kidneys. The disease also affects the large arteries, microcirculation, endocrine components and central nervous system. Treatment with antihypertensive drugs reduces the problems associated with hypertension.34 The angiotensin II receptor blocker (ARB) valsartan (VAL) works by blocking an internal chemical that constricts blood vessels. VAL lowers blood pressure and relieves blood vessels. The heart is supplied with more oxygen and blood when blood pressure is lowered.35 The detection of VAL is crucial in various domains of society and can be utilized to further evaluate a patient seeking assessment. Numerous techniques (spectroscopic, electrochemical and chromatographic methods) have been documented for the quantification of VAL in biological fluids, pharmacological preparations and bulk forms.36–38
The aim of the present study was to evaluate the environmentally friendly synthesis of CDs using lignin extracted from date seeds as a precursor under different conditions. Simple and accurate fluorometric probe is proposed in the presence of the prepared CDs for the determination of VAL in bulk powder and in their commercial products. The fluorometric method is performed by measuring the influence of the added CDs on the intensity of the peaks of the proposed method. It should be mentioned that the developed nanoprobe is simple to make, highly selective, and environmentally benign. Furthermore, it relies on uncomplicated and easily obtainable tools, harmless substances, and gentle synthetic conditions. In addition, compared to other electrochemical or chromatographic procedures, it is also accurate and precise and does not require considerable technical expertise.
2. Experimental
2.1. Materials and chemicals
Pure-quality reagents and chemicals were purchased from commercial suppliers and utilized without additional purification. Sulfuric acid (H2SO4, 95–98%), hydrochloric acid (HCl 37%), phosphoric acid (H3PO3, 85%), and sodium hydroxide (NaOH, 99.0%) were obtained from Sigma-Aldrich, (Hamburg, Germany). Ethanol (99.9%), sodium dihydrogen phosphate (99.5%), and citric acid were obtained from BDH Laboratory supplies (London, UK). Lignin was isolated from date seeds (Al-Qassim, Saudi Arabia). Tabuk Pharmaceutical Co. (Tabuk, Saudi Arabia) provided the pure form of valsartan. Pharmaceutical preparations, specifically Diovan® 160 mg VAL per tablet manufactured by Novartis Pharmaceutical Corporation in Switzerland, were acquired from local medication stores in Riyadh, Saudi Arabia. Deionized (DI) water was used to prepare the solutions and during the experiments. Polyethersulfone (PES) membrane filters with a pore size of 0.22 μm and dialysis tubing with a cutoff molecular weight of 1000 Da (MD44) were obtained from Real Laboratory Supplies Store, China.2.2. Instruments
Multiple spectroscopic and microscopic approaches were employed to validate the synthesis of CDs. Photoluminescence spectroscopy, Fourier transform infrared (FTIR) spectroscopy, UV-vis spectroscopy, energy dispersive X-ray analysis (EDX), and X-ray diffraction (XRD) were performed using a RF-5301pc Shimadzu luminescence spectrometer with a 150 W xenon arc lamp, a PerkinElmer FTIR spectrophotometer, an Ultrospec 2100 Biochrom spectrophotometer, a JSM-7610F JEOL EDX, and a Siemens D-5000 diffractometer, respectively. The synthesized CDs were analyzed using a transmission electron microscope (TEM-1400, JEOL Ltd) and a scanning electron microscope (SEM-2100F, JEOL Ltd) to obtain microscopic information. The pH measurements were conducted with a pH-meter (HANNA-Instruments HI 2211, Italy).2.3. Extraction of lignin from waste date seeds biomass
The date seeds (DS) were washed with DI water to remove dirt particles and then dried in a closed room at room temperature. These seeds were ground using a high-quality stainless-steel mill until they yielded a brown powder, which was sieved to obtain a particle size of approximately 177 microns, then washed with DI water, oven-dried and stored in a glass bottle in a desiccator for further use.Lignin was extracted from DS by a combination of ultrasonic irradiation and chemical methods at high temperatures and alkaline concentrations to shorten the extraction time,39 followed by the precipitation of lignin under acidic conditions.40
Lignin was first extracted from DS (10 g) in 200 mL of 2 M NaOH solution at 80 °C for 1.5 h under sonication. Then, the mixture was stirred for another 1.5 hours at 90 °C. After the mixture cooled to room temperature, it was vacuum filtered and washed with 0.1 M NaOH to obtain the residual lignin on the cellulose surface. The hemicellulose was then isolated from the filtrate by precipitating the acidified filtrate in ethanol. Dilute sulfuric acid (20% v/v) was slowly added to the black filtrate with stirring to lower the pH.
At pH 6, the color of the solution obviously changed from black to cloudy brown. The mixture was stirred for 20 minutes to promote the growth of the precipitating particles. Then, it was transferred to a water bath at 65 °C and stirred for 45 minutes with the dropwise addition of an ethanol solution (50% v/v) as co-solvent. The solution was then centrifuged (4500 rpm) for 30 minutes. The filtrate, which was rich in lignin, was collected. The ethanol in the filtrate was removed using a rotary evaporator (60 °C). The alkali-soluble lignin was recovered by precipitation at pH 1.5 with sulfuric acid (20% v/v). The precipitated lignin was then centrifuged and washed with dilute acid (0.01 M) to remove the coprecipitated impurities. The resulting alkali lignin was then dried at 60 °C for 48 hours before further use.
2.4. Preparation and optimization conditions of lignin-based CDs
Approximately 1.0 g of alkali lignin was dispersed in 18 mL of different solvents (water, 0.1 M NaOH, DMSO, 60% ethanol, and 80% acetone), and the mixture of each sample was subjected to sonication for 30 minutes. Subsequently, the mixtures were transferred to a Teflon-lined autoclave with a capacity of 25 mL and subjected to a temperature of 200 °C for 12 hours. Once the mixture had cooled to the temperature of the surroundings, it was subjected to centrifugation at a speed of 6000 rpm for 15 minutes. Next, the solution was filtered through a 0.22 μm PES membrane. The liquid portions were transferred to a dialysis bag with a molecular weight cutoff of 1000 Da and subjected to dialysis against DI water for 12 hours. The samples were then kept at 4 °C.The effect of using different concentrations of NaOH was investigated. For this purpose, 1.0 g of alkali lignin was dissolved in 18 mL of different NaOH concentrations from 0 to 4.0 M. The mixtures of NaOH and alkali lignin were then mixed well, transferred to a 25 mL Teflon-lined autoclave and heated at 200 °C for 12 hours. After cooling to room temperature, the samples were acidified with HCl to pH = 2 to precipitate unreacted lignin, sonicated for 30 min, centrifuged (6000 rpm for 15 min), and filtered through a 0.22 μm PES membrane. The supernatants were transferred to a dialysis bag (MWCO 1000 Da), dialyzed against DI water for 48 hours to remove ultrasmall molecules and ions, and then stored at 4 °C.41
Different amounts of lignin ranging from 0.1 g to 3.0 g were dissolved in 18 mL of NaOH (2 M) and ultrasonicated for 30 minutes. The mixtures were then transferred to a 25 mL Teflon autoclave and heated at 200 °C for 12 hours. The mixtures were then cooled to room temperature, and the purification process was completed as previously described. Five samples of approximately 1.5 g of lignin were prepared at different temperatures (140, 160, 180, 200 and 220 °C) for 12 hours in a Teflon-lined autoclave using 18 mL of NaOH (2 M) as a solvent. The purification procedure was carried out as previously described.
To study the effect of time, five samples of 1.5 g of lignin were dissolved in 18 mL of NaOH (2 M) and treated in a Teflon-lined autoclave at 220 °C for 8–24 hours. After cooling to room temperature, purification was performed as previously described.
Varying amounts of each modifier (phosphoric acid or hydrochloric acid) were dissolved in NaOH (2 M), added to 1.5 g of lignin, and mixed with NaOH to a final volume of 18 mL. The suspension of each sample was sonicated for 30 minutes. The mixtures were then transferred to a 25 mL Teflon-lined autoclave and heated to 220 °C for 16 hours. After cooling to room temperature, the purification process was carried out as previously described. The solid products were obtained by freeze-drying for further characterization.
2.5. Quantum yield measurements
The relative quantum yield (QY) of the CDs can be calculated as follows (1):
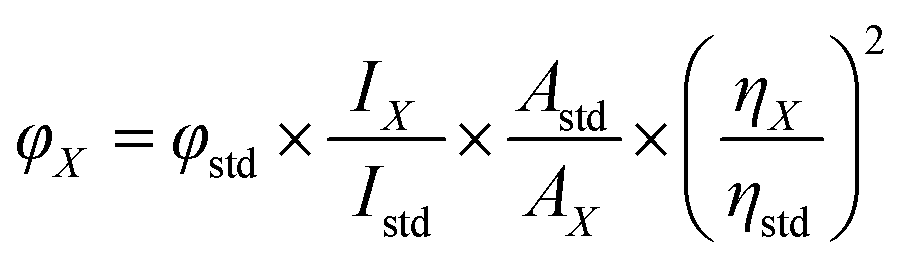 | (1) |
2.6. VAL determination using modified CDs
The stock solution of the modified CDs was prepared by suspending 1.0 g of CDs in 100 mL of DI water. The resulting suspension was sonicated for 10 minutes and stored in a refrigerator at 4 °C. A stock solution (1000 μg mL−1) of pure VAL was prepared by dissolving 0.1 g in 100 mL of ethanol. Aliquots of VAL (4.0–100.0 μg mL−1) were added to a series of 5 mL volumetric flasks. Approximately 1.5 mL (pH 8) of citrate–phosphate buffer was added to 0.10 mL of CDs for the VAL solutions and made up to the mark with DI water. The FL spectra of the prepared solutions were measured at λem 313 nm after λex at 275 nm (ex![[thin space (1/6-em)]](https://www.rsc.org/images/entities/char_2009.gif) :em slit = 3:5) after 5 min at 10 °C.
:em slit = 3:5) after 5 min at 10 °C.
Working solutions of VAL medicinal products were prepared by finely grinding 10 tablets of Diovan® 160 mg VAL per tablet. An equivalent amount (0.1 g) of each powder was diluted with 100 mL of DI water, sonicated for 10 minutes and then filtered. Analytical working samples were obtained by further dilution with the same solvent. The nominal content of the drug under study was estimated using a regression equation.
3. Results and discussion
3.1. Synthesis of lignin-based CDs
CDs were synthesized by a simple hydrothermal method using lignin extracted from DS as a carbon source and heteroatoms as modification precursors. Lignin was chosen as the starting material because it is the second most abundant component of plant material, and this biopolymer is rich in hydroxyl groups, which improves the FL emission of hydroxyl group-coated CDs. Scheme 1 shows the overall steps for the formation and purification of CDs. The synthesized CDs exhibit excellent dispersibility and high stability in water.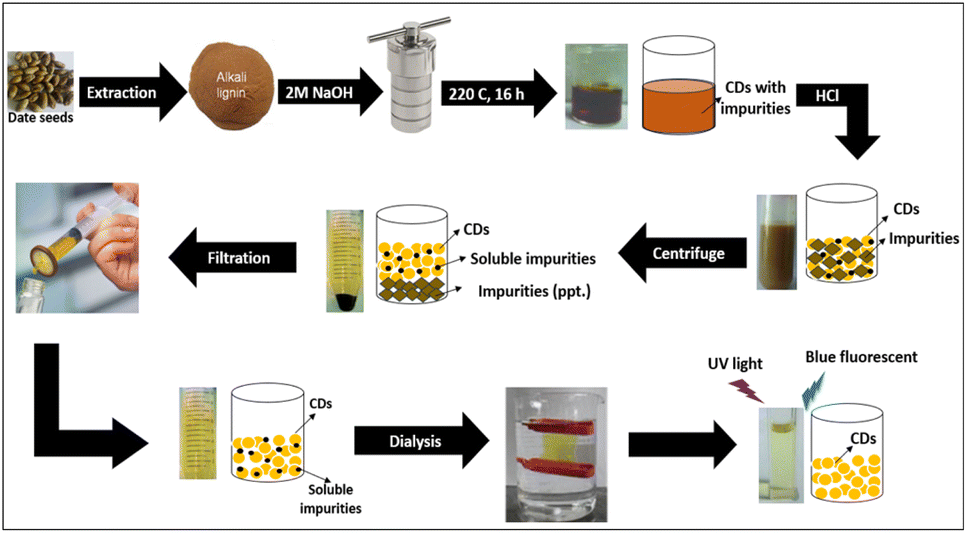 | ||
| Scheme 1 Schematic illustration of the formation and purification of CDs. | ||
The mechanism of the synthesis of CDs from lignin can be explained by four main steps (Scheme 2): depolymerization, carbonization, passivation and surface functionalization. Depolymerization occurs by splitting the lignin into smaller fragments. Further exposure to high temperatures and high pressure leads to carbonization (growth of CDs). Passivation is a necessary subsequent process, as pure carbon nanoparticles typically lack fluorescence. The chemical treatment of different compounds on the surface is a crucial stage in the manufacturing of CDs. This procedure involves applying an insulating layer to the surface, which reduces the impact of surface imperfections, trapping, and direct quenching caused by the environment. These factors contributed to an increase in FL emissions. Due to the absence of a passivating agent in this work, Bajpai et al. suggested that the residual polymer chains encased the carbon nanoparticles and produced hydroxyl groups on the surface, resulting in the generation of the FL.43 Functionalization is the last necessary step in the production of carbon dots to ensure their effectiveness. The exceptional optical characteristics of CDs are a direct consequence of the passivation of carboxyl or hydroxyl groups by capping materials.44
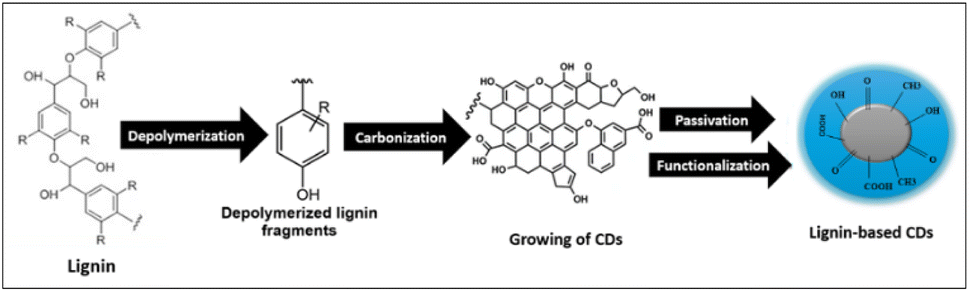 | ||
| Scheme 2 The possible mechanism for the synthesis of lignin-based CDs. | ||
Modified lignin-based CDs were successfully synthesized by hydrothermal treatment of two modifiers (HCl and H3PO4) with alkali lignin. The FL QY of the modified CDs was calculated using quinine sulfate as a reference at a λex of 350 nm and was found to be 37.7%.
3.2. Effect of preparation conditions on FL intensity
The FL properties of the prepared lignin-based CDs are influenced by several factors, such as the type of solvent, the amount of lignin, the retention time, the hydrothermal temperature, and the amount of additive. The FL intensities were measured at an excitation wavelength of 350 nm to evaluate the FL performance of the CDs. Since alkali lignin is insoluble in water and exhibits good chemical stability under mild hydrothermal treatment, the carbonization process is expected to be limited in neutral aqueous medium. Therefore, the FL intensity is low, as shown in Fig. 1. Although a polar organic solvent (DMSO) can dissolve lignin, neglected CDs form, as seen in DLS (Fig. 2), with low FL intensity. The use of 60% ethanol or 80% acetone was not successful under the conditions used, despite the high FL intensity (Fig. 1), but DLS showed that most of the particles formed had sizes of approximately 100–1000 nm (Fig. 2). The acid groups of the phenolic hydroxyl groups in lignin increase its solubility in aqueous sodium hydroxide (0.1 M NaOH), which is used as a solvent for lignin. The CDs prepared in this medium showed acceptable FL intensity with a particle size of approximately 10 nm (Fig. 1 and 2).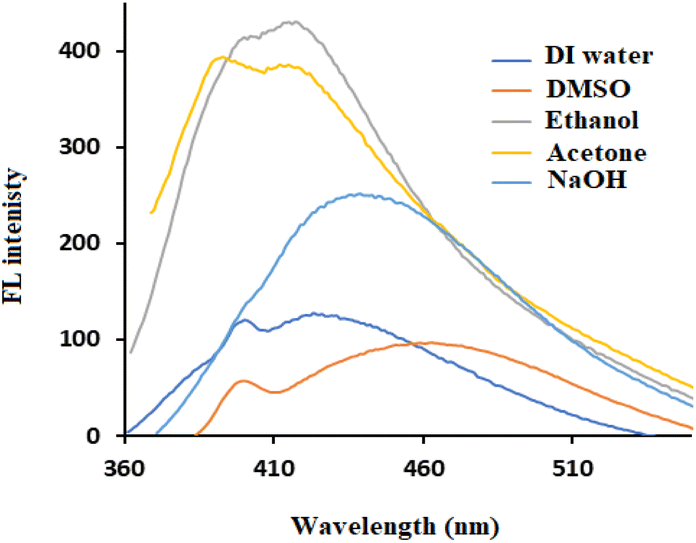 | ||
| Fig. 1 FL spectra of lignin after hydrothermal treatment in different solvents at 200 °C for 12 h. | ||
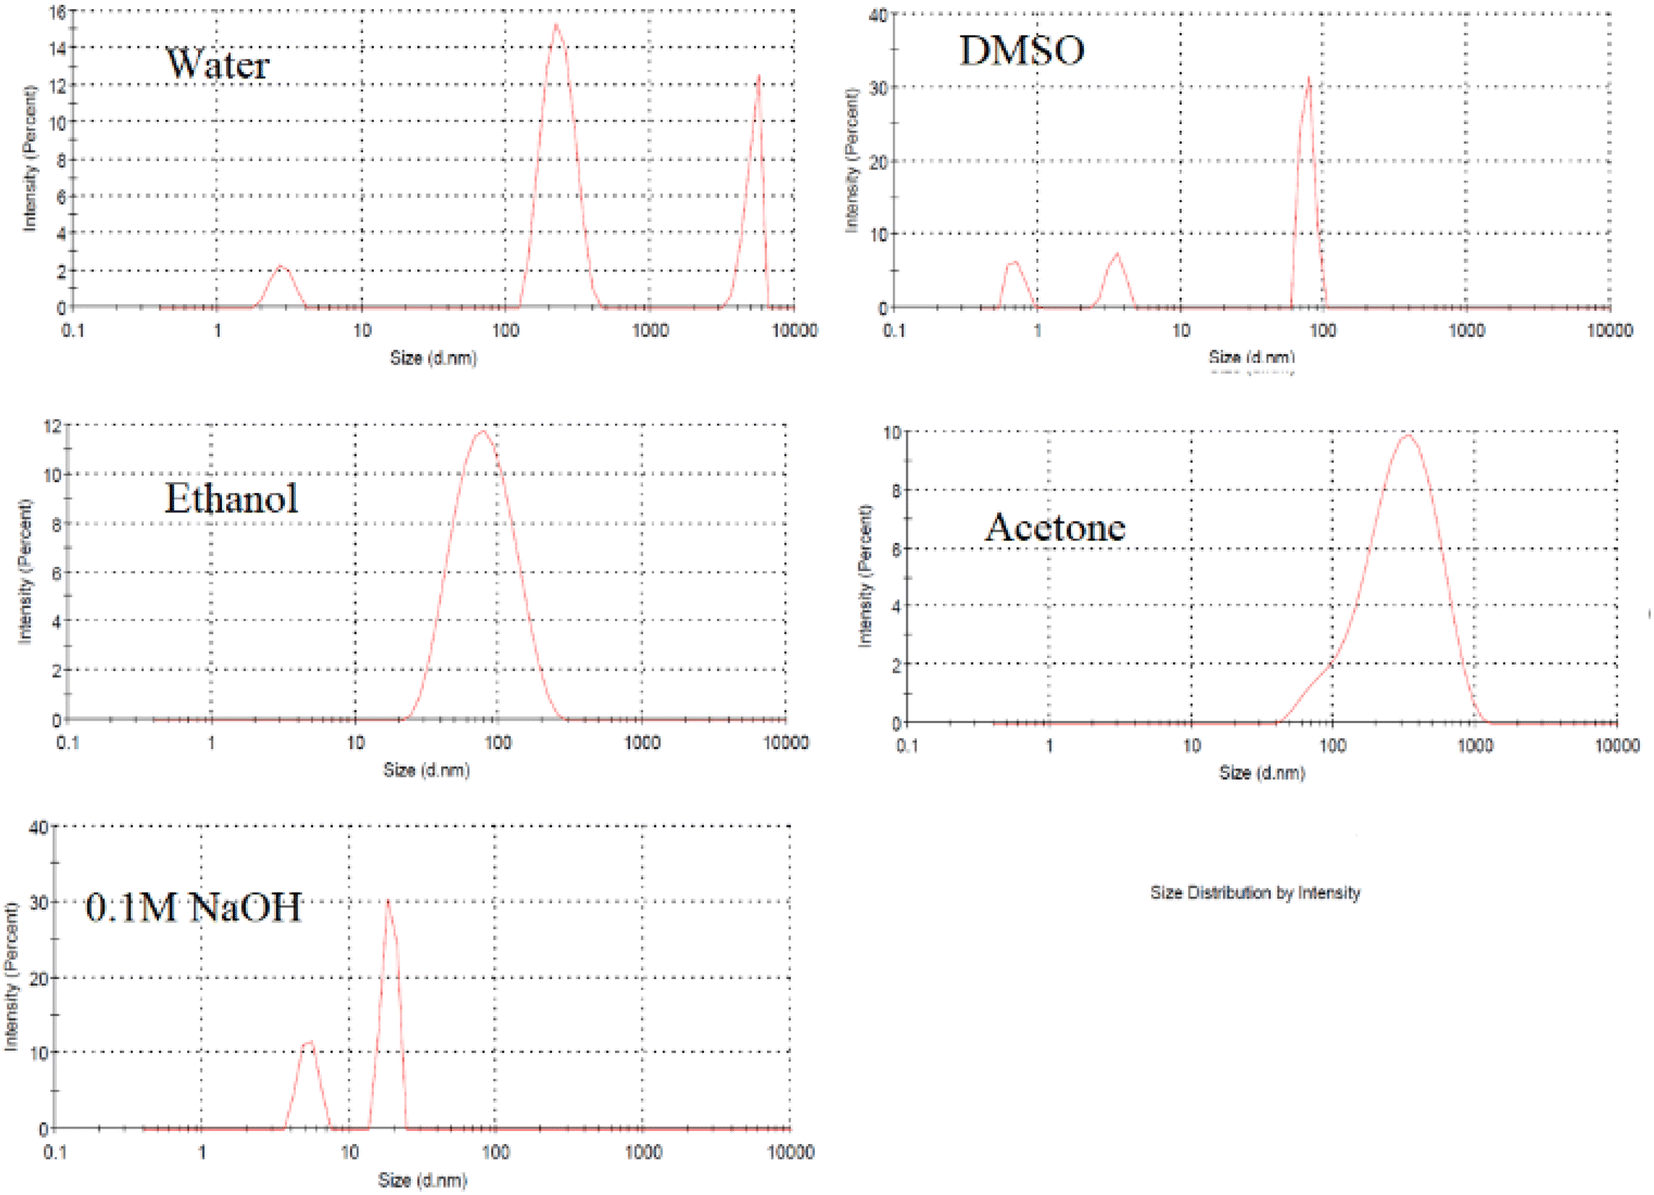 | ||
| Fig. 2 Size distribution of lignin after hydrothermal treatment in different solvents at 200 °C for 12 h. | ||
Different concentrations of NaOH were used to produce CDs, as shown in Fig. 3a. The greatest increase in the FL intensity clearly occurred when 2 M NaOH was used, and this concentration was chosen for further preparation of the CDs. TEM analysis (Fig. 3b) showed that when 2 M NaOH was used as a solvent, the hydrothermal treatment produced uniform particles in the size range of 3–5 nm. The hydroxyl group (OH−) from NaOH contributes to the formation of a protective shell, which decreases the effective diameter of the CDs. As previously reported,45 hydroxyl-coated CDs synthesized by hydrothermal reactions have a strong electron donating ability, with a positive effect on FL emission.
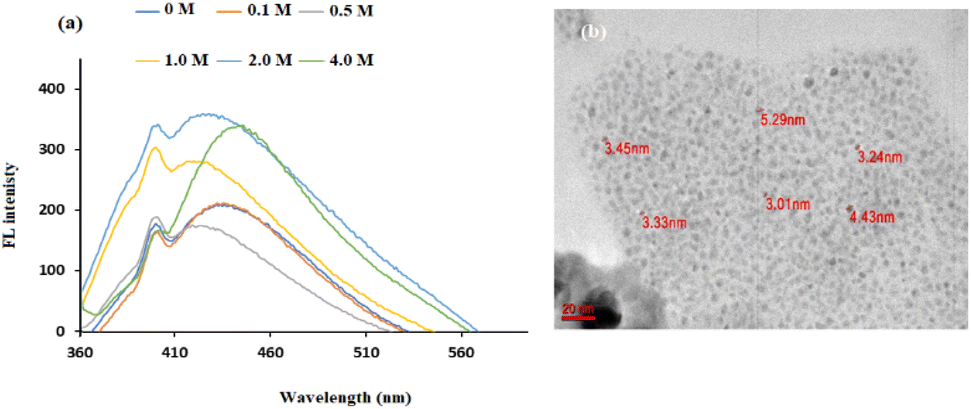 | ||
| Fig. 3 (a) FL spectra of lignin after hydrothermal treatment with different concentrations of NaOH at 200 °C for 12 h (b) TEM image when 2 M NaOH was used as the solvent at 200 °C for 12 h. | ||
The FL property of CDs is affected by lignin dosage, as shown in Fig. 4a. The intensity of the emission peak of CDs increased when the mass of lignin increased from 0.25 g to 1.5 g, which was due to the increase in the concentration of CDs formed. No further improvement in intensity occurred when the amount of lignin increased to 3.0 g. This could be due to the limited reaction space in the 18 mL solution, which is consistent with the results of Zhu et al.29 These results indicate that the lignin dosage is a crucial factor for the maximum emission peak.
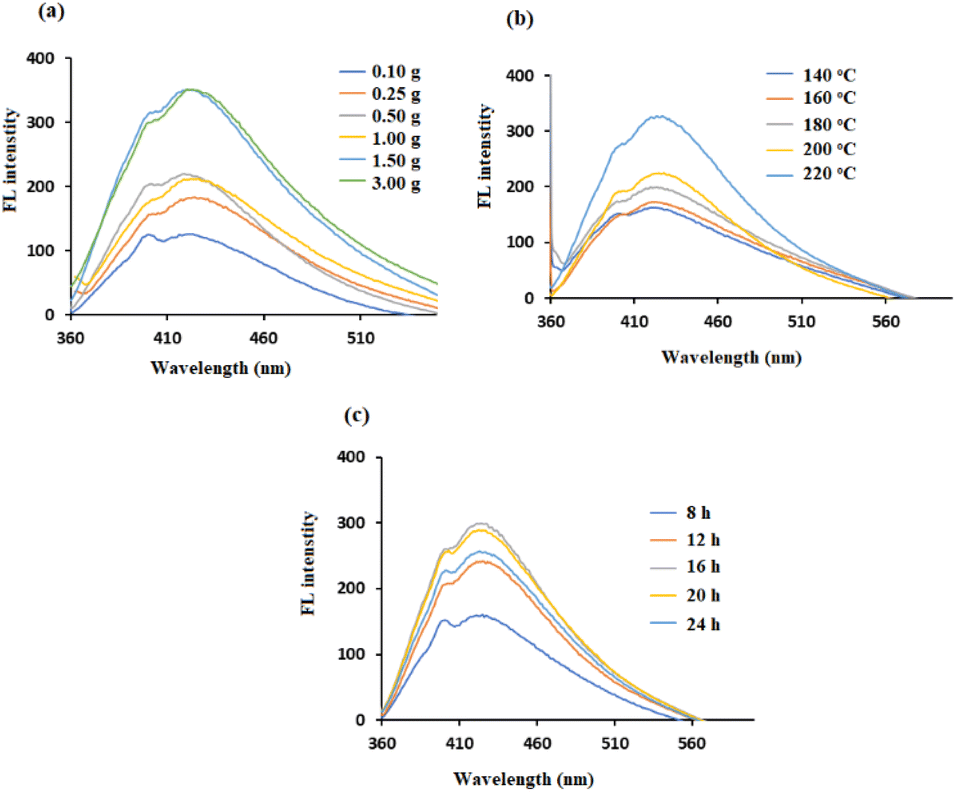 | ||
| Fig. 4 FL spectra of (a) lignin-based CDs with different amounts of lignin at 200 °C for 12 h, (b) lignin-based CDs with different temperatures for 12 h, and (c) lignin-based CDs with different durations of hydrothermal treatment at 220 °C. | ||
The hydrothermal temperature of the synthesis plays an important role in the quality of the CDs produced. As shown in Fig. 4b, the lignin-based CDs were prepared over a wide temperature range from 140 to 220 °C. The maximum autoclave temperature (i.e., 220 °C) resulted in the highest photoluminescence signal. The enhancement of the FL signal with increasing temperature was due to increased functionalization of the CDs, which added more additional electrons to the π-system. As a result, at 220 °C, the CDs had more excited electrons at the π*-energy level than did the CDs at lower temperatures.30
The reaction time was adjusted from 8 to 24 hours to maximize the photoelectric performance. The color of synthesized CDs solutions became darker with increasing heating time from 8 to 16 hours, suggesting an increase in the CDs concentrations. Thereafter, the color became lighter with longer heating times (16–24 h). This observation is consistent with the results in Fig. 4c, where the maximum increase in the FL intensity occurs at 16 hours. These results are in agreement with previous studies and suggest that inadequate reaction occurs during short heating periods, but excessive carbonization leads to the agglomeration of CDs at longer heating times.31
It was reported that the doping with chlorine can generate more energy levels, resulting in additional electron transitions in band structures of CDs. On the other hand, phosphorus was selected for modification by H3PO4 regardless of its FL intensity since the first experiments showed its sensitivity to the studied drug. Moreover, the combination of H3PO4 with HCl (to prepare PClCDs) reduces photobleaching compared to that of PCDs or ClCDs when H3PO4 or HCl is used alone, which was also reported by Wang et al.46 The amounts of dopant precursors were varied to optimize the optical properties of the CDs. As shown in Fig. 5a, different amounts of H3PO4 were used, and as the amount increased, the FL decreased, possibly due to the decrease in pH, which affects the solubility of lignin. It also appears that the shift to longer wavelengths (from 425 to 447 nm) is due to the addition of acid as a result of new fluorescent centers. The FL intensity increased when the amount of HCl increased from 0.00 to 3 mmol (Fig. 5b), which was selected as the optimal HCl dosage per 1.50 g of lignin. The FL intensity then decreased as the amount of HCl increased to 10 mM.
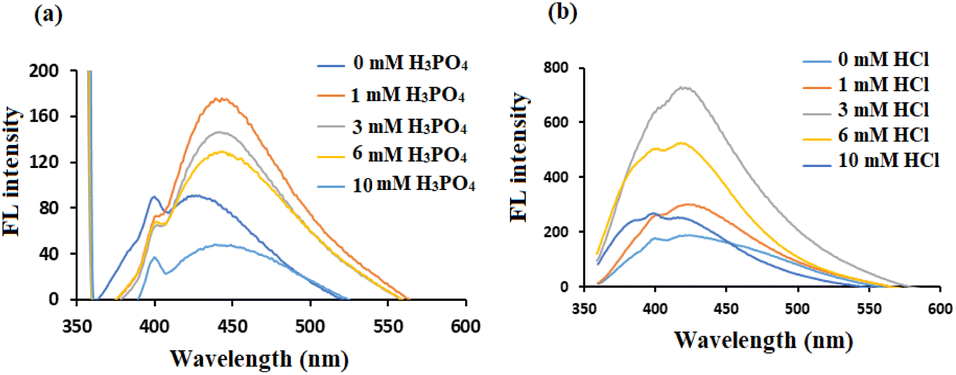 | ||
| Fig. 5 FL spectra of modified lignin-based CDs with different amounts of dopant precursors (a) H3PO4 and (b) HCl. | ||
3.3. Stability of synthesized lignin-based CDs
The synthesized lignin-based CDs have outstanding FL characteristics and are highly soluble in water. To increase the range of their applications, it is necessary to look at their stability. The stability of the lignin-based CDs was thoroughly examined by observing their FL properties in a salt solution, at different pH values (ranging from 2 to 12, adjusted using 6 M of HCl and NaOH), under a UV lamp, and after extended periods of storage. As depicted in Fig. 6a, the FL of the CDs remains nearly constant when exposed to a high concentration NaCl solution (2.0 mol L−1), indicating that the CDs are capable of withstanding high levels of ionic strength. The emission intensities of the CDs exhibit a high level of stability throughout the pH range of 5.0–9.0 (Fig. 6b) but decrease in strongly acidic or alkaline environments. The FL intensity decreases at high pH levels due to the increased proportion of negative charges and the inhibition of the π–π* and n–π* transitions.5 Under acidic conditions, the presence of adjacent hydroxyl groups on the surfaces of CDs facilitates the formation of hydrogen bonds, leading to their aggregation. Consequently, the FL emission of CDs is suppressed.47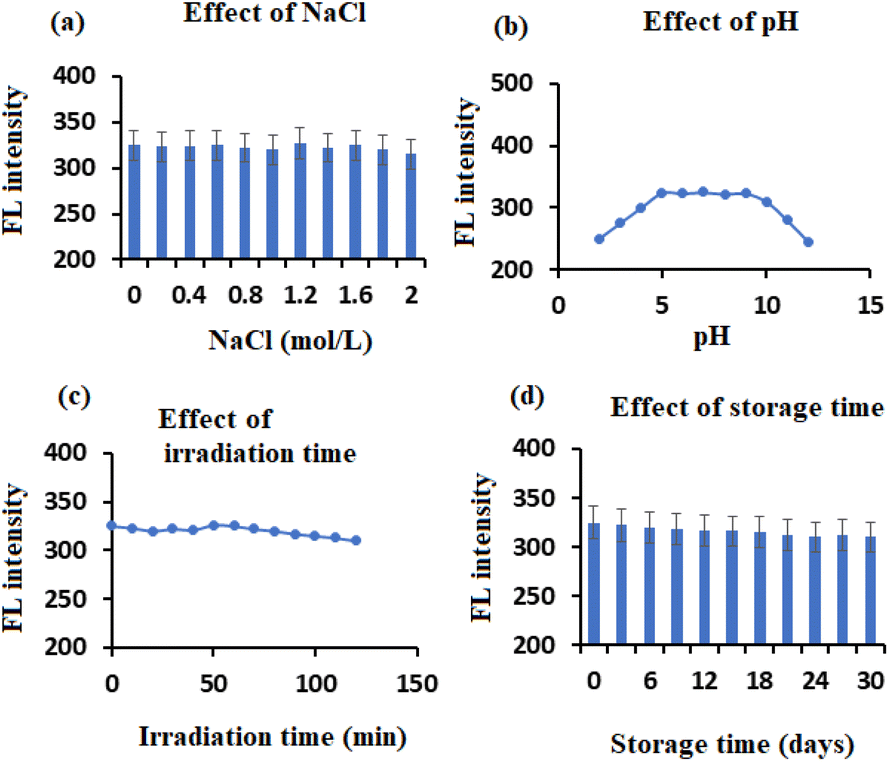 | ||
| Fig. 6 Factors affecting the stability of synthesized lignin-based CDs: (a) effect of NaCl, (b) effect of pH, (c) effect of irradiation time, and (d) effect of storage time. | ||
Following continuous exposure to a UV lamp for 120 minutes, as shown in Fig. 6c, there was no discernible alteration in the FL intensity of the synthesized CDs. This indicates that the CDs exhibit a high level of photostability. The CDs powder obtained by lyophilization can be easily dispersed in DI water without experiencing any aggregation. This property is advantageous for transportation and storage purposes. After being stored in a refrigerator at 4 °C for approximately 30 days, the CDs solution remained visually consistent, with no signs of separation or precipitation. Additionally, the FL intensity remains nearly unaltered, as shown in Fig. 6d. The results provide strong evidence of the excellent stability of the synthesized lignin-based CDs, which is advantageous for future applications.
3.4. Characterization of the prepared CDs
The formation of PClCDs was confirmed using a variety of spectroscopic and microscopic techniques, including UV-vis spectroscopy, photoluminescence, FT-IR spectroscopy, particle size analysis, EDX analysis, XRD analysis, SEM, and TEM. Fig. 7a shows a TEM image of PClCDs. It can be clearly seen that the samples are uniformly dispersed and have no obvious aggregation. Considering that TEM can provide the most accurate result for determining the size of nanoparticles, TEM was used to measure the size of the synthesized CDs using ImageJ software. For this purpose, particle size distribution curves were generated from different TEM images, and a good number of particles were randomly selected. Fig. 7b shows that the particle size distribution of PClCDs is in the range of 1.58–10.60 nm, with an average particle size of 5.08 ± 1.60 nm obtained by statistically analyzing 300 randomly selected particles using ImageJ software and a Gaussian fit curve. The results indicated that the particle size distributions of the synthesized PClCDs were approximately 10 nm or smaller. This suggests that the PClCDs are in the form of carbon quantum dots, which exhibit a quantum size effect and a quantum confinement effect. These effects cause the energy band to change from continuous to discrete at the molecular level. In contrast, the solid-state of PClCDs was observed in the SEM image and AFM 3D image (Fig. 7c and d). It is well known that in nanomaterials such as carbon dots, conjugation leads to interactions between functional groups, which facilitates the formation of aggregates.48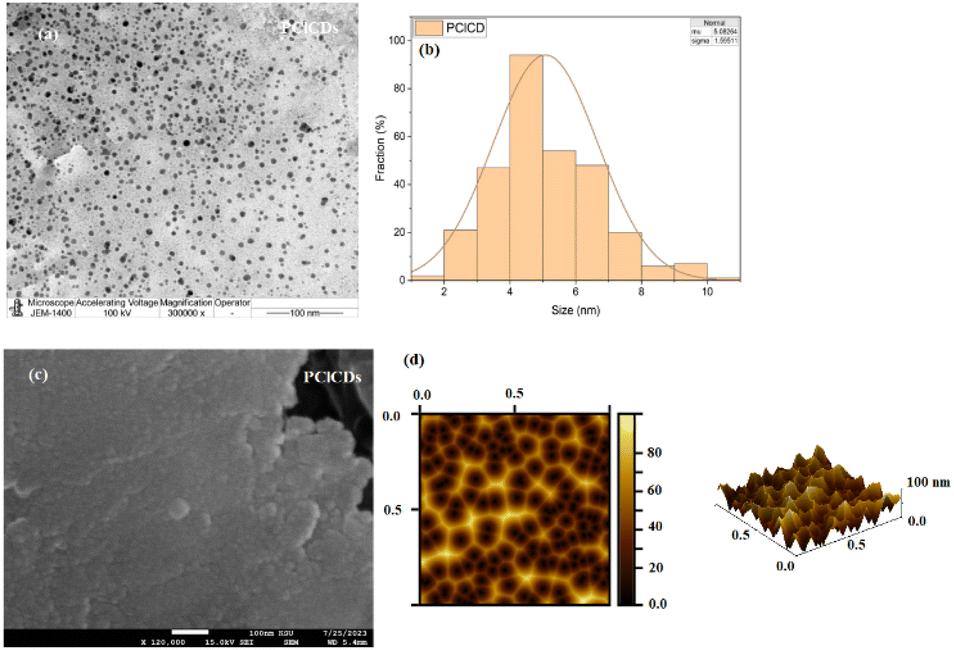 | ||
| Fig. 7 (a) TEM image, (b) average particle size distribution using ImageJ software, (c) SEM image, and (d) AFM 3D image of PClCDs. | ||
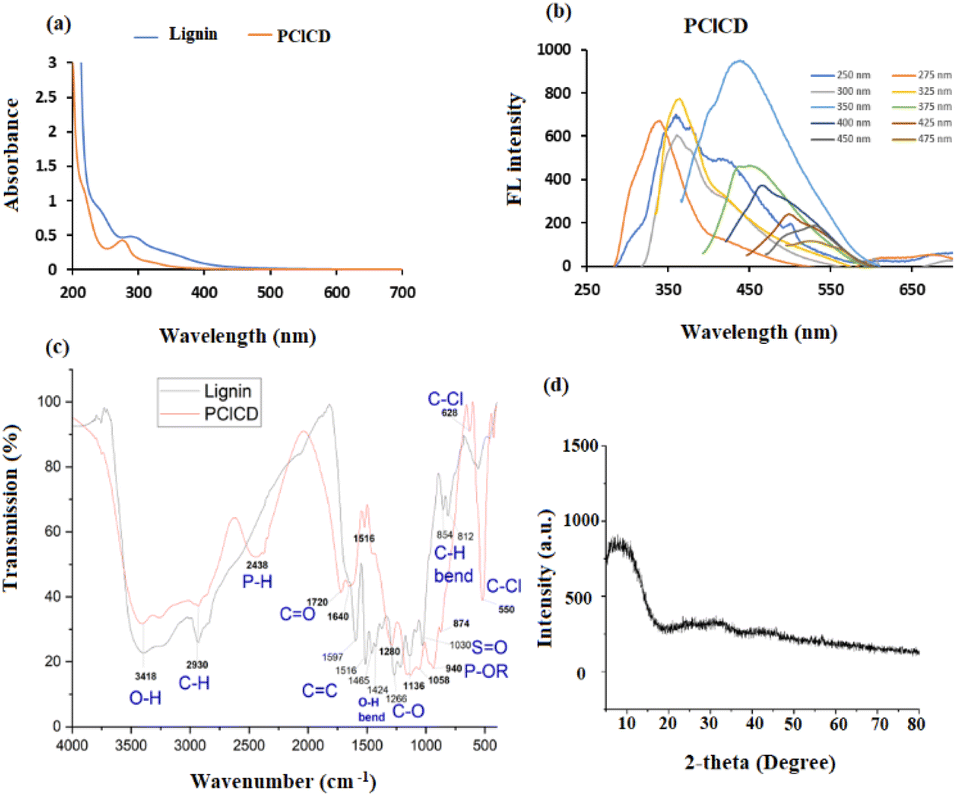
UV-vis spectroscopic investigations were used to visualize the optical absorption behavior of the produced CDs. The studies were conducted at a fixed path length of 1.0 cm, covering a range of 200–700 nm. In general, the CDs exhibit a largely unremarkable absorption profile, consistent with that of semiconductor nanoparticles with indirect bandgaps.49 As shown by the orange lines in Fig. 8a, there is a distinct peak for PClCDs at approximately 275 nm, which is due to the n → π* transition of the C![[double bond, length as m-dash]](https://www.rsc.org/images/entities/char_e001.gif) O band and the excited defect surface states induced by heteroatoms, as described in the literature.50 The synthesized CDs exhibited a blue shift to 275 nm in comparison to the UV-vis absorption peak of pure lignin (blue line) at 295 nm. This blue shift was likely caused by the aromatic ring substituents of the CDs, which resulted in an increase in steric hindrance. Consequently, the level of conjugation is reduced, making electron transfer from n to π* more difficult, so the absorption wavelength eventually decreases. In addition, there is a shoulder peak at 245 nm in lignin and a shift to approximately 222 nm in PClCDs, which is related to π → π* of aromatic sp2 hybridization in CC bonds, which was also noted by Meng et al.51 The blueshift of this absorption peak can be explained by the quantum confinement effect upon the addition of dopants.
O band and the excited defect surface states induced by heteroatoms, as described in the literature.50 The synthesized CDs exhibited a blue shift to 275 nm in comparison to the UV-vis absorption peak of pure lignin (blue line) at 295 nm. This blue shift was likely caused by the aromatic ring substituents of the CDs, which resulted in an increase in steric hindrance. Consequently, the level of conjugation is reduced, making electron transfer from n to π* more difficult, so the absorption wavelength eventually decreases. In addition, there is a shoulder peak at 245 nm in lignin and a shift to approximately 222 nm in PClCDs, which is related to π → π* of aromatic sp2 hybridization in CC bonds, which was also noted by Meng et al.51 The blueshift of this absorption peak can be explained by the quantum confinement effect upon the addition of dopants.
 | ||
| Fig. 8 (a) UV-vis absorption spectra of lignin and PClCDs, (b) FL spectra of PClCDs at different λex values, (c) FT-IR spectra of lignin and PClCDs, and (d) XRD spectrum of PClCDs. | ||
The energy of the bandgap of the synthesized CDs was determined using the formula Eg = hν, where Eg is the bandgap energy, ν is the frequency and h is a blank constant. The band gap of PClCDs is 4.51 eV, which is comparable to the values in the literature.52 The band gap of 4.51 eV at 275 nm is caused by the transition from the highest occupied molecular orbital (HOMO) to the lowest unoccupied molecular orbital (LUMO) of the surface state. On the other hand, the band gap of 5.58 eV at 222 nm is likely due to the transition from the HOMO to the LUMO of the carbon core.53
The photoluminescence (PL) behavior of the synthesized CDs, a classical feature of carbon dots, was characterized by FL spectroscopy. The PClCDs solutions were yellow in daylight and glowed blue when irradiated with UV light. The FL emission spectra of the CDs were analyzed at different excitation wavelengths from 250 to 475 nm in steps of 25 nm. Fig. 8b shows the emission spectra of PClCDs at different excitation wavelengths. They exhibit blueshifts (with increasing excitation wavelengths from 250 to 275 nm) and redshifts (with increasing excitation wavelengths from 350 to 475 nm) and a decrease in the emission intensity with increasing excitation wavelength. This behavior was also observed by Hao et al.,50 who explained that the excitation-dependent FL spectra might be related to the π* → n transition of the surface-bound functionalities, which is common in CDs. Moreover, the emission peak at 363 nm did not shift with increasing excitation wavelength from 300 to 325 nm, indicating excitation-independent emission at these wavelengths. The highest emission intensity of PClCDs was observed at an excitation wavelength of approximately 350 nm, while the excitation wavelength of 275 nm is in good agreement with their UV-vis spectra, implying that there are hardly any nonradiative transitions at this wavelength, and they could be used for further studies.
By comparing the QY of PClCDs at 350 nm to that of quinine sulfate (QY = 54% in 0.1 mol per L−1 H2SO4), it was determined that the QY of PClCDs is 37.7%. This value is greater than the QY obtained from synthesizing CDs using biomass waste.54 Introducing electron-withdrawing atoms through doping greatly enhances the emission of FL. The P and Cl atoms exhibit strong electron-withdrawing properties, and the combined impact of codoping promotes the creation of bandgaps, leading to a high QY.
Fig. 8c shows the FTIR spectra of lignin and PClCD, which exhibit a broad absorption band at 3418 cm−1 corresponding to O–H stretching, indicating that hydroxyl groups were formed on their surfaces, increasing their hydrophilicity. The peak at 2930 cm−1 was attributed to C–H stretching in lignin and PClCD. In addition, the strong absorption peaks at 1720 (CO stretching vibrations), 1640 and 1516 (CC stretching vibrations), and 1280 and 1136 cm−1 (C–O stretching vibrations) indicate that the PClCDs terminated with carboxylic acid groups, further supporting their dispersibility in water. Two new absorption peaks appeared at 2438 cm−1 (stretching vibrations of P–H) and 940 cm−1 (stretching vibrations of P–OR), indicating successful doping of the CDs with P, while the peaks at 628 cm−1 and 550 cm−1 (stretching vibrations of C–Cl) indicated successful doping of the CDs with Cl.46 All the previous results indicate that many functional groups are present on the surface of the synthesized PClCDs, leading to high hydrophilicity and stability in aqueous solution, as well as excellent FL performance, sensor specificity, and good biological compatibility. Moreover, the FTIR spectrum of the developed CDs strongly resembled that of lignin, which can be attributed to the fact that it was used as the starting material.
The crystallographic pattern of the synthesized CDs was analyzed by X-ray diffraction. Most of the prepared CDs show a broad diffraction peak at approximately ∼22°–25°, indicating the formation of amorphous graphitic carbon with an interplanar spacing (d-spacing) between 0.2–0.35 nm.55 The interlayer spacing was calculated according to the Bragg equation as shown below (2 d Sin θ = nλ), where n is the order of reflection (1), λ is the wavelength (0.15418 nm is used in the present study), and d is the interplanar spacing. In Fig. 8d, the XRD pattern of PClCDs shows a broad and weak peak at approximately 8.1°, indicating disordered carbon atoms with an amorphous character, and the position of the peaks can be attributed to the graphene oxide-like structure of PClCDs. Karimi et al. prepared GO, which showed an intense characteristic diffraction peak (001) at 2θ = 10.1°, and the GOQDs showed an intense peak (001) at 2θ = 7.3°;56 these peaks could be shifted here due to the presence of functional groups on the PClCDs structure. The interlayer distance (d-spacing) of the PClCDs increased to 1.09 nm due to the GO-like structure, which provides greater uptake of oxygen species and functionalization of the sides and edges of GO sheets by oxygen-containing groups (carboxylic acids, alcohols, epoxides) or adsorbed H2O or CO2 molecules between two graphene sheets compared to graphite.57
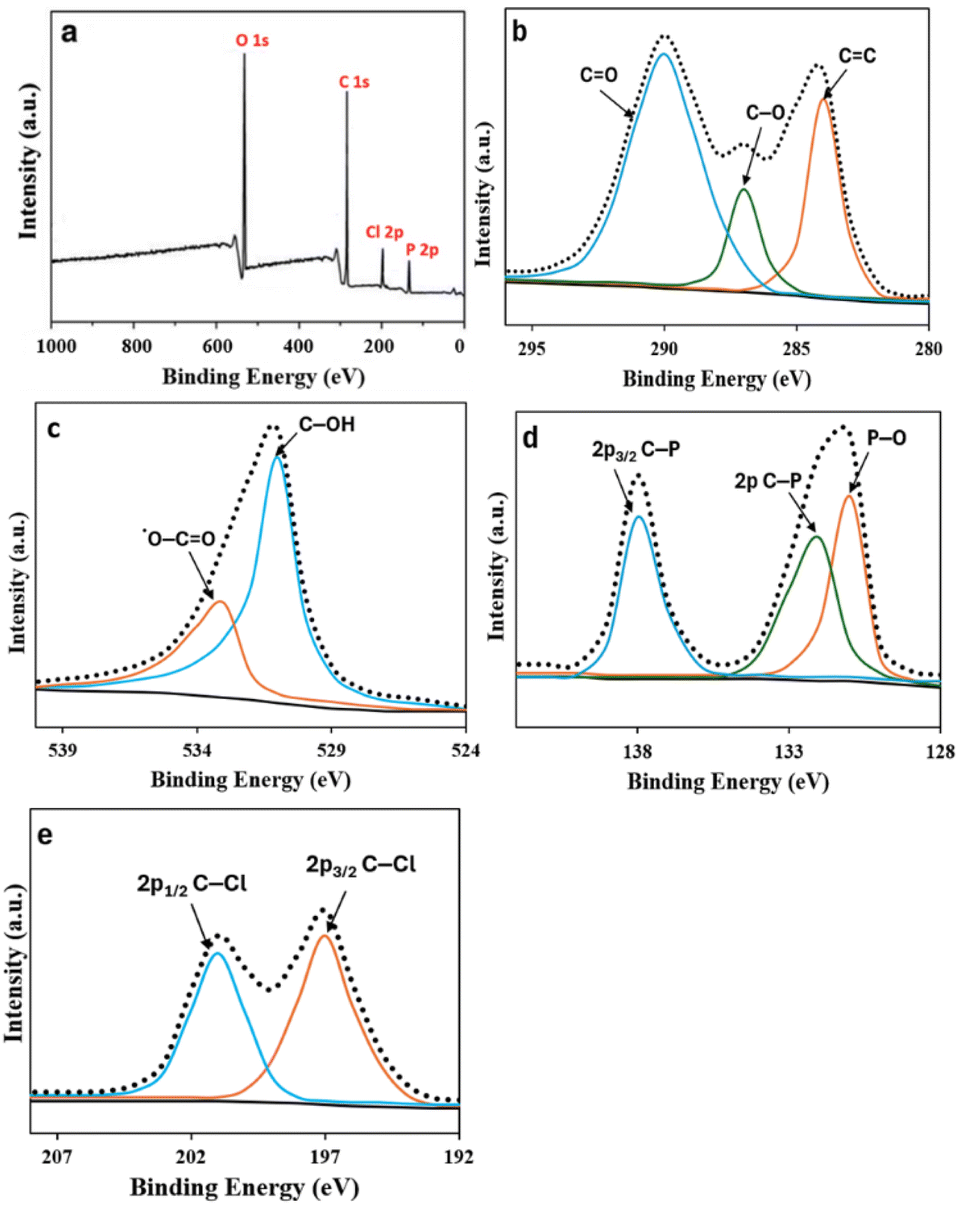
XPS analysis was conducted to gain a deeper comprehension of the elemental composition and surface structure of PClCDs. Fig. 9a displays a survey spectrum of the XPS results of PClCDs, revealing four distinct peaks at 529.7, 283.9, 199.4, and 128.6 eV, corresponding to O 1s, C 1s, Cl 2p, and P 2p, respectively. Fig. 9b displays the C 1s spectra of the PClCDs, which can be categorized into three peaks situated at 289.7, 287.2, and 284.1 eV. These peaks correspond to the presence of CO, C–O, and CC bonds, respectively. This suggests that the surface of the developed PClCDs had many carboxylic acid, hydroxyl, and carbonyl groups, which aligns with the findings from the FTIR analysis. The O 1s spectrum (Fig. 9c) exhibits two distinct peaks at 533.2 and 530.8 eV, corresponding to the presence of *O–CO and C–OH, respectively. The P 2p spectrum (Fig. 9d) shows three peaks at 138.1, 132.3, and 130.9 eV, corresponding to 2p3/2 C–P, 2p C–P, and P–O, respectively. The Cl 2p spectrum (Fig. 9e) splits into two distinct peaks at 201.6 and 197.2 eV, corresponding to 2p1/2 C–Cl and 2p3/2 C–Cl, respectively.58,59 In general, the PClCDs were effectively doped with P and Cl heteroatoms and surface-functionalized with many functional groups, enhancing their water solubility and stability.
 | ||
| Fig. 9 (a) XPS survey scan, (b) C 1s, (c) O 1s, (d) P 2p, and (e) Cl 2p of PClCDs. | ||
EDX analysis was performed to determine the chemical composition of the synthesized PClCDs. According to the EDX spectrum, PClCDs contain a reasonable percentage phosphorus and chlorine in addition to carbon, oxygen, and a small amount of sulfur. The weight percentages and atomic percentages of the elements are shown in Fig. 10. The absence of any additional peaks belonging to other elements suggested that the synthesized CDs were pure. The results indicate a high oxygen content, which is consistent with the XRD results of the graphene oxide-like structure and the large d-spacing, which is due to the presence of large amounts of oxygen-containing functional groups originating from the starting material (lignin).
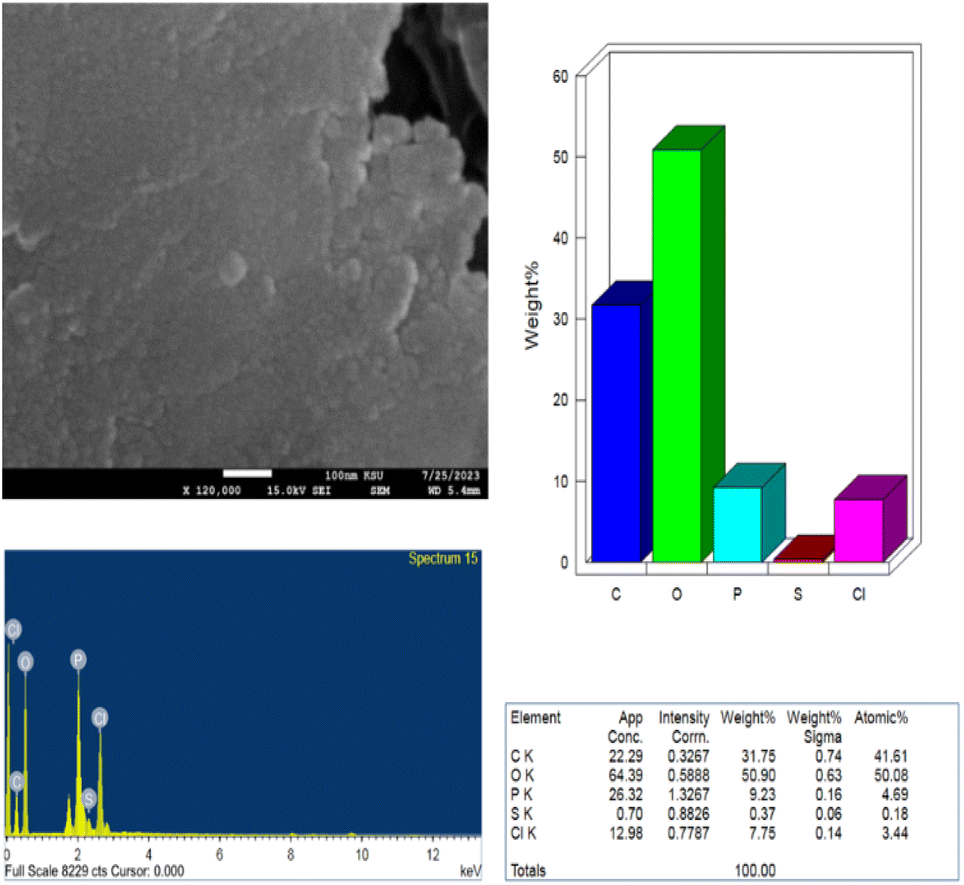 | ||
| Fig. 10 EDX analysis of the synthesized PClCDs. | ||
3.5. VAL determination
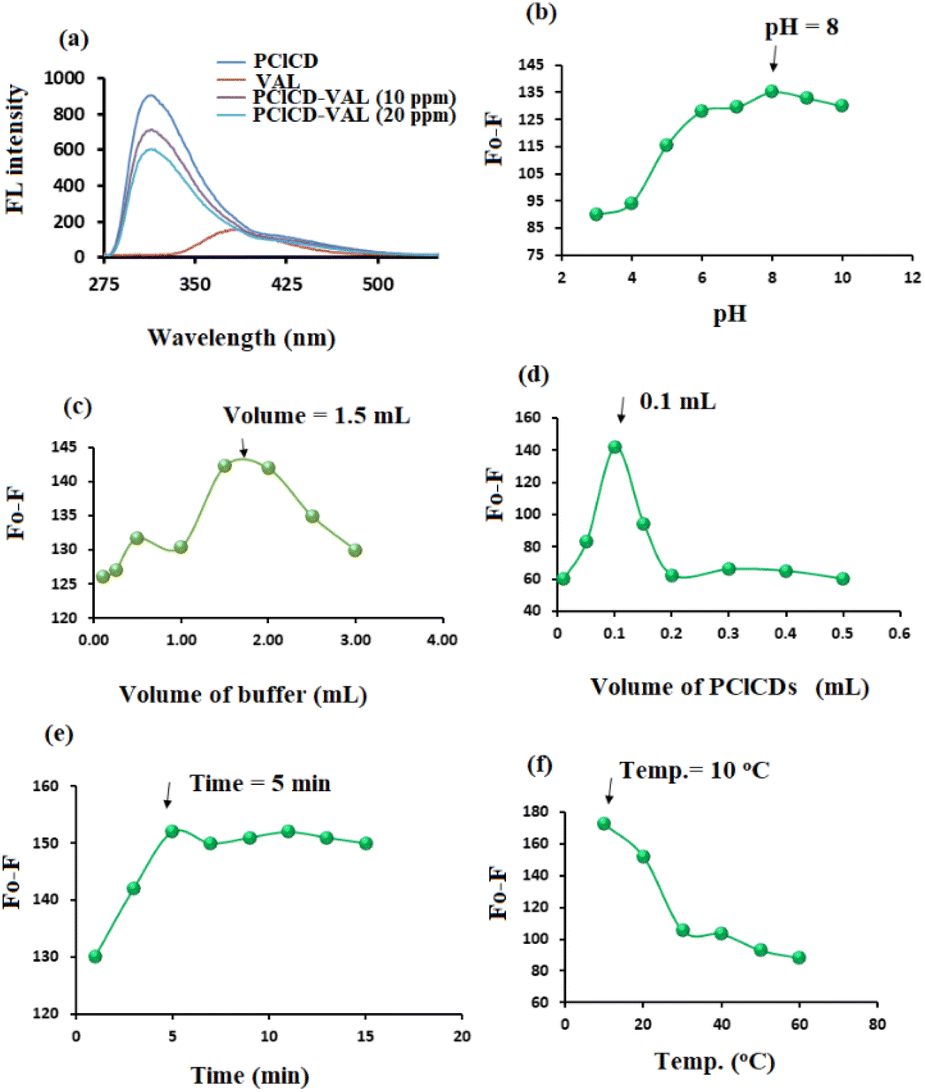 | ||
| Fig. 11 (a) FL spectra of different concentrations of VAL solutions with and without the presence of PClCDs; effects of (b) pH, (c) buffer volume, (d) PClCDs volume, (e) response time and (f) temperature on the F0 − F of 10 μg mL−1 VAL in the presence of PClCDs. | ||
| Parameter | Studied range | PClCDs-VAL |
|---|---|---|
| λex/em (nm) | 250–800 | 275/313 |
| ex:em slit |
1.5–10:1.5–10 |
3:5 |
| Buffer pH | 3–10 | 8 |
| Buffer volume (mL) | 0.25–3.00 | 1.50 |
| CDs volume (mL) | 0.01–0.50 | 0.10 |
| Time (min) | 1–15 | 5 |
| Temperature (oC) | 10–60 | 10 |
A suitable volume of PClCDs in the range of 0.01–0.50 mL was tested by using a 10 μg mL−1 VAL solution. The highest value of F0 − F was obtained after adding 0.10 mL of PClCDs to the VAL solution (Fig. 11d). Different time intervals (1–15 min) were used to study the effect of response time on the quenching of FL of CDs by the addition of 10 μg mL−1 VAL solution. Fig. 11e shows that the FL intensity of the PClCDs-VAL system gradually decreased with the addition of VAL. After 5 min, the FL intensity of PClCDs-VAL changed slightly and then tended to remain stable.
The effect of temperature in the range of 10–60 °C on the quenching of FL of CDs by VAL was investigated. The test was performed by cooling the samples and the blank in an ice bath or by heating in a water bath. The best quenching of FL of CDs by VAL occurred at 10 °C for the PClCDs-VAL system. As the temperature increased, the F0 − F values decreased (Fig. 11f).
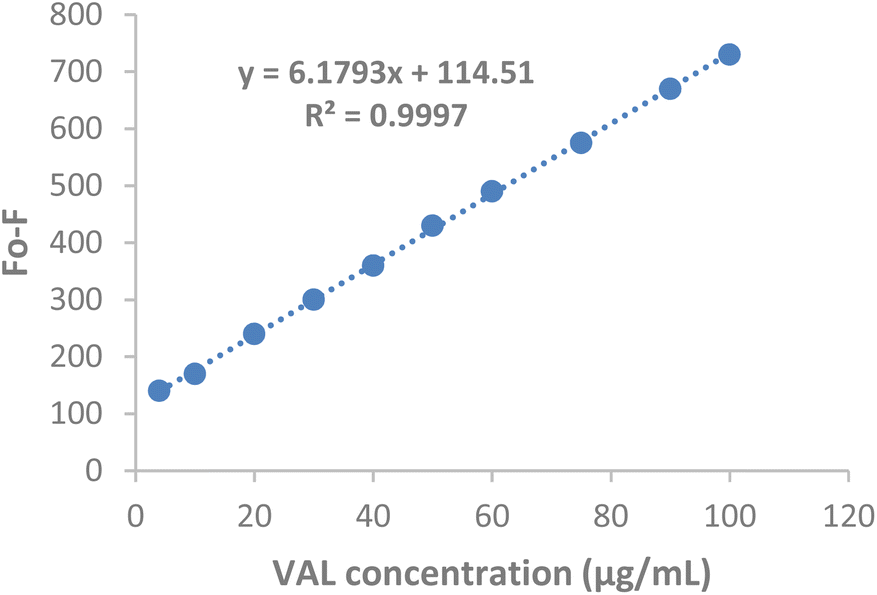 | ||
| Fig. 12 Calibration curve for VAL determination in the presence of PClCDs. | ||
| Parameters | PClCDs-VAL |
|---|---|
| Concentration range (μg mL−1) | 4–100 |
| Slope | 6.1793 |
| Intercept | 114.51 |
| Correlation coefficient (r) | 0.9998 |
| Standard deviation of slope (Sb) | 0.040 |
| Standard deviation of intercept (Sa) | 2.294 |
| LOD (μg mL−1) | 1.23 |
| LOQ (μg mL−1) | 3.71 |
The LOD and LOQ for VAL determination in the presence of PClCDs using the suggested spectrofluorometric method were calculated using LOD = 3.3Sa/slope and LOQ = 10Sa/slope. The LOD was 1.23 μg mL−1, and the LOQ was 3.71 μg mL−1 for the PClCDs-VAL system (Table 2).
The accuracy of the proposed spectrofluorometric method was evaluated using ten authentic VAL samples, and the results obtained were estimated as the mean recovery percentage ± standard deviation (mean ± SD). Excellent detection with high accuracy was observed, and the percent recovery was reported to be 100.55 ± 1.19% in the presence of PClCDs (Table 3).
| Taken (μg mL−1) | Found (μg mL−1) | %Recovery | |
|---|---|---|---|
| a %SE = SD/√n.b %RSD= (SD/mean) × 100. | |||
| Statistical analysis | 4 | 4.10 | 102.50 |
| 10 | 9.98 | 99.80 | |
| 20 | 20.31 | 101.54 | |
| 30 | 30.02 | 100.06 | |
| 40 | 39.73 | 99.32 | |
| 50 | 51.06 | 102.11 | |
| 60 | 60.77 | 101.28 | |
| 75 | 74.52 | 99.36 | |
| 90 | 89.90 | 99.88 | |
| 100 | 99.61 | 99.61 | |
| Mean ± SD | 100.55 ± 1.19 | ||
| n | 10 | ||
| Variance | 1.42 | ||
| %SEa | 0.38 | ||
| %RSDb | 1.19 | ||
The precision of the suggested approach was evaluated by both intraday and interday testing. The study examined three distinct concentrations of the drug, each tested three times (n = 3), and the resulting data were analyzed as a percentage of the relative standard deviation (RSD%). As summarized in Table 4, the calculated mean RSD% was 0.87% for the intraday determination of VAL in the presence of PClCDs. Nevertheless, the interday test demonstrated a mean RSD of 0.51% for the previous medicine in the presence of PClCDs. These results are less than 2% and demonstrate the high precision of the proposed method.
| Taken, μg mL−1 | % Recovery ± SDa | %RSDb | %Errorc | |
|---|---|---|---|---|
| a Mean of three determinations.b %RSD = (SD/mean) ×100.c %Error = %RSD/√n. | ||||
| Intraday precision | 4 | 96.17 ± 1.26 | 1.31 | 0.76 |
| 50 | 99.47 ± 1.03 | 1.03 | 0.60 | |
| 100 | 99.59 ± 0.28 | 0.28 | 0.16 | |
| Interday precision | 4 | 98.67 ± 0.76 | 0.77 | 0.45 |
| 50 | 98.95 ± 0.51 | 0.51 | 0.30 | |
| 100 | 99.59 ± 0.26 | 0.26 | 0.15 | |
The robustness of the spectrofluorometric method for the determination of VAL was investigated by making small changes in the method parameters. The robustness of the methods was checked by changing the pH (±1.0) and the volume of the PClCDs (±0.01 mL). The F0 − F was not affected by these changes. The calculated percent recovery was 99.26 ± 0.80% in the presence of PClCDs. The ruggedness of the spectrofluorometric detection method for the determination of VAL was investigated by measuring the same samples under different conditions, including in different laboratories, by different operators, and with different equipment. The F0 − F was not affected by these changes. The percent recovery was 99.73 ± 0.50% in the presence of PClCDs.
The selectivity of the proposed spectrofluorometric method for the determination of VAL was evaluated in the presence of different classes of antihypertensive drugs and also in the presence of various coadditives and possible interfering species in pharmaceutical preparations. Fig. 13 shows the changes in fluorescence intensity in the presence of the coadditive species in the PClCDs-VAL system. The results revealed no notable interferences; thus, the proposed spectrofluorometric system for the quantification of VAL can be considered as a selective method.
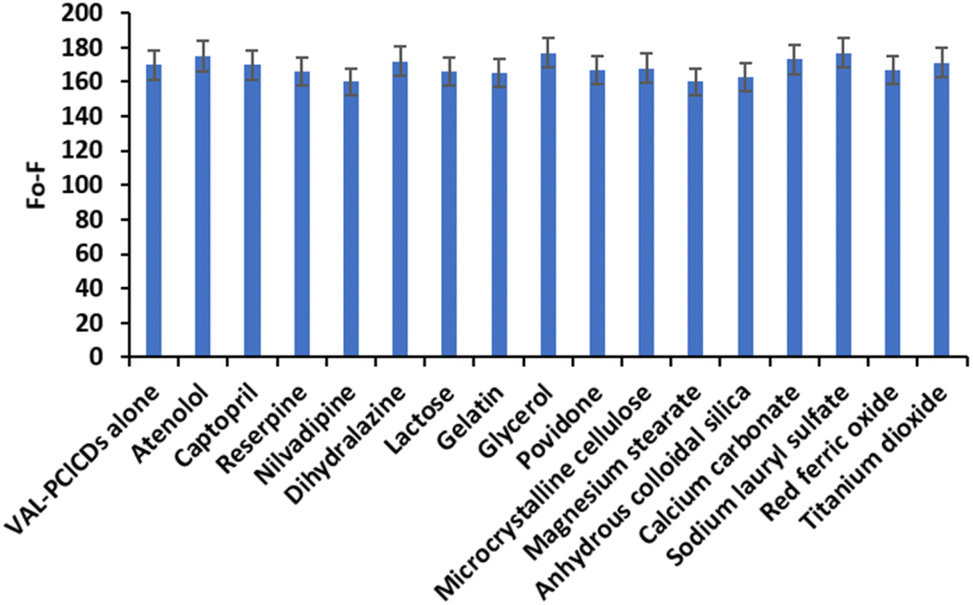 | ||
| Fig. 13 Selectivity of the PClCDs-VAL system for different species at a concentration of 10 μg per mL VAL. | ||
The proposed method was used to estimate the tested medication in its pharmaceutical preparation (Diovan® 160 mg VAL per tablet), and the results are showed in Table 5. The calculated results were 98.94 ± 0.80 in the presence of PClCDs. The results were examined by statistical analysis using Student's t-test and the variance ratio F-test. These results were then compared with the results of a previously published approach, as shown in Table 5.61
| Taken (μg mL−1) | %Recovery | |
|---|---|---|
| a %SE = SD/√n.b %RSD = (SD/mean) × 100.c The figures between parentheses are the tabulated t- and F values at p < 0.05. | ||
| Statistical analysis | 4 | 97.50 |
| 20 | 99.10 | |
| 40 | 98.58 | |
| 60 | 99.67 | |
| 80 | 99.38 | |
| 100 | 99.40 | |
| Mean ± SD | 98.94 ± 0.80 | |
| n | 6 | |
| Variance | 0.63 | |
| %SEa | 0.32 | |
| %RSDb | 0.80 | |
| t-Test | 2.06 (2.228)c | |
| F-Test | 3.76 (5.05)c | |
| Reported | 99.69 ± 0.41 | |
| Method61 | (n = 6) | |
The present spectrofluorometric method for VAL determination is superior or comparable to previously reported analytical methods (Table 6), such as spectrophotometric, fluorescence, electrochemical, and chromatographic methods. It should be noted that the developed probes are based on the use of simple and available instruments, nontoxic materials, and mild synthetic conditions.
| Analytical techniques | Reagents | Linearity (μg mL−1) | LOD (μg mL−1) | Reference |
|---|---|---|---|---|
| Spectrophotometry | VAL and nebivolol dissolved in methanol | 4–80 | 1.183 | 62 |
| Fluorescence | VAL and amlodipine dissolved in methanol and HCl | 0.25–4.50 | 0.04 | 63 |
| Fluorescence | VAL and sacubitril dissolved in methanol | 0.06–0.20 | 0.0126 | 64 |
| Fluorescence | VAL, amlodipine and Fe3O4 nanoparticles | 0.03–0.27 | 0.004 | 65 |
| Fluorescence | VAL, metolazone and acetic acid as a solvent | 0.01–0.1 | 0.003 | 66 |
| Electrochemical | VAL, amlodipine and hydrochlorothiazide by graphene oxide-chitosan sensor | 0.4–100.2 | 0.04 | 67 |
| Chromatography | VAL and nebivolol in potassium hydrogen phosphate buffer, acetonitrile and methanol | 48–112 | 0.78 | 68 |
| Chromatography | VAL, acetonitrile and acetate buffer as a mobile phase | 0.005–10 | 0.001 | 69 |
| Chromatography | VAL, hydrochlorothiazide, irbesartan, acetonitrile and ammonium acetate buffer | 0.05–6.02 | 0.050 | 70 |
| Proposed method | Spectrofluorometric measurement in the presence of PClCDs | 4.0–100.0 | 1.23 | PClCDs-VAL |
| F0/F = 1 + KSV [Q] | (2) |
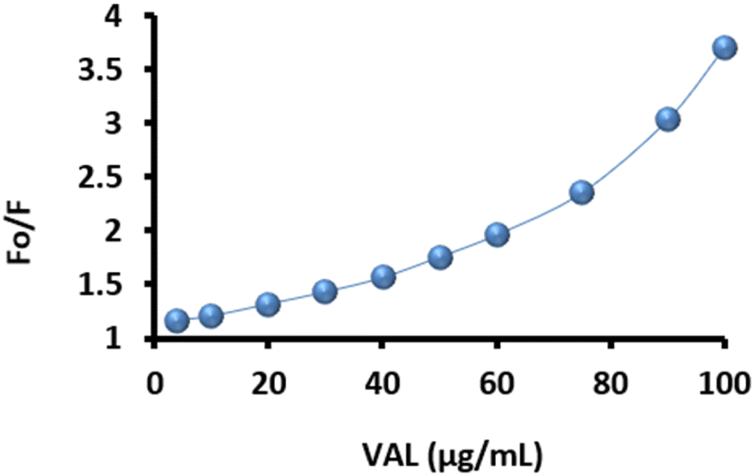
The S–V plots shown in Fig. 14 for the PClCDs-VAL system demonstrate that the FL intensities of the PClCDs gradually decreased (increased F0/F) with the addition of VAL from 4–100 μg mL−1. These results illustrate that VAL can effectively quench the FL of PClCDs. However, the S–V plots of the PClCDs-VAL system do not fit a conventional linear relationship between F0/F and the concentration of VAL; thus, both static and dynamic quenching mechanisms were speculated to be responsible for the quenching process of these systems. According to Tanwar et al., the presence of a second-order polynomial curve in the S–V plot indicates that both static and dynamic quenching mechanisms are present in any sensing system.71 The S–V equation of the polynomial curve is given by (3):
| F0/F = (1 + KSV[Q]) (1 + KS[Q]) = 1 + (KSV + KS)[Q] + KSVKS[Q]2 | (3) |
 | ||
| Fig. 14 Nonlinear Stern–Volmer plots for PClCDs-VAL system. | ||
4. Conclusions
The present work reports a facile and eco-friendly approach for CDs synthesis using lignin extracted from date seeds as a precursor under different conditions and modifications. Phosphorous and chlorine co-doped CDs derived from lignin are successfully obtained by a hydrothermal treatment in alkaline solution. In addition to being environmentally friendly and availability, low-cost biomass production offers greater benefits than other chemical approaches. The synthesized lignin-based CDs exhibit good fluorescence capabilities and demonstrate excellent solubility in water, along with satisfactory stability. The characterization of the produced CDs indicated the presence of several functional groups with a graphene oxide-like structure. The quantum yield and average size of the synthesized CDs were 37.7% and 5.08 ± 1.60 nm, respectively. The synthesized probe was used for sensitive and selective detection of VAL. The linear range and the detection limit were 4.0–100.0 μg mL−1 and 1.23 μg mL−1, respectively. This research is essential for expanding the exploration and use of fluorescent CDs in the field of drug detection.Data availability
The data supporting the outcomes of this study have been incorporated within the manuscript.Author contributions
All the authors contributed to the study conception and design; material preparation, data collection, and analysis were performed by Fatemah Aldakhil, Nawal A. Alarfaj, Salma A. Al-Tamimi, Maha F. El-Tohamy. The first draft of the manuscript was written by Fatemah Aldakhil. All the authors read and approved the final manuscript.Conflicts of interest
There are no conflicts to declare.Acknowledgements
This research was funded by Researchers Supporting Project Number (RSP2024R272), King Saud University, Riyadh, Saudi Arabia.References
- Y. Liu, H. Huang, W. Cao, B. Mao, Y. Liu and Z. Kang, Mater. Chem. Front., 2020, 4, 1586–1613 RSC.
- S. Perumal, R. Atchudan, T. N. J. I. Edison and Y. R. Lee, J. Environ. Chem. Eng., 2021, 9, 105802 CrossRef CAS.
- X. Yao, R. E. Lewis and C. L. Haynes, Acc. Chem. Res., 2022, 55, 3312–3321 CrossRef CAS PubMed.
- W. Meng, X. Bai, B. Wang, Z. Liu, S. Lu and B. Yang, Energy Environ. Mater., 2019, 2, 172–192 CrossRef CAS.
- W. Liu, C. Ning, R. Sang, Q. Hou and Y. Ni, Ind. Crops Prod., 2021, 171, 113963 CrossRef CAS.
- S. Kang, K. M. Kim, K. jung, Y. Son, S. Mhin, J. H. Ryu, K. B. Shim, B. Lee, H. S. Han and T. Song, Sci. Rep., 2019, 9, 1–7 CrossRef PubMed.
- Z. Wei, H. Li, S. Liu, W. Wang, H. Chen, L. Xiao, C. Ren and X. Chen, Anal. Chem., 2019, 91, 15477–15483 CrossRef CAS PubMed.
- I. C. Novoa-De León, J. Johny, S. Vázquez-Rodríguez, N. García-Gómez, S. Carranza-Bernal, I. Mendivil, S. Shaji and S. Sepúlveda-Guzmán, Carbon, 2019, 150, 455–464 CrossRef.
- M. Zhao, Appl. Sci., 2018, 8, 1–10 CAS.
- S. Gu, C. Te Hsieh, Y. M. Chiang, D. Y. Tzou, Y. F. Chen and Y. A. Gandomi, Mater. Chem. Phys., 2018, 215, 104–111 CrossRef CAS.
- F. J. Chao-Mujica, L. Garcia-Hernández, S. Camacho-López, M. Camacho-López, M. A. Camacho-López, D. Reyes Contreras, A. Pérez-Rodríguez, J. P. Peña-Caravaca, A. Páez-Rodríguez, J. G. Darias-Gonzalez, L. Hernandez-Tabares, O. Arias de Fuentes, E. Prokhorov, N. Torres-Figueredo, E. Reguera and L. F. Desdin-García, J. Appl. Phys., 2021, 129, 1–11 CrossRef.
- R. Liu, J. Alloys Compd., 2021, 855, 157456 CrossRef CAS.
- L. Ge, G. Hu, F. Zhao, X. Wang, Z. Ma and R. Liu, Appl. Phys. A: Mater. Sci. Process., 2021, 127, 1–14 CrossRef.
- D. Zhang, D. Chao, C. Yu, Q. Zhu, S. Zhou, L. Tian and L. Zhou, J. Phys. Chem. Lett., 2021, 12, 8939–8946 CrossRef CAS PubMed.
- T. Ghosh, R. Sahoo, S. K. Ghosh, P. Banerji and N. C. Das, Front. Chem. Sci. Eng., 2023, 17, 536–547 CrossRef CAS.
- L. Sun, Z. Mo, Q. Li, D. Zheng, X. Qiu and X. Pan, Int. J. Biol. Macromol., 2021, 175, 516–525 CrossRef CAS PubMed.
- L. Cui, X. Ren, M. Sun, H. Liu and L. Xia, Nanomaterials, 2021, 11, 3419 CrossRef CAS PubMed.
- T. C. Wareing, P. Gentile and A. N. Phan, ACS Nano, 2021, 15, 15471–15501 CrossRef CAS PubMed.
- U. M. Ahmad, N. Ji, H. Li, Q. Wu, C. Song, Q. Liu, D. Ma and X. Lu, Ind. Crops Prod., 2021, 170, 113646 CrossRef CAS.
- F. Bouaziz, A. Ben Abdeddayem, M. Koubaa, F. J. Barba, K. Ben Jeddou, I. Kacem, R. E. Ghorbel and S. E. Chaabouni, Separations, 2020, 7, 67 CrossRef CAS.
- X. Yang, S. Hou, T. Chu, J. Han, R. Li, Y. Guo, Y. Gong, H. Li and Z. Wan, Ind. Crops Prod., 2021, 167, 113507 CrossRef CAS.
- P. H. Li, H. Zhou, Y. T. Tao, Y. M. Wei, J. P. Ren and W. J. Wu, Sustain. Energy Fuels, 2022, 6, 4582–4597 RSC.
- K. Chen, W. Qing, W. Hu, M. Lu, Y. Wang and X. Liu, Spectrochim. Acta, Part A, 2019, 213, 228–234 CrossRef CAS PubMed.
- X. Jiang, Y. Shi, X. Liu, M. Wang, P. Song, F. Xu and X. Zhang, Polymers, 2018, 10, 1282 CrossRef PubMed.
- Y. Shi, X. Liu, M. Wang, J. Huang, X. Jiang, J. Pang, F. Xu and X. Zhang, Int. J. Biol. Macromol., 2019, 128, 537–545 CrossRef CAS PubMed.
- J. Ahn, Y. Song, J. E. Kwon, S. H. Lee, K. S. Park, S. Kim, J. Woo and H. Kim, Mater. Sci. Eng. C, 2019, 102, 106–112 CrossRef CAS PubMed.
- Q. Zhang, H. Song, M. Yu, H. Zhang and Z. Li, J. Fluoresc., 2021, 31, 659–666 CrossRef CAS PubMed.
- L. Zhang, H. Wang, Q. Hu, X. Guo, L. Li, S. Shuang, X. Gong and C. Dong, Microchim. Acta, 2019, 186, 1–13 CrossRef PubMed.
- L. Zhu, D. Li, H. Lu, S. Zhang and H. Gao, Int. J. Biol. Macromol., 2022, 194, 254–263 CrossRef CAS PubMed.
- N. Amin, A. Afkhami, L. Hosseinzadeh and T. Madrakian, Anal. Chim. Acta, 2018, 1030, 183–193 CrossRef CAS PubMed.
- X. Tang, H. Wang, H. Yu, B. Bui, W. Zhang, S. Wang, M. Chen, L. Yuan, Z. Hu and W. Chen, Mater. Today Phys., 2022, 22, 100576 CrossRef CAS.
- A. Mousavi, R. Zare-Dorabei and S. H. Mosavi, Sci. Rep., 2021, 11, 1–10 CrossRef PubMed.
- S. Barua, S. Gogoi and R. Khan, Synth. Met., 2018, 244, 92–98 CrossRef CAS.
- M. A. Fravel, M. E. Ernst, R. L. Woods, L. Beilin, Z. Zhou, S. G. Orchard, E. Chowdhury, C. M. Reid, A. R. M. Saifuddin Ekram, S. E. Espinoza, M. R. Nelson, N. Stocks, K. R. Polkinghorne, R. Wolfe and J. Ryan, J. Hypertens., 2024, 42, 244–251 CrossRef CAS PubMed.
- S. Bhushan, X. Huang, F. Jiang and Z. Xiao, Curr. Probl. Cardiol., 2024, 49, 102464 CrossRef PubMed.
- A. Fozi, M. Bahram and R. Dadashi, Anal. Bioanal. Chem. Res., 2023, 10, 353–361 CAS.
- V. Göldner, J. Ulke, B. Kirchner, D. Skalka, M. Schmalz, S. Heuckeroth and U. Karst, Water Res., 2023, 244, 120525 CrossRef PubMed.
- N. S. Yamani and M. M. Annapurna, Res. J. Pharm. Technol., 2023, 16, 1484–1490 Search PubMed.
- N. Dinh Vu, H. Thi Tran, N. D. Bui, C. Duc Vu and H. Viet Nguyen, Int. J. Polym. Sci., 2017, 2017, 1–8 CrossRef.
- J. Sun, R. Ding and J. Yin, Biochem. Eng. J., 2022, 177, 108270 CrossRef CAS.
- S. Paul, N. S. Thakur, S. Chandna, V. Sagar and J. Bhaumik, ACS Appl. Nano Mater., 2022, 5, 2748–2761 CrossRef CAS.
- L. Zhu, D. Shen, Q. Liu, C. Wu and S. Gu, Appl. Surf. Sci., 2021, 565, 150526 CrossRef CAS.
- S. K. Bajpai, A. D'Souza and B. Suhail, Mater. Sci. Eng. B, 2019, 241, 92–99 CrossRef CAS.
- B. N. Jusuf, N. S. Sambudi, I. Isnaeni and S. Samsuri, J. Environ. Chem. Eng., 2018, 6, 7426–7433 CrossRef CAS.
- N. Chavoshi and B. Hemmateenejad, J. Fluoresc., 2021, 31, 455–463 CrossRef CAS PubMed.
- W. Wang, J. Peng, F. Li, B. Su, X. Chen and X. Chen, Microchim. Acta, 2019, 186, 1–9 CrossRef PubMed.
- M. L. Liu, B. Bin Chen, C. M. Li and C. Z. Huang, Sci. China Chem., 2019, 62, 968–981 CrossRef CAS.
- S. K. Ayilliath, S. R. Nair, G. C. Lakshmi and S. Kunnatheery, J. Fluoresc., 2021, 31, 847–852 CrossRef CAS PubMed.
- X. Y. Jiao, L. shuang Li, S. Qin, Y. Zhang, K. Huang and L. Xu, Colloids Surf. A Physicochem. Eng. Asp., 2019, 577, 306–314 CrossRef CAS.
- Y. Hao, H. Wang, Z. Wang, W. Dong, Q. Hu, S. Shuang, C. Dong and X. Gong, Microchim. Acta, 2021, 188, 1–15 CrossRef PubMed.
- Y. Meng, Y. Zhang, W. Sun, M. Wang, B. He, H. Chen and Q. Tang, Electrochim. Acta, 2017, 257, 259–266 CrossRef CAS.
- Y. Li, C. Liu, H. Sun, M. Chen, D. Hou, Y. Zheng, H. Xie, B. Zhou and X. Lin, Adv. Sci., 2023, 10, 2300543 CrossRef CAS PubMed.
- J. Yu, C. Liu, K. Yuan, Z. Lu, Y. Cheng, L. Li, X. Zhang, P. Jin, F. Meng and H. Liu, Nanomaterials, 2018, 8, 233 CrossRef PubMed.
- N. K. Khairol Anuar, H. L. Tan, Y. P. Lim, M. S. So’aib and N. F. Abu Bakar, Front. Energy Res., 2021, 9, 626549 CrossRef.
- X. Jiao, Y. Qiu, L. Zhang and X. Zhang, RSC Adv., 2017, 7, 52337–52344 RSC.
- B. Karimi and B. Ramezanzadeh, J. Colloid Interface Sci., 2017, 493, 62–76 CrossRef CAS PubMed.
- R. El-Hnayn, L. Canabady-Rochelle, C. Desmarets, L. Balan, H. Rinnert, O. Joubert, G. Medjahdi, H. Ben Ouada and R. Schneider, Nanomaterials, 2020, 10, 1–18 CrossRef PubMed.
- W. Wang, J. Peng, F. Li, B. Su, X. Chen and X. Chen, Microchim. Acta, 2019, 186, 1–9 CrossRef PubMed.
- Y. Hao, H. Wang, Z. Wang, W. Dong, Q. Hu, S. Shuang, C. Dong and X. Gong, Microchim. Acta, 2021, 188, 1–15 CrossRef PubMed.
- Z. Feng, Z. Li, X. Zhang, G. Xu and N. Zhou, J. Mater. Sci., 2018, 53, 6459–6470 CrossRef CAS.
- S. Tatar and S. Saglik, J. Pharm. Biomed. Anal., 2002, 30, 371–375 CrossRef CAS PubMed.
- A. H. Kamal, A. A. Marie and S. F. Hammad, Microchem. J., 2020, 155, 104741 CrossRef CAS.
- E. Dinç, Z. C. Ertekin and E. Büker, Spectrochim. Acta, Part A, 2017, 184, 255–261 CrossRef PubMed.
- R. M. Youssef, S. A. El-Nahass, S. A. Soliman and S. E. Younis, Spectrochim. Acta, Part A, 2021, 256, 119748 CrossRef CAS PubMed.
- A. M. El-Kosasy, S. M. Tawakkol, M. F. Ayad and A. I. Sheta, Talanta, 2015, 143, 402–413 CrossRef CAS PubMed.
- A. M. Zeid, R. Aboshabana and F. A. Ibrahim, Spectrochim. Acta, Part A, 2022, 267, 120591 CrossRef CAS PubMed.
- H. Nabizadeh, B. Feyzi, A. Ahmad Salarian, S. Reza Abtahi, A. Mohammadi and Z. Hami, Electroanalysis, 2023, 35, e202200022 CrossRef CAS.
- V. Rajoriya and V. Kashaw, Anal. Chem. Lett., 2017, 7, 520–530 CrossRef CAS.
- M. Kaabipour, S. Khodadoust and F. Zeraatpisheh, J. Sep. Sci., 2020, 43, 912–919 CrossRef CAS PubMed.
- A. Haque, M. Iqbal, M. K. Alamoudi and P. Alam, Separations, 2023, 10, 119 CrossRef CAS.
- A. S. Tanwar, R. Parui, R. Garai, M. A. Chanu and P. K. Iyer, ACS Meas. Sci. Au, 2022, 2, 23–30 CrossRef CAS PubMed.
| This journal is © The Royal Society of Chemistry 2024 |