DOI:
10.1039/D4RA02422B
(Paper)
RSC Adv., 2024,
14, 18258-18270
Probing the microstructure and deformation mechanism of an FeCoCrNiAl0.5 high entropy alloy during nanoscratching: a combined atomistic and physical model study†
Received
30th March 2024
, Accepted 2nd June 2024
First published on 7th June 2024
Abstract
High entropy alloys (HEAs) exhibit superior mechanical properties. However, the nanoscratching properties and deformation behaviour of FeCoCrNiAl0.5 HEAs remain unknown at the nanoscale. Here, we investigate the effect of scratching depth on the microstructural and tribological characteristics of an FeCoCrNiAl0.5 HEA using molecular dynamics simulations combined with a physical model. The scratching force increases significantly as the scratching depth increases. In the lower part of the scratching region, there is a clear atomic movement process, with the load generated in the normal direction causing the atoms to shift downwards. Noticeable shear bands are formed in the subsurface area, and they are both small and narrow compared with the pure Ni. The plastic deformation mechanism of the compressed surface is mainly governed by the formation and expansion of stacking faults during the subsurface evolution process. The evolution process of screw dislocations is similar to that of edge dislocations. In addition, the high strength and deformation resistance of FeCoCrNiAl0.5 HEAs are further evaluated by establishing a microstructure-based physical model. The combined effect of the lattice distortion strengthening and dislocation strengthening promotes the high strength of the FeCoCrNiAl0.5 HEA, which is significantly better than the single strengthening mechanism of pure metals. These results accelerate the understanding of the mechanical properties and deformation mechanisms of HEAs.
1. Introduction
High entropy alloys have been widely studied due to their excellent performance, such as high strength, high toughness, and high wear resistance.1–4 They have significant application prospects in aerospace, navigation, and nuclear fields.1–4 In many cases, wear resistance is a key factor determining the service life of metals. Therefore, it is a crucial issue to reveal the source of wear resistance of HEAs and fully tap into their wear resistance potential for the development of HEA applications.
Recently, extensive research efforts are being dedicated to exploring and developing the wear resistant HEAs.5–7 For example, FeCoCrNiMnAlx HEA coatings are produced by laser cladding, in which the addition of Al promoted phase transformation and grain refinement in the coating, thereby improving the wear resistance of the matrix steel.5 A series of AlxCo1.5CrFeNi1.5Tiy HEAs are designed and compared with traditional wear-resistant steel. The result show that the wear resistance of Co1.5CrFeNi1.5Ti and Al0.2Co1.5CrFeNi1.5Ti HEAs is at least two times better than that of traditional wear-resistant steels with similar hardness.6 The effect of the addition of C element on the hardness, scratch resistance, and wear resistance in CoCrFeMnNiCx HEAs is investigated, which found that the carbon alloying can enhance the hardness, and the wear rate of CoCrFeMnNiC0.6 is one order of magnitude lower that of CoCrFeMnNi.7
However, the relationship between microstructure evolution and properties during the friction process of HEAs urgently needs to be revealed, which is beneficial for understanding the origin of wear resistance and accelerating the design of the wear resistant HEAs. The change of microstructure on the worn surface of CoCrFeMnNi is investigated under different loads and temperatures, revealing the important role of precipitates and ultrafine grains in resisting plastic deformation.8 The severe lattice distortion and second particle strengthening caused by Al addition in AlxTiZrNbHf HEA improve the mechanical properties and wear resistance.9 In addition, significant research has been conducted on the wear mechanisms of HEAs.10,11 The previous research involves a comprehensive investigation of the various factors that influence wear, such as the applied normal load, sliding velocity, counter surface material, and type of sliding motion. The aim is to understand how these parameters affect the wear mechanisms that occur during the process.12–14
However, it is undeniable that directly identifying the dynamic microstructure evolution mechanism during the friction process through the experiment is cumbersome. Thus, molecular dynamics methods have also been widely applied in studying the wear mechanisms of HEAs.15–17 Using molecular dynamics (MD) simulation, the effect of composition, grain sizes, and cutting depths on the deformation behaviors and subsurface damages are investigated in the scratched NiCoCrFe HEAs. The higher Co content results hinder dislocation movement and reduce the stacking fault energy of the material.18 For the single-crystalline CoCrFeMnNi HEAs, the deformation twins exhibit a noticeable dependence on orientation, displaying anisotropy in tension and compression, and also exhibit distinct strain release across a larger volume and display strong onset stresses.19 The impact of precipitation volume fraction on the friction behavior of FeCrNi is investigated through MD simulation. It is observed that a lower precipitation volume fraction can effectively decrease the wear volume and wear rate during scratching, resulting in a reduced frictional force and friction coefficient. Thus, highlighting the potential for improving the frictional properties of FeCrNi through controlling precipitation volume fraction.20
In order to reveal the wear resistance mechanism and accelerate the design of the HEA with excellent frictional properties, this work focuses on the examination of the microstructure and deformation mechanism of FeCoCrNiAl0.5 HEAs induced by nanoscratching through atomic simulation. The study involves obtaining scratching-force or friction-coefficient and distance curves for various scratching depths. The investigation also includes analyzing the microstructure, surface morphology, and scratching mechanism. Additionally, the physical model is employed to investigate the strengthening mechanism of FeCoCrNiAl0.5 HEAs, and an attempt is made to reveal the microscopic wear mechanism.
2. Material and method
Fig. 1a shows the nanoscale model for the scratching process in the FeCoCrNiAl0.5 HEA. The molar ratio of the FeCoCrNiAl0.5 HEA substrate is 1 (Fe)![[thin space (1/6-em)]](https://www.rsc.org/images/entities/char_2009.gif) :
:![[thin space (1/6-em)]](https://www.rsc.org/images/entities/char_2009.gif) 1 (Co)
1 (Co)![[thin space (1/6-em)]](https://www.rsc.org/images/entities/char_2009.gif) :
:![[thin space (1/6-em)]](https://www.rsc.org/images/entities/char_2009.gif) 1 (Cr)
1 (Cr)![[thin space (1/6-em)]](https://www.rsc.org/images/entities/char_2009.gif) :
:![[thin space (1/6-em)]](https://www.rsc.org/images/entities/char_2009.gif) 1 (Ni)
1 (Ni)![[thin space (1/6-em)]](https://www.rsc.org/images/entities/char_2009.gif) :
:![[thin space (1/6-em)]](https://www.rsc.org/images/entities/char_2009.gif) 0.5 (Al). In addition, considering the type of crystal structure and the mechanical properties of the material, the pure Ni substrate is selected for comparison, to reveal the differences in scratching properties of FeCoCrNiAl0.5 HEA. This system contains the FeCoCrNiAl0.5 HEA substrate and the diamond tool. The FCC FeCoCrNiAl0.5 HEA substrate has the size of 685 Å × 180 Å × 36 Å, and it contains a total of 229
0.5 (Al). In addition, considering the type of crystal structure and the mechanical properties of the material, the pure Ni substrate is selected for comparison, to reveal the differences in scratching properties of FeCoCrNiAl0.5 HEA. This system contains the FeCoCrNiAl0.5 HEA substrate and the diamond tool. The FCC FeCoCrNiAl0.5 HEA substrate has the size of 685 Å × 180 Å × 36 Å, and it contains a total of 229![[thin space (1/6-em)]](https://www.rsc.org/images/entities/char_2009.gif) 986 atoms. A spherical diamond tool with 47
986 atoms. A spherical diamond tool with 47![[thin space (1/6-em)]](https://www.rsc.org/images/entities/char_2009.gif) 262 atoms has a radius of 50 Å. The crystal orientations of the substrate are [1 0 0] along the X axis, [0 1 0] along the Y axis, and [0 0 1] along the Z axis. The nanoscratching parameters of FeCoCrNiAl0.5 HEA are listed in Table 1. The HEA substrate is divided into three regions, namely, boundary region, thermostat region, and Newtonian region.20–22 The thicknesses of boundary and thermostat regions are 5 nm. The free boundary conditions are used to the x axis and z axis, and the periodic boundary condition is applied to the y axis. Before the scratching, the conjugate gradient algorithm is applied for minimizing the system energy. During the scratching process, a scratching tool has a constant speed along the x axis (Fig. 1a).
262 atoms has a radius of 50 Å. The crystal orientations of the substrate are [1 0 0] along the X axis, [0 1 0] along the Y axis, and [0 0 1] along the Z axis. The nanoscratching parameters of FeCoCrNiAl0.5 HEA are listed in Table 1. The HEA substrate is divided into three regions, namely, boundary region, thermostat region, and Newtonian region.20–22 The thicknesses of boundary and thermostat regions are 5 nm. The free boundary conditions are used to the x axis and z axis, and the periodic boundary condition is applied to the y axis. Before the scratching, the conjugate gradient algorithm is applied for minimizing the system energy. During the scratching process, a scratching tool has a constant speed along the x axis (Fig. 1a).
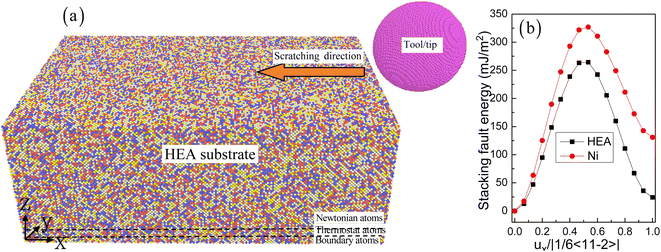 |
| | Fig. 1 The atomic model of the nanoscratching process in the FeCoCrNiAl0.5 HEA substrate (a). Fe, Fe,  Co, Co,  Cr, Cr,  Ni, Ni,  Al, and Al, and  C. The stacking fault energy as a function of normalized Burgers vector in HEA and Ni (b). C. The stacking fault energy as a function of normalized Burgers vector in HEA and Ni (b). | |
Table 1 Computational parameters used in the MD simulations
| Material |
FeCoCrNiAl0.5 substrate |
Tool |
| Dimension |
390 Å × 248 Å × 142 Å |
Radius 50 Å |
| Atomic count |
1![[thin space (1/6-em)]](https://www.rsc.org/images/entities/char_2009.gif) 241 241![[thin space (1/6-em)]](https://www.rsc.org/images/entities/char_2009.gif) 730 730 |
92![[thin space (1/6-em)]](https://www.rsc.org/images/entities/char_2009.gif) 297 297 |
| Time step |
1 fs |
|
| Initial temperature |
300 K |
|
| Cutting depth |
0.5 nm, 1.0 nm, 1.5 nm, and 2 nm |
|
| Scratching velocity |
25 m s−1 |
|
| Scratching distance |
36 nm |
|
| Scratching direction |
[1 0 0] direction on (1 0 0) surface |
|
Here, the embedded atom method (EAM) potential is adopted to describe the interactions of Fe-Co-Cr-Ni-Al.23 The EAM potential is expressed as a multi-body potential energy function in the following form
| |
 | (1) |
where
E is the total energy of the atomistic system which comprises the sum of the embedding energy
F on atom
i and the short-range pair potential energy
ϕ.
ρ is the electron density, and
α,
β are the element types of atoms
i and
j. The currently adopted EAM potential has been widely used to study the indention behavior and wear characteristics of the Fe-Co-Cr-Ni-Al HEA.
24–26
As the diamond tool is much harder than the FeCoCrNiAl0.5 HEA substrate, the tool is treated as a rigid body. Hence, the interaction between diamond atoms (C–C) in the tool is ignored in the present work. This consideration has also been widely applied in studying the interaction between the cutting tool atoms.24,26 The Morse potential is adopted to depict the interaction between cutting tool and HEA substrate, which is expressed as
| | |
U = D{exp[−2α(rij − r0)] − 2exp[−α(rij − r0)]}
| (2) |
where
D is the cohesion energy,
α is a constant parameter,
rij is the distance between the two atoms, and
r0 is the distance at equilibrium. The Lorentz–Berthelot mixing rule is used to estimate the interatomic Morse potential for materials
A and
B with parameters
D,
r0, and
α for a mixed pair of atoms. The related parameters of Morse potential are obtained from the previous work.
26,27
The MD simulation is using the large-scale atomic/molecular massively parallel simulator.28 The OVITO software is used to obtain the evolution of microstructure and dislocation characteristics.29 The common neighbor analysis (CNA) is utilized to identify the atom features before and after nanometric machining. Atoms are colored in accordance with the calculated CNA values: red atoms are stacking fault (SF) atoms, green atoms are FCC atoms, gray atoms are other atoms including surface atoms and dislocation cores, and BCC atoms are indicated in blue. For the FCC FeCoCrNiAl0.5 HEA, Fig. 1b shows the low stacking fault energy of 24 mJ m−2 computed from MD simulation, which is in good agreement with the previous report of 31.7 mJ m−2.30 The pure Ni shows higher stacking fault energy than that of HEA.
3. Result and discussion
3.1 The nanoscratching process
Fig. 2 shows the evolutionary trends of scratching force and friction coefficient as the scratching distance increases. Fig. 2a shows that the scratching force firstly increases with the increase of scratch distance. When the scratching force reaches a certain value, the scratch force maintains a constant value and evolves in fluctuations.27 However, Fig. 2b shows the coefficient of friction fluctuates as the scratching distance increases. But overall, it maintains a relatively stable friction coefficient value. Compared to the traditional alloys, the evolution of scratching force and changes in friction coefficient are very different. Thus, the evolution of scratching force is crucial for a deeper understanding of the friction and wear mechanism during the nanoscale scratching process.25,26 Traditional alloys exhibit the relatively stable fluctuations in friction coefficient. The abnormal friction coefficient of HEAs takes place due to the sharp changes in atomic distribution coupled with the drastic changes in atomic size.27 This leads to extreme changes in the friction coefficient. Understanding the friction coefficient of HEAs from the perspective of atomic size is helpful for developing new high wear resistant HEAs.1–4
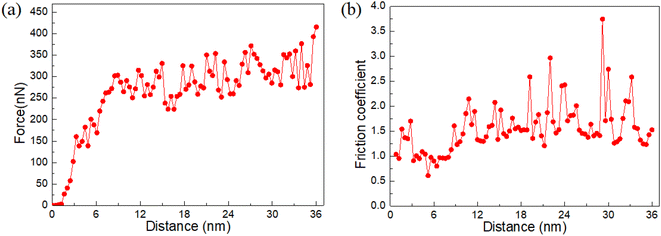 |
| | Fig. 2 (a) The scratching force with the increasing distance. (b) The friction coefficient with the increasing distance. | |
Fig. 3 illustrates the evolution process of surface morphology. As the tool moves, it comes into contact with the atoms on the surface. Due to that the tool is rigid, the atomic back is peeled off from the substrate in a shear removal mode. They gradually accumulate in front of the tool, forming chips. On both sides of the tool, chip flow is also formed. As the scratching time increases, it can be clearly observed that a large amount of chips is formed in front of the tool, but smaller chips are formed on both sides of the tool.30 Compared to the pure Ni, more chips are generated at the front end of the tool due to the high ductility in the HEA (Fig. S1†). This means that the accumulated chips ahead will further hinder the movement of the tool in the HEA. At the same time, a certain shape of protrusion is formed on the surface. This local protrusion is a manifestation of the macroscopic surface due to the evolution of surface microstructure. It should be noted that more local protrusions are more likely to concentrate on both sides of the tool, rather than in front of the tool. This indicates that more scratching force are released on both sides of the tool, and more load is generated in front of the tool to form chips.20–22 For a superficial understanding, the wear process of materials is a very interesting characterization tool.
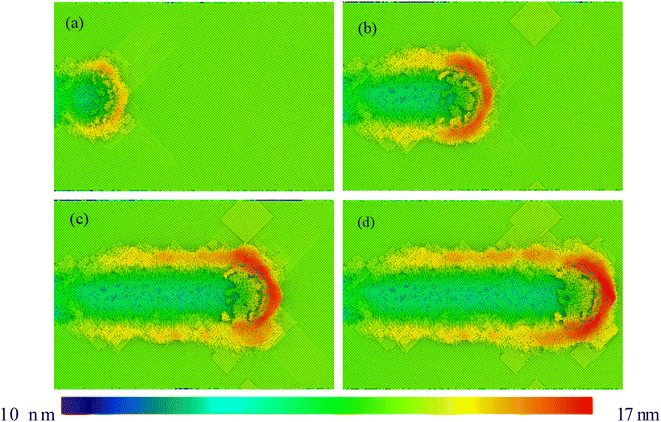 |
| | Fig. 3 The surface morphology of FeCoCrNiAl0.5 HEA with different scratching distances: (a) 10 nm, (b) 20 nm, (c) 30 nm, and (d) 36 nm. Atoms are colored according to the atomic height. | |
The atomic displacement stands for the deviation scale of atoms from their initial positions. Fig. 4 shows the evolution process of atomic positions with the increasing scratching distance. The color of atoms is adjusted based on their displacements. The red atoms represent larger atomic displacements, while the blue atoms represent atomic displacements that are almost zero. As the scratching distance increases, atoms are gradually pushed away from their original positions.24,27 In this way, the atoms on the surface will exhibit significant displacement changes. It is very meaningful to understand the formation of material chips. From Fig. 4, it can be seen that there is a clear atomic movement process in the lower part of the scratching. This also means that the load generated in the normal direction causes the atoms to shift downwards.24–27 However, this displacement is limited to only 1–2 nanometer scales. It has significantly protected the atomic properties of the subsurface, which is different from the properties of the traditional alloys and pure metal. The surfaces of pure Ni exhibit a significant atomic displacement (see Fig. S2†). However, HEAs suppress this process due to their high strength and wear resistance.31,32 This result further reveals one of the atomic scale reasons for the high wear resistance of HEAs.
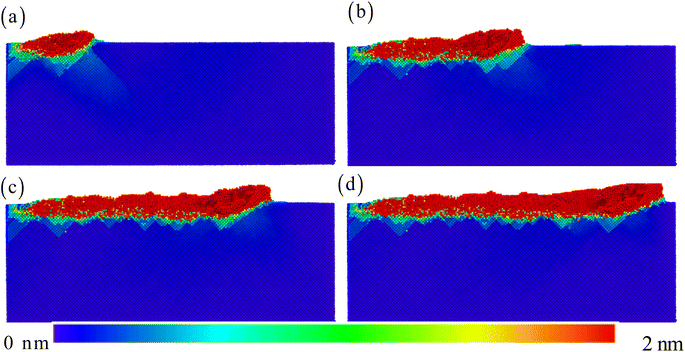 |
| | Fig. 4 The displacement distribution for the scratching distance: (a) 10 nm, (b) 20 nm, (c) 30 nm, and (d) 36 nm. | |
The local deformation of HEAs during scratching typically involves significant generation and proliferation of locally distorted shearing structures. This phenomenon is identified through the examination of atomic von Mises shear strain. Here, Fig. 5 shows the shear strain distribution at the atomic scale. The coloring of atoms is adjusted based on the shear strain value. The red atoms represent large atomic scale shear strains. The blue original atom represents low atomic shear strain, with atomic strain even reaching 0. It can be clearly observed that the distribution of the maximum atomic strain is concentrated in the surface region.24,27 Secondly, obvious shear bands are formed in the subsurface area, which are not only small but also narrow. This is very unfavorable for releasing shear stress, but it can also better preserve shear strain near the surface area. Such small-yet-long shear band zones are also observed in the pure Ni (Fig. S3†), but the shear strain zone in HEAs is significantly smaller. Meanwhile, the shear strain zone formed over time will no longer release strain over time.26–30 This is also beneficial for the formed surface, which can better maintain the initial shape.
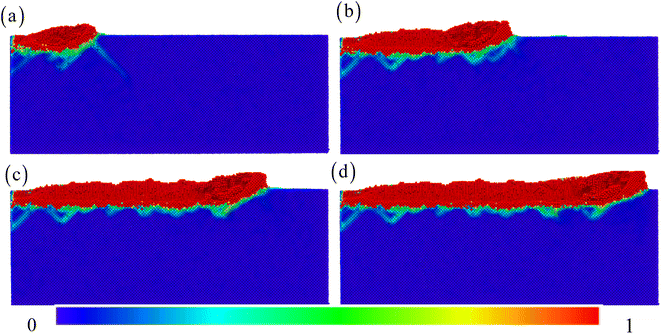 |
| | Fig. 5 The strain distribution for the scratching distance: (a) 10 nm, (b) 20 nm, (c) 30 nm, and (d) 36 nm. | |
Fig. 6 depicts the evolution process of the atomic structure in the surface area. During the wear process, the atoms of complete FCC and other structure are removed, leaving only the stacking fault structure. From the evolution process of the microstructure, we can clearly observe that the plastic deformation mechanism of the compressed surface is mainly dominated by the formation and expansion of stacking faults during the evolution process of the subsurface.27,33 Compared with the pure Ni (Fig. S4†), more stacking faults are concentrated together without further slip. Meanwhile, the plastic deformation only occurs directly below the tool. As the tool leaves, the stacking faults formed will be pushed to the surface and disappear. Finally, the scratching is completed and a large number of stacking faults are formed below,25–27 resulting in the maximum plastic deformation process.
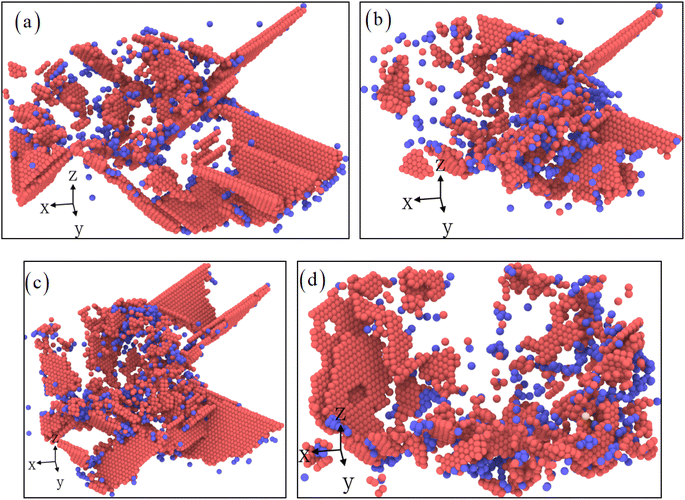 |
| | Fig. 6 The evolution of instantaneous microstructure for the scratching distance: (a) 10 nm, (b) 20 nm, (c) 30 nm, and (d) 36 nm.  FCC structure, and FCC structure, and  BCC structure. BCC structure. | |
Fig. 7 shows the evolution process of dislocation characteristic structures. The upper layer describes the evolution process of the dislocation type, while the lower layer describes the evolution process of the edge and screw dislocation. At the beginning of the scratching process, it can be clearly seen that the plastic deformation mainly relies on the Shockley partial dislocation.27,34 These dislocations are all composed of longer dislocation lines. As the scratching distance increases, longer dislocation lines transform into shorter dislocation lines, and more other types of dislocation lines generate. This phenomenon is different from observation in pure Ni (Fig. S5†), where longer dislocation line always exists on the subsurface. After the scratching process is completed, there are dislocation segments inside the matrix that are different from short ones, forming complex dislocation configurations.32–34 With the increasing scratching distance, the evolution process of screw dislocations is almost identical to that of edge dislocations. In the early stage of deformation, the proportion of screw dislocations is almost equivalent to that of edge dislocations. With the final evolution process, edge dislocations dominate the deformation mechanism of the material. The previous studies have shown that the plastic deformation, strength, and hardness of materials are dominated by the dislocation evolution process.1–4,14–16 This discussion provides us with a deeper understanding of the plastic deformation mechanism induced by nanoscratching of HEAs. This result can give us with clearer and deeper insights into the atomic scale hardening mechanism.
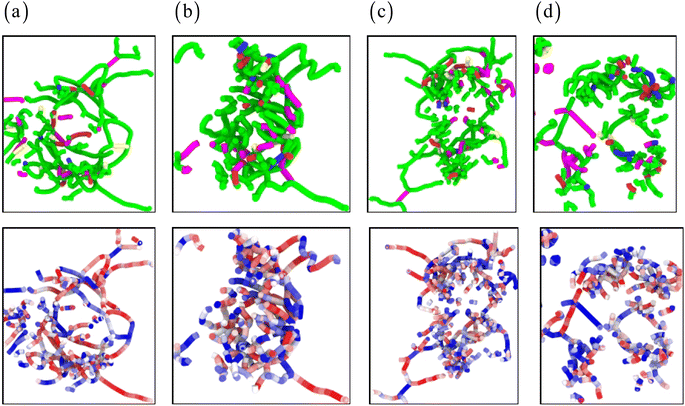 |
| | Fig. 7 The dislocation evolution with the scratching distance: (a) 10 nm, (b) 20 nm, (c) 30 nm, and (d) 36 nm. ( green line), <100> ( green line), <100> ( pink line), <110> ( pink line), <110> ( blue line), and other ( blue line), and other ( red line) dislocations in the upper row. The red line) dislocations in the upper row. The  blue lines stand for the edge dislocations, the blue lines stand for the edge dislocations, the  red lines stand for screw dislocations, and other color lines stand for the mixed dislocations in the lower row. red lines stand for screw dislocations, and other color lines stand for the mixed dislocations in the lower row. | |
3.2 Effect of scratching depth
Fig. 8 illustrates the influence of different scratching depths on scratch force and friction coefficient. Fig. 8a clearly illustrates that the scratching force increases significantly with the increase of scratching depth. As a result, the scratching force increases by nearly three times from a scratching depth of 0.5 nm to 2 nm. Fig. 9 shows the average scratching force and friction coefficient. It clearly describes that the increase in scratching depth is almost linearly proportional to the scratching force. However, the friction coefficient shows a relatively stable evolution process with fluctuations.27 However, it is worth noting that the coefficient of friction has not undergone such a significant evolution. For different scratching depths, the variation pattern of the depth friction coefficient is extremely similar, with only noticeable oscillations occurring in the local evolution region.20–22 The evolution mechanism behind this may have some necessary correlation with the evolution of stacking or dislocation, and we need to further explore the underlying mechanisms within this.
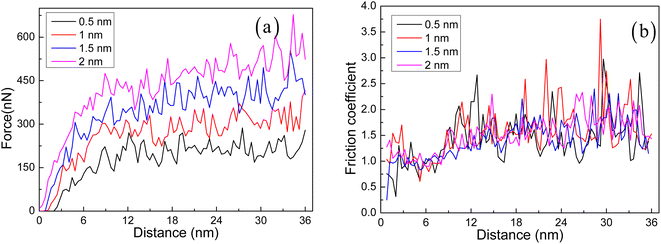 |
| | Fig. 8 Variation of scratching force (a), and friction coefficient (b) versus the scratching distance for different scratching depths. | |
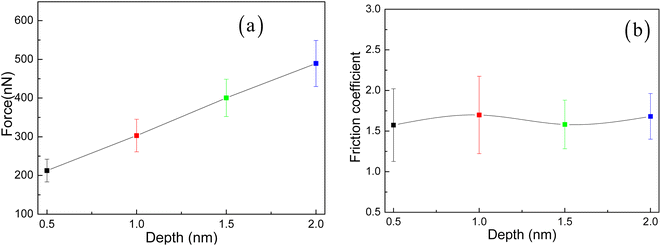 |
| | Fig. 9 The relationship curves of the average scratching force (a) and friction coefficient (b) versus scratching depth for different scratching depths. | |
To further reveal its potential factors, we analyzed the evolution process of the displacement distribution and shear strain distribution at different scratch depths, as shown in Fig. 10. It can be clearly seen that as the scratching depth increases, the displacement and strain distribution on the surface of the material gradually increase. It further confirms that larger scratching depths will cause stronger damage to the material structure, which is very detrimental to the engineering application of the HEAs.35 Fig. S6† shows the displacement distribution and shear strain distribution in pure Ni with the increasing scratching depth. Compared to the HEAs, the displacement and shear strain strongly depend upon the scratching depth due to the low atomic lattice distortion in pure Ni. In addition, the stress distribution is presented in Fig. 11 and S7.† The front end of the tool generates a strong compressive stress area. There is a complex stress distribution inside HEAs.20,21,27 At a few nanometers, the repeated transition from tensile to compressive stress state is presented in the HEA matrix (Fig. 11 and S7†).
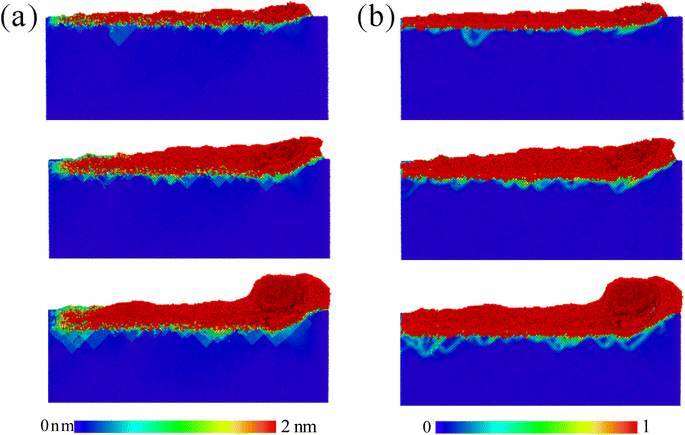 |
| | Fig. 10 The distribution of (a) displacement, and (b) shear strain for different scratching depths: 0.5 nm, 1.5 nm, and 2.0 nm. | |
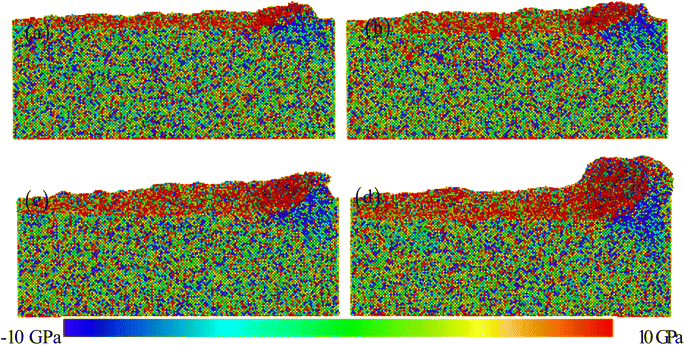 |
| | Fig. 11 The distribution of stress for different scratching depths: (a) 0.5 nm, (b) 1.0 nm, (c) 1.5 nm, and (d) 2.0 nm. | |
Finally, Fig. 12 further explores the evolution morphology characteristics of the surface morphology, microstructure, and dislocations during the final scratching process. Through the comparison in Fig. 12 and S8,† it can be clearly observed that larger scratching depths produce more chips and side flow on both sides. The larger scratching depth results in a large number of stacking fault structures, which are more incomplete.36,37 The evolution of dislocations further confirms this result. A small amount of dislocation features is generated from low scratching depth, and a large number of dislocation segments are generated from the scratching depth of 2 nm. The previous TEM images further confirm the generation of a large number of dislocations,38,39 as shown in Fig. 13. The low stacking faulting energy would cause partial dislocation nucleation (Fig. 1b), accompanied by the formation of a large number of stacking faults (Fig. 13).
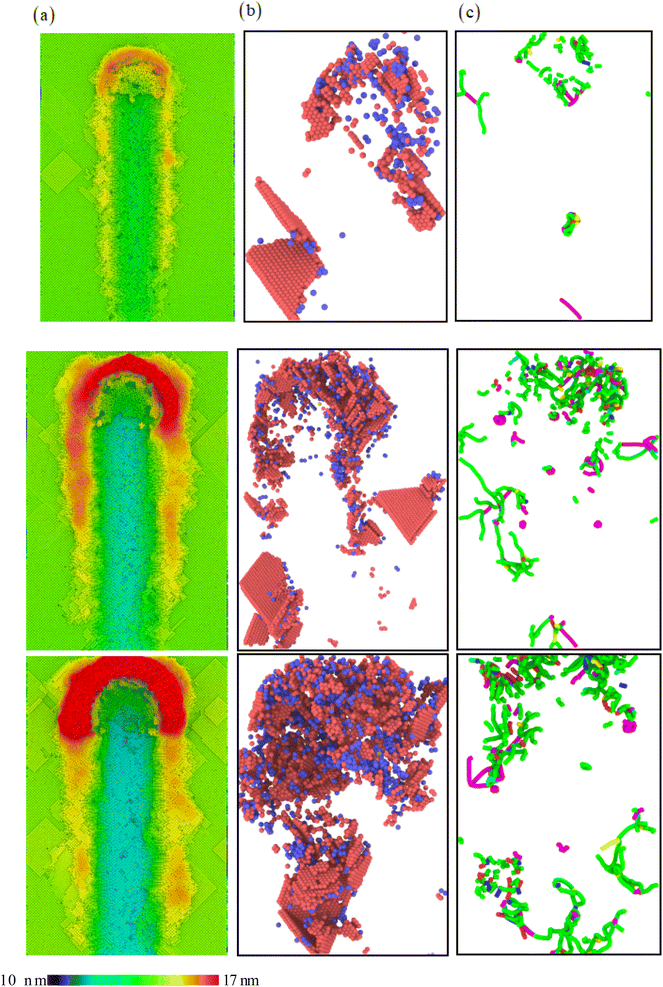 |
| | Fig. 12 The evolution of (a) surface morphology, (b) instantaneous microstructure and (c) dislocation for different scratching depths: 0.5 nm, 1.5 nm, and 2.0 nm. | |
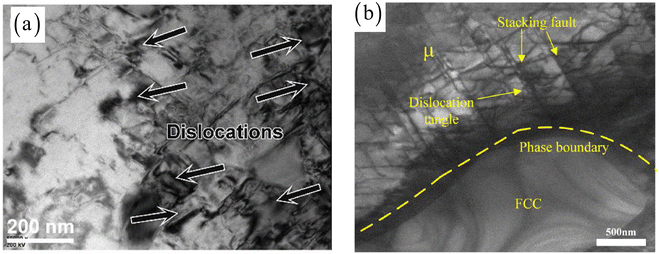 |
| | Fig. 13 TEM images for dislocation pile-up (a), dislocation entanglement and stacking fault (b).38,39 | |
4. Theoretical model
The evolution of microstructure and the mechanical response of the FeCoCrNiAl0.5 HEA have been revealed during the scratching process in the MD simulation. Compared to traditional metals, HEA exhibits stronger resistance to deformation.1–4 Here, in order to further quantitatively reveal the sources of wear resistance of HEA, the mirostracture-based physical model is established to clarify the difference of mechanical properties induced by the intrinsic characteristics between the single crystal FeCoCrNiAl0.5 HEA and pure Ni. The theoretical model is as follows.
The total strain rate comprises two components: the elastic strain rate and the plastic strain rate.
For the elastic part, the Hooke's law is satisfied,
| |
![[small epsi, Greek, dot above]](https://www.rsc.org/images/entities/b_char_e0a1.gif) e = M: e = M:![[small sigma, Greek, dot above]](https://www.rsc.org/images/entities/b_char_e156.gif)
| (4) |
where
M is the elastic compliance tensor,
![[small sigma, Greek, dot above]](https://www.rsc.org/images/entities/b_char_e156.gif)
is the stress rate tensor.
The plastic strain rate is expressed as:
| |
 | (5) |
where the

is the equivalent von Mises plastic strain rate,

represents the equivalent von Mises stress, and
σ′ =
σij −
σkkδij/3 denotes the deviatoric stress tensor. The dynamic relationship between the equivalent plastic strain rate and the equivalent von Mises stress satisfies:
| |
 | (6) |
where
![[small epsi, Greek, dot above]](https://www.rsc.org/images/entities/i_char_e0a1.gif)
is the equivalent strain rate,
m is the rate–sensitivity parameter, and the
σflow is the flow stress closely related to the microstructure. In the present work, the dislocation and lattice distortion are considered as the intrinsic strengthening effects of FeCoCrNiAl0.5 HEA. Thus, the flow stress is written as:
where
σss is the lattice distortion strengthening.
σdis is dislocation strengthening. For HEA, the lattice distortion strengthening is caused by the atom size mismatch and modulus mismatch. According to the Vegard's law,
40| |
 | (8) |
where
ci is the concentration of element
i.
σiss represents the individual contribution of each element in the HEA to lattice distortion strengthening, which is expressed as:
where
A is the constant, approximately taken as 0.04.
41 
denotes the shear modulus of the HEA obtained by the mixing rule, taking into account the influence of the shear modulus
μi of each element.
40 δi represents the mismatch parameter related to the shear modulus mismatch
δμi and the atom size mismatch
δri, which can be expressed as:
| | |
δi = ξ(δμi2 + β2δri2)1/2
| (10) |
where
ξ is material constant determined by the lattice type:
ξ = 1 for FCC metals, and
ξ = 2.5 for BCC metals.
42 β is material parameter associated with the dislocation type: 2 <
β < 4 for the screw dislocation,
β ≥ 16 for the edge dislocation. From the MD simulation result, it can be found that the screw dislocation and edge dislocation are the dominant deformation mechanisms in the FeCoCrNiAl0.5 HEA (
Fig. 7). Meanwhile, the multi-principal component characteristics of HEAs, each element can be regarded as both solutes and solvents for each other. Thus, the HEA with
n elements is composed of
n − 1 principal alloy as a solvent with added solute element
i. The shear modulus mismatch and the atom size mismatch are written as:
| |
 | (11) |
| |
 | (12) |
where
δraveijkl and
δμaveijkl are the average size mismatch and modulus mismatch for
ijkl HEAs, respectively, which can be calculated by:
| |
 | (13) |
| |
 | (14) |
where
δrij = 2(
ri −
rj)/(
ri +
rj), and
δμij = 2(
μi −
μj)/(
μi +
μj) are the size mismatch and modulus mismatch between the element
i and
j, respectively.
ri and
μi are the atomic radius and the shear modulus of the element
i, respectively. The physical parameters of the element of the FeCoCrNiAl0.5 HEA are listed in
Table 2.
Table 2 Physical parameters of the elements46,47
| Element |
Al |
Co |
Cr |
Ni |
Fe |
| Atomic radius r (pm) |
143 |
125 |
128 |
124 |
126 |
| Shear modulus μ (GPa) |
27 |
75 |
115 |
76 |
82 |
The strengthening effect caused by the interaction between the dislocations is described as:
| |
 | (15) |
where
M,
α,
μ,
b,
ρ denote the Taylor factor, Taylor constant, shear modulus, the value of burgers vector, and the dislocation density, respectively. The dynamic evolution of dislocation with strain follows the following pattern:
43–45| |
 | (16) |
In the
eqn (16), the first two terms on the right side of the equation describe dislocation proliferation, while the last two terms represent dislocation annihilation. The
d is the grain size,
ψ is the proportionality factor.
k20, and
n0 are both dynamic recovery constant. The additional dynamic recovery
ke = (
de/
d)
2 (ref.
44) is introduced to describe the dislocation annihilation effect caused by the grain size.
de is the reference grain size. The relevant material parameters are listed in
Table 3.
Table 3 Material parameters of FeCoCrNiAl0.5 HEA and pure Ni47,48
| Parameter |
Symbol |
FeCoCrNiAl0.5 HEA |
Pure Ni |
| Shear modulus (GPa) |
μ |
79.3 |
76 |
| Poisson's ratio |
υ |
0.28 |
0.3 |
| Burgers vector magnitude (nm) |
b |
0.256 |
0.249 |
| Taylor factor |
M |
3.06 |
3.06 |
| Taylor constant |
α |
0.33 |
0.4 |
| Rate sensitivity exponent |
m |
20 |
20 |
| Proportionality factor |
Ψ |
0.025 |
0.04 |
| Dynamic recovery constant |
K20 |
25 |
18 |
| Dynamic recovery constant |
n0 |
21.25 |
21.5 |
| Reference strain rate (s−1) |
![[small epsi, Greek, dot above]](https://www.rsc.org/images/entities/i_char_e0a1.gif) 0 0 |
1 |
1 |
| Reference grain size (nm) |
de |
580 |
800 |
As analyzed above, the calculation results of the strengthening mechanism determined by dislocations and lattice distortion are shown in Fig. 14. For the pure Ni, due to the absence of lattice distortion caused by interatomic size and modulus mismatch, there is only a small lattice friction stress of about 15 MPa.48 The flow stress is mainly contributed by the slip resistance between dislocations, and the calculated strength of the pure Ni single crystal is consistent with the results obtained from previous experiments.48 In addition, the significantly high strength is exhibited in single crystal FeCoCrNiAl0.5 HEA, which is clarified in previous research.49,50 Firstly, this is attributed to the undeniable effect of the lattice distortion in HEAs, which is main reason for the smaller atom displacement and shear strain in HEA than that in pure Ni during the scratching process in Fig. 10 and S6.† The plastic deformation is mainly dominated by the dislocation motion and does not change the original shear modulus mismatch and atom size mismatch of metals. Thus, the lattice distortion strengthening is independent of the strain and only contributes to yield strength. The strain hardening is determined by the dynamic evolution of dislocation. The evolution of the dislocation density has been presented in Fig. 14b, which corresponds to the contribution process of the dislocation strengthening (Fig. 14a). The evolution rule of dislocation is consistent with Fig. 7 and S5,† where the long dislocation and high dislocation density are more likely to occur in pure Ni during the deformation process. In the initial stage, the lattice distortion strengthening is the main strengthening mechanism that hinders deformation. Subsequently, a larger dislocation strengthening effect is gradually added to improve the overall strength of the FeCoCrNiAl0.5 HEA during the deformation process. The slightly delayed evolution of dislocation density proves that HEA have stronger deformation resistance. The above analysis further elucidates that HEAs have higher wear and friction resistance compared to traditional metals due to their high strength.
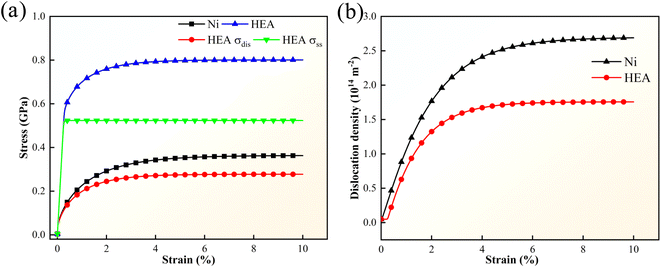 |
| | Fig. 14 (a) The tensile stress–strain curve, and (b) the evolution of dislocation density of the FeCoCrNiAl0.5 HEA and Ni metal. | |
5. Conclusions
In this work, MD simulations of the nano-scratching process of FeCoCrNiAl0.5 HEA are studied with varied scratching parameters. The study systematically analyzes the impact of elastic–plastic deformation of the material on the scratching forces during the scratching process. Furthermore, it provides a comprehensive description of the influence laws of scratching depth on the surface topography of FeCoCrNiAl0.5 HEA. By comparing the surface generation and plastic removal at different scratching depths, the study systematically uncovers the mechanisms by which scratching depth affects the machined surface topography.
Furthermore, the microsturcture-based physical model of single crystal HEA and pure Ni are established to quantitative reveal the origin of wear resistance. It is found that the lattice distortion caused by inherent atomic size mismatch and modulus mismatch in HEA contributes significantly to strength. Combined with the gradually enhanced dislocation strengthening effect during the deformation process, HEA exhibit exceptionally excellent strength, which is different from the single dislocation strengthening effect of pure Ni. Besides, the delay in the evolution of dislocation density in HEA further proves the excellent plastic deformation resistance.
Conflicts of interest
The authors declare that they have no known competing financial interests or personal relationships that could have appeared to influence the work reported in this paper.
Acknowledgements
The authors would like to deeply appreciate the supports from Natural Science Foundation of Shandong Province (ZR2020ME130), National Natural Science Foundation of China (52101392), and National Natural Science Foundation of China (12172123).
References
- Z. Rao, P. Y. Tung, R. Xie, Y. Wei, H. Zhang, A. Ferrari and D. Raabe, Science, 2022, 378, 78 CrossRef CAS PubMed.
- J. Ren, Y. Zhang, D. Zhao, Y. Chen, S. Guan, Y. Liu and W. Chen, Nature, 2022, 608, 62 CrossRef CAS PubMed.
- D. Liu, Q. Yu, S. Kabra, M. Jiang, P. Forna-Kreutzer, R. Zhang and R. O Ritchie, Science, 2022, 378, 978 CrossRef CAS PubMed.
- J. Hao, Z. Zhuang, K. Cao, G. Gao, C. Wang, F. Lai and H. Zhu, Nat. Commun., 2022, 13, 2662 CrossRef CAS PubMed.
- Y. Cui, J. Shen, S. M. Manladan, K. Geng and S. Hu, Appl. Surf. Sci., 2020, 512, 145736 CrossRef CAS.
- M. H. Chuang, M. H. Tsai, W. R. Wang, S. J. Lin and J. W. Yeh, Acta Mater., 2011, 59(16), 6308–6317 CrossRef CAS.
- J. K. Xiao, H. Tan, J. Chen, A. Martini and C. Zhang, J. Alloys Compd., 2020, 847, 156533 CrossRef CAS.
- J. Joseph, N. Haghdadi, M. Annasamy, S. Kada, P. D. Hodgson, M. R. Barnett and D. M. Fabijanic, Scr. Mater., 2020, 186, 230–235 CrossRef CAS.
- V. Bhardwaj, Q. Zhou, F. Zhang, W. Han, Y. Du, K. Hua and H. Wang, Tribol. Int., 2021, 160, 107031 CrossRef CAS.
- J. L. Zhou, J. Y. Yang, X. F. Zhang, F. W. Ma, K. Ma and Y. H. Cheng, J. Mater. Sci., 2023, 58, 4257 CrossRef CAS.
- X. Pei, Y. Du, X. Hao, H. Wang, Q. Zhou, H. Wu and H. Wang, Wear, 2022, 488, 204166 CrossRef.
- H. Lee, A. Sharma and B. Ahn, Wear, 2023, 530, 205011 CrossRef.
- Y. Xiao, X. Chang and X. Peng, J. Mater. Res. Technol., 2022, 21, 4908 CrossRef CAS.
- Y. Wang, H. Zhao and C. Liu, RSC Adv., 2023, 13, 6630 RSC.
- S. Yoon, Y. Kimura, S. Gu, Y. Toku, Y. Ju and Y. Cui, RSC Adv., 2023, 13, 28513 RSC.
- C. M. Yang, X. B. Liu, Z. X. Zhu, A. Zhou, H. B. Zhou and S. H. Zhang, Tribol. Int., 2024, 191, 109106 CrossRef CAS.
- F. Yu, J. Li and X. Luo, RSC Adv., 2023, 13, 16880 RSC.
- T. X. Bui, T. H. Fang and C. I. Lee, J. Alloys Compd., 2022, 924, 166525 CrossRef CAS.
- A. Dollmann, C. Kübel, V. Tavakkoli, S. J. Eder, M. Feuerbacher, T. Liening and C. Greiner, Commun. Mater., 2024, 5, 4 CrossRef.
- J. Kong, Q. Fang and J. Li, Model. Simul. Mater. Sci., 2023, 31, 085019 CrossRef.
- J. Kong, G. Luo, Y. Tian and C. Du, J. Mater. Res. Technol., 2023, 27, 7293 CrossRef CAS.
- L. Wei, C. Zhang, Q. Zheng, Z. Zeng and Y. Li, RSC Adv., 2022, 12, 23176 RSC.
- D. Farkas and A. Caro, J. Mater. Res., 2020, 35, 3031 CrossRef CAS.
- D. Q. Doan, V. H. Nguyen, T. V. Tran and M. T. Hoang, J. Manuf. Process., 2023, 85, 1010 CrossRef.
- Q. Guo, H. Hou, Y. Pan, X. Pei, Z. Song, P. K. Liaw and Y. Zhao, Mater. Des., 2023, 231, 112050 CrossRef CAS.
- J. Kong, Y. Tian, X. Zeng, B. Liu, Q. Fang and J. Li, J. Mater. Res., 2022, 37, 3009 CrossRef CAS.
- Z. Wang, J. Li, Q. Fang, B. Liu and L. Zhang, Appl. Surf. Sci., 2017, 416, 470 CrossRef CAS.
- A. P. Thompson, H. M. Aktulga, R. Berger, D. S. Bolintineanu, W. M. Brown, P. S. Crozier and S. J. Plimpton, Comput. Phys. Commun., 2022, 271, 108171 CrossRef CAS.
- A. Stukowski, Model. Simul. Mater. Sci., 2009, 18, 015012 CrossRef.
- X. Li and C. Jiang, The effect of plastic deformation on the microstructure and mechanical properties of CoCrFeNiAl high-entropy alloys, Mater. Express, 2024, 14, 210–221 CrossRef CAS.
- Y. Ren, Q. Zhou, D. Hua, Z. Huang, Y. Li, Q. Jia, P. Gumbsch, C. Greiner, H. Wang and W. Liu, Sci. Bull., 2023, 69, 227 CrossRef PubMed.
- D. Hua, Q. Zhou, Y. Shi, S. Li, K. Hua, H. Wang, S. Li and W. Liu, Int. J. Plast., 2023, 171, 103832 CrossRef CAS.
- Z. Lou, Y. Yan, C. Li and Y. Geng, J. Alloys Compd., 2023, 946, 169427 CrossRef CAS.
- Y. Zhao, Y. Guan, F. Chen, H. Chu, J. Zhai, J. Lin and L. Chen, J. Mater. Process. Technol., 2023, 322, 118189 CrossRef CAS.
- G. Lei, Y. Zhang, H. Gao, X. Cui and H. Yu, J. Appl. Phys., 2023, 133, 155901 CrossRef CAS.
- Y. Chen, S. W. Reng, J. Peng and X. B. Liu, J. Mater. Res. Technol., 2023, 24, 3588 CrossRef CAS.
- H. Cao, Z. Guo, R. Feng, H. Li, R. Fu, Y. Zhou and J. Liu, J. Manuf. Process., 2023, 102, 169 CrossRef.
- H. Lu, Q. Shen, X. Chen, M. Wen and S. Jayalakshmi, J. Mater. Res. Technol., 2024, 29, 4052 CrossRef CAS.
- X. Duan, S. Wang, H. Yang, G. Wang, W. Liu and Z. Xiao, J. Mater. Res. Technol., 2023, 26, 1677–1696 CrossRef CAS.
- A. R. Denton and N. W. Ashcroft, Phys. Rev. A, 1991, 43, 3161 CrossRef CAS PubMed.
- H. W. Yao, J. W. Qiao, J. A. Hawk, H. F. Zhou, M. W. Chen and M. C. Gao, J. Alloys Compd., 2017, 696, 1139 CrossRef CAS.
- L. Li, Q. Fang, J. Li, B. Liu, Y. Liu and P. K. Liaw, Mater. Sci. Eng. A, 2020, 784, 139323 CrossRef CAS.
- L. Capolungo, M. Cherkaoui and J. Qu, Int. J. Plast., 2007, 23, 561 CrossRef CAS.
- J. Li, W. Lu, S. Chen and C. Liu, Int. J. Plast., 2020, 126, 102626 CrossRef CAS.
- J. Li, S. Ren, B. Liu, P. K. Liaw and Q. Fang, Acta Mech. Sin., 2024, 40, 423122 CrossRef CAS.
- R. S. Ganji, P. S. Karthik, K. B. S. Rao and K. V. Rajulapati, Acta Mater., 2017, 125, 58 CrossRef CAS.
- G. Luo, L. Li, Q. Fang, J. Li, Y. Tian, Y. Liu and P. K. Liaw, Appl. Math. Mech., 2021, 42, 1109 CrossRef.
- D. M. Dimiduk, M. D. Uchic and T. A. Parthasarathy, Acta Mater., 2005, 53, 4065 CrossRef CAS.
- D. Lee, M. P. Agustianingrum, N. Park and N. Tsuji, J. Alloys Compd., 2019, 800, 372 CrossRef CAS.
- I. V. Kireeva, Y. I. Chumlyakov, Z. V. Pobedennaya, A. V. Vyrodova and A. A. Saraeva, Metals, 2020, 10, 1149 CrossRef CAS.
|
| This journal is © The Royal Society of Chemistry 2024 |
Click here to see how this site uses Cookies. View our privacy policy here.  Open Access Article
 c
c
![[thin space (1/6-em)]](https://www.rsc.org/images/entities/char_2009.gif) :
:![[thin space (1/6-em)]](https://www.rsc.org/images/entities/char_2009.gif) 1 (Co)
1 (Co)![[thin space (1/6-em)]](https://www.rsc.org/images/entities/char_2009.gif) :
:![[thin space (1/6-em)]](https://www.rsc.org/images/entities/char_2009.gif) 1 (Cr)
1 (Cr)![[thin space (1/6-em)]](https://www.rsc.org/images/entities/char_2009.gif) :
:![[thin space (1/6-em)]](https://www.rsc.org/images/entities/char_2009.gif) 1 (Ni)
1 (Ni)![[thin space (1/6-em)]](https://www.rsc.org/images/entities/char_2009.gif) :
:![[thin space (1/6-em)]](https://www.rsc.org/images/entities/char_2009.gif) 0.5 (Al). In addition, considering the type of crystal structure and the mechanical properties of the material, the pure Ni substrate is selected for comparison, to reveal the differences in scratching properties of FeCoCrNiAl0.5 HEA. This system contains the FeCoCrNiAl0.5 HEA substrate and the diamond tool. The FCC FeCoCrNiAl0.5 HEA substrate has the size of 685 Å × 180 Å × 36 Å, and it contains a total of 229
0.5 (Al). In addition, considering the type of crystal structure and the mechanical properties of the material, the pure Ni substrate is selected for comparison, to reveal the differences in scratching properties of FeCoCrNiAl0.5 HEA. This system contains the FeCoCrNiAl0.5 HEA substrate and the diamond tool. The FCC FeCoCrNiAl0.5 HEA substrate has the size of 685 Å × 180 Å × 36 Å, and it contains a total of 229![[thin space (1/6-em)]](https://www.rsc.org/images/entities/char_2009.gif) 986 atoms. A spherical diamond tool with 47
986 atoms. A spherical diamond tool with 47![[thin space (1/6-em)]](https://www.rsc.org/images/entities/char_2009.gif) 262 atoms has a radius of 50 Å. The crystal orientations of the substrate are [1 0 0] along the X axis, [0 1 0] along the Y axis, and [0 0 1] along the Z axis. The nanoscratching parameters of FeCoCrNiAl0.5 HEA are listed in Table 1. The HEA substrate is divided into three regions, namely, boundary region, thermostat region, and Newtonian region.20–22 The thicknesses of boundary and thermostat regions are 5 nm. The free boundary conditions are used to the x axis and z axis, and the periodic boundary condition is applied to the y axis. Before the scratching, the conjugate gradient algorithm is applied for minimizing the system energy. During the scratching process, a scratching tool has a constant speed along the x axis (Fig. 1a).
262 atoms has a radius of 50 Å. The crystal orientations of the substrate are [1 0 0] along the X axis, [0 1 0] along the Y axis, and [0 0 1] along the Z axis. The nanoscratching parameters of FeCoCrNiAl0.5 HEA are listed in Table 1. The HEA substrate is divided into three regions, namely, boundary region, thermostat region, and Newtonian region.20–22 The thicknesses of boundary and thermostat regions are 5 nm. The free boundary conditions are used to the x axis and z axis, and the periodic boundary condition is applied to the y axis. Before the scratching, the conjugate gradient algorithm is applied for minimizing the system energy. During the scratching process, a scratching tool has a constant speed along the x axis (Fig. 1a).
![[thin space (1/6-em)]](https://www.rsc.org/images/entities/char_2009.gif) 241
241![[thin space (1/6-em)]](https://www.rsc.org/images/entities/char_2009.gif) 730
730![[thin space (1/6-em)]](https://www.rsc.org/images/entities/char_2009.gif) 297
297


 FCC structure, and
  BCC structure.


![[small epsi, Greek, dot above]](https://www.rsc.org/images/entities/b_char_e0a1.gif) =
= ![[small epsi, Greek, dot above]](https://www.rsc.org/images/entities/b_char_e0a1.gif) e +
e + ![[small epsi, Greek, dot above]](https://www.rsc.org/images/entities/b_char_e0a1.gif) p
p
![[small epsi, Greek, dot above]](https://www.rsc.org/images/entities/b_char_e0a1.gif) e = M:
e = M:![[small sigma, Greek, dot above]](https://www.rsc.org/images/entities/b_char_e156.gif)
![[small sigma, Greek, dot above]](https://www.rsc.org/images/entities/b_char_e156.gif) is the stress rate tensor.
is the stress rate tensor.

 is the equivalent von Mises plastic strain rate,
  represents the equivalent von Mises stress, and σ′ = σij − σkkδij/3 denotes the deviatoric stress tensor. The dynamic relationship between the equivalent plastic strain rate and the equivalent von Mises stress satisfies:
![[small epsi, Greek, dot above]](https://www.rsc.org/images/entities/i_char_e0a1.gif) is the equivalent strain rate, m is the rate–sensitivity parameter, and the σflow is the flow stress closely related to the microstructure. In the present work, the dislocation and lattice distortion are considered as the intrinsic strengthening effects of FeCoCrNiAl0.5 HEA. Thus, the flow stress is written as:
is the equivalent strain rate, m is the rate–sensitivity parameter, and the σflow is the flow stress closely related to the microstructure. In the present work, the dislocation and lattice distortion are considered as the intrinsic strengthening effects of FeCoCrNiAl0.5 HEA. Thus, the flow stress is written as:
 denotes the shear modulus of the HEA obtained by the mixing rule, taking into account the influence of the shear modulus μi of each element.40 δi represents the mismatch parameter related to the shear modulus mismatch δμi and the atom size mismatch δri, which can be expressed as:


![[small epsi, Greek, dot above]](https://www.rsc.org/images/entities/i_char_e0a1.gif) 0
0


