
 Open Access Article
 This Open Access Article is licensed under a Creative Commons Attribution-Non Commercial 3.0 Unported Licence
Cu/CeO2 catalysts for reverse water gas shift reactions: the effect of the preparation method†
Jieru Wangabcd,
Chaoxian Wangabcd,
Yongqiang Fengabcd,
Fang Liabcd,
Wanting Suabcd,
Yuanyuan Fangabcd and
Binran Zhao *abcd
*abcd
aSchool of Chemical Engineering, Northwest University, Xi'an 710069, China. E-mail: zhaobr3636@126.com
bInternational Scientific and Technological Cooperation Base of the Ministry of Science and Technology (MOST) for Clean Utilization of Hydrocarbon Resources, Xi'an 710069, China
cChemical Engineering Research Center of the Ministry of Education (MOE) for Advanced Use Technology of Shanbei Energy, Xi'an 710069, China
dShaanxi Research Center of Engineering Technology for Clean Coal Conversion, Xi'an 710069, China
First published on 23rd May 2024
Abstract
The reverse water gas shift reaction is one of the most prospective CO2 utilization approaches. Cu has excellent selectivity for CO and CeO2 is rich in surface oxygen vacancies for CO2 activation. These unique properties are often used to develop efficient Cu/CeO2 catalysts in RWGS. In this paper, Cu/CeO2 is prepared by plasma-induced micro-combustion. The effect of the subsequent calcination after micro-combustion on the structure and catalytic property is systemically studied. Because of the mild temperature of micro-combustion, highly dispersed Cu species load on the surface of CeO2 for the catalyst without calcination (Cu/CeO2-mc). During calcination, the highly dispersed Cu species form two kinds of species, Cu–Ce solid solution structure and small CuO clusters (Cu/CeO2-mcc). The Cu–Ce solid solution effectively enhances the generation of oxygen vacancies, which improves the adsorption and activation of CO2. The catalytic performance of Cu/CeO2-mcc thereby is superior to Cu/CeO2-mc in RWGS. In situ diffuse reflectance infrared fourier transform spectroscopy analysis demonstrates that the formate pathway is the main mechanism of RWGS. CO2 adsorbed on the surface of Cu/CeO2-mcc mainly forms bidentate  species. While monodentate
  generates on the surface of Cu/CeO2-mc. And
  decomposes to CO easier than
  , thus Cu/CeO2-mcc exhibits excellent catalytic properties. This work provides a new approach for structural modulation of catalysts with excellent catalytic performance in RWGS.
1 Introduction
The reverse water gas shift (RWGS) reaction is one of the potential CO2 utilization methods whose product can be directly used as a feedstock for Fischer–Tropsch synthesis,1 methanol synthesis2 and other chemicals production3 by regulating the H/C ratio. Meanwhile, the subsequent synthesis technologies such as obtaining methanol from syngas are more mature than that from CO2 direct conversion. In addition, coke oven gas contains a considerable amount of H2, syngas can be produced from RWGS by adding CO2, which not only reduces the coke oven gas consumption by 20–30% for methanol production4 but also utilizes CO2.Both thermodynamics and kinetics are favorable at high temperatures for RWGS. Therefore, it is crucial to select a stable catalyst for the improvement of CO2 conversion and CO selectivity. Pd-,5 Pt-,6,7 and Au-8 based catalysts are widely investigated for the RWGS reaction. However, their industrial application is limited by their high cost and low reserves. Non-precious metal Ni-, Fe-, and Co-based catalysts have excellent activity, while they show high CO selectivity only at high temperatures (T > 700 °C) owing to the occurrence of CO2 methanation at low temperatures. In contrast, Cu-based catalysts have excellent CO selectivity, however, Cu-based catalysts have the downsides of insufficient CO2 activation and poor stability.
Considerable research has been devoted to improving the catalytic activity and stability of Cu-based catalysts. CeO2 has an excellent valence transition (Ce4+/Ce3+) and abundant surface oxygen vacancies. These unique properties are often used to develop highly efficient Cu/CeO2 catalysts. Hsueh et al.9 designed Cu-MOF@CeO2 catalysts by aerosol-based evaporation-induced self-assembly, the formation of more Cu–Ce interfaces on the nanoscale improves the redox capacity of catalysts and the catalysts show excellent low-temperature catalytic performance (400 °C, TOF-CO2 = 0.1635 s−1). Zhang et al.11 successfully synthesized CeO2-loaded Cu catalysts (Cu/CeO2-hs) with a three-dimensional nano-hollow sphere structure using a hydrothermal method, the special CeO2 morphology provides more surface oxygen vacancies and achieves 48% CO2 conversion at 600 °C. The above studies illustrate that the surface structure of Cu/CeO2 effectively affect the catalytic properties in RWGS, which can be altered by the preparation methods.
The combustion method has been used to prepare Cu/CeO2 catalysts in recent years, and the process involves the decomposition of metal salts into metal oxides to form highly active catalysts during the combustion of fuel. Ebrahimi et al.10 successfully prepared Cu/CeO2 catalysts with solid solution structure using the solution combustion method (SCS). The key factor for the high activity of catalysts is revealed to be the synergy between active Cu0 and oxygen vacancies of CeO2. However, combustion processes experience high temperatures (rapid heating up to 1000 °C), resulting in particle sintering.12 Based on the characteristics of low bulk phase temperature and high electron temperature, the plasma induced micro-combustion is developed to prepare catalysts, in which the combustion process is mild and discontinuous and thereby inhibits the particle sintering. For example, Yao et al.13 prepared Ni-loaded SiO2 catalysts via micro-combustion method, moderate combustion can effectively restrain the aggregation of NiO particles and form highly dispersed NiO. Zhao et al.14 used micro-combustion method to enhance the interaction between Ni and dopant elements (La, Ce, Zr), which further improves the catalytic performance. Therefore, micro-combustion method is utilized to prepare Cu/CeO2 catalysts in this paper.
In the previous micro-combustion preparation process, calcination is added after plasma-induced micro-combustion. To ensure the effect of the calcination process on the structure and property of catalysts, this paper focuses on the comparison of two catalysts with and without calcination after micro-combustion. The microstructure of the two Cu-based catalysts was determined with X-ray diffraction (XRD), Transmission electron microscopy (TEM), and X-ray photoelectron spectroscopy (XPS) characterization. CO2-Temperature Programmed Desorption (CO2-TPD) and in situ Diffuse Reflectance Infrared Fourier Transform Spectroscopy (in situ DRIFTS) were used to analyze the potential mechanisms of the catalysts.
2 Experimental
2.1 Materials
Cu(NO3)2·3H2O was supplied by Tianjin Komeo Chemical Reagent Co., Ltd. Ce(NO3)3·6H2O, NaOH and glycine were purchased from Tianjin Damao Chemical Reagent Factory, anhydrous ethanol was obtained from Tianjin Fuyu Fine Chemical Co.2.2 Preparation of cubic CeO2
Cubic CeO2 was used as support because of its excellent redox capacity. The support cubic CeO2 was prepared using hydrothermal synthesis. 0.40 mol L−1 Ce(NO3)3 aqueous solution was mixed with 6.86 mol L−1 NaOH solution. After being stirred for 30 min at room temperature, the above solution was transferred to the hydrothermal kettle and treated at 180 °C for 24 h. After natural cooling to room temperature the mixture was centrifuged and the solid was washed with deionized water and anhydrous ethanol until the pH was 7, the resultant solid sample was dried at 80 °C for 8 h. Finally, cubic CeO2 sample was obtained after calcination at 400 °C for 4 h.2.3 Preparation of Cu/CeO2 catalysts
The catalysts were prepared using the plasma-induced micro-combustion method, The weight loading of Cu was 10%. 0.71 g of Cu(NO3)2·3H2O and 0.31 g of glycine were dissolved in deionized water, and 3 g of cubic CeO2 supports were added into the solution and the sample was fully stirred for 1 h and then left to set at room temperature overnight, subsequently dried at 110 °C for 12 h. The dried samples were fully ground and treated by micro-combustion induced by dielectric barrier discharge (DBD) plasma. 1.5 g samples were put into the groove of the quartz reactor and then the reactor was fixed between the two electrodes of DBD. The voltage was adjusted to 100 V, the operating current was 2 A, the treatment time was 2 min per time, and the samples were treated 20 times. Two catalysts were prepared in this work: the sample after micro-combustion treatment was titled as Cu/CeO2-mc, and the sample after micro-combustion was calcined at 500 °C for 4 h and was recorded as Cu/CeO2-mcc. The Cu/CeO2-c sample was obtained by direct calcination (500 °C, 4 h) after drying.2.4 Characterizations
XRD was performed to obtain the crystalline phase structure of the catalysts on a Rigaku D/Max-2500 diffractometer with Cu-targeted Kα-type radiation source (λ = 1.54056 Å) at a speed of 5° per min with 2θ angle range of 10–80°.The micro-morphological structure of the catalysts and elemental distribution was observed by Transmission electron microscopy (TEM) on a transmission electron microscope of FEI Talos F200X G2. The catalyst was fully ground and sonicated in anhydrous ethanol for 20 min until it was completely dispersed, then the solution was dropped onto a copper mesh.
The elemental content and chemical state on the catalyst surface were analyzed by XPS on a Thermo Scientific K-Alpha X-ray photoelectron spectrometer with an excitation energy of 1486.6 eV (Al Kα). C1s peak at 284.8 eV was employed for charge calibration.
The reducibility and metal-support interaction of the catalysts was probed by H2-TPR on BELCAT II. Firstly, 20 mg of catalyst was heated to 300 °C under He atmosphere and maintained for 30 min. Afterward, this sample was cooled down to 50 °C. H2-TPR was conducted by raising the temperature to 900 °C at a rate of 10 °C min−1 under an atmosphere of 10% H2/N2, and the consumption of H2 was detected with a thermal conductivity detector (TCD).
CO2-TPD was also performed on a BELCAT II to evaluate the CO2 adsorption on the catalyst. Before the test, 20 mg of catalyst was heated up to 300 °C at 10 °C min−1 in He atmosphere. After pretreatment for 30 min, the temperature was dropped to 50 °C, and 10% CO2/N2 was passed into the catalyst to be adsorbed for 60 min. Then He was used to purge the physically adsorbed CO2 from the surface of the catalyst. Finally, the catalyst was heated up to 900 °C at a rate of 10 °C min−1 for CO2 desorption, while the CO2 desorption curve was recorded by a TCD.
In situ DRIFTS were performed on a Bruker VERTEX 80v FTIR spectrometer to analyze the intermediates during the RWGS reaction. A fully ground sample was added into the reaction cell and was purged under Ar atmosphere at 300 °C for 30 min, subsequently cooled to 50 °C. Then the mixture of CO2/H2/Ar with the ratio of 1/4/5 was switched to react on the surface of the catalyst. The spectrum was recorded at 100, 200, 300, 340, 360, 380 and 400 °C, respectively. And the spectral recording band range was 4000–1000 cm−1 for each temperature.
2.5 Catalytic evaluation
RWGS reaction was carried out on a fixed bed. Catalyst (50 mg) and quartz sand (500 mg) of the same particle size were mixed homogeneously. The diluted catalyst was fixed in a 6 mm quartz tube with quartz wool. Firstly, under the Ar atmosphere, the temperature was increased to the desired temperature at a rate of 10 °C min−1, and then a mixture of CO2/H2/Ar with a mole ratio of 1/4/5 was switched to the reaction bed at a flow rate of 50 mL min−1 and the weight hourly space velocity (WHSV) of 60![[thin space (1/6-em)]](https://www.rsc.org/images/entities/char_2009.gif) 000 mL gcat−1 h−1. The exit gas was passed through a cold trap to remove water vapor and then entered an SP-3420A gas chromatograph to analyze the composition of exit gas. The gas chromatograph was equipped with a TCD and a TDX-01 column (3 m). Activity test was carried out in the temperature range of 300–700 °C and the stability evaluation was conducted at 500 °C.
000 mL gcat−1 h−1. The exit gas was passed through a cold trap to remove water vapor and then entered an SP-3420A gas chromatograph to analyze the composition of exit gas. The gas chromatograph was equipped with a TCD and a TDX-01 column (3 m). Activity test was carried out in the temperature range of 300–700 °C and the stability evaluation was conducted at 500 °C.
CO2 conversion and CO selectivity were calculated as follows:
 | (1) |
 | (2) |
3 Results and discussion
3.1 Catalyst characterizations
The crystalline phase and structure of the catalysts were characterized using XRD technology. As shown in Fig. 1, the diffraction peaks at 2θ of 28.55, 33.08, 47.48, 56.33, 59.08, 69.40, 76.70, and 79.41° correspond to the (111), (200), (220), (311), (222), (400), (331), and (420) crystal planes of CeO2 (PDF No. 34-0394), respectively.15 The intensity of the diffraction peaks of CeO2 of Cu/CeO2-mcc is more acute compared with Cu/CeO2-mc, indicating the better crystallinity of CeO2 support due to the subsequent calcination. It should be noticed that the CeO2 diffraction peak of Cu/CeO2-mcc shifts to a higher angle compared with that of Cu/CeO2-mc (Fig. 1b). This may be because Cu species enter the crystalline structure of CeO2 after calcination.16 The radius of Cu (0.073 nm) is smaller than Ce (0.097 nm), Cu ions replace Ce ions to form the Cu–Ce solid solution which leads to the decrease of the crystal spacing and the contraction of the cell parameter, thereby the diffraction peak shifts to higher angle.17 In repeated XRD tests (Fig. S1†), the CeO2 diffraction peaks of Cu/CeO2-mcc are shifted to higher angles, which excludes experimental errors. It can be concluded that Cu–Ce solid solution forms due to the further calcination after micro-combustion for Cu/CeO2-mcc. This conclusion is confirmed by subsequent XPS and UV-Raman. In addition, weak CuO (PDF No. 45-0937) diffraction peaks are detected at 2θ of 35.49 as well as 38.73° for Cu/CeO2-mcc catalysts (Fig. 1c), indicating that small CuO clusters form during calcination. While for Cu/CeO2-mc, CeO2 diffraction peaks are located at almost the same 2θ position as CeO2. And it is hard to observe the diffraction peaks belonging to CuO in Cu/CeO2-mc. This implies that the Cu species are highly dispersed. Therefore, for the Cu/CeO2-mc catalysts, the Cu is highly dispersed on the surface of CeO2, whereas Cu species coexist as Cu–Ce solid solutions and small CuO clusters for Cu/CeO2-mcc catalysts.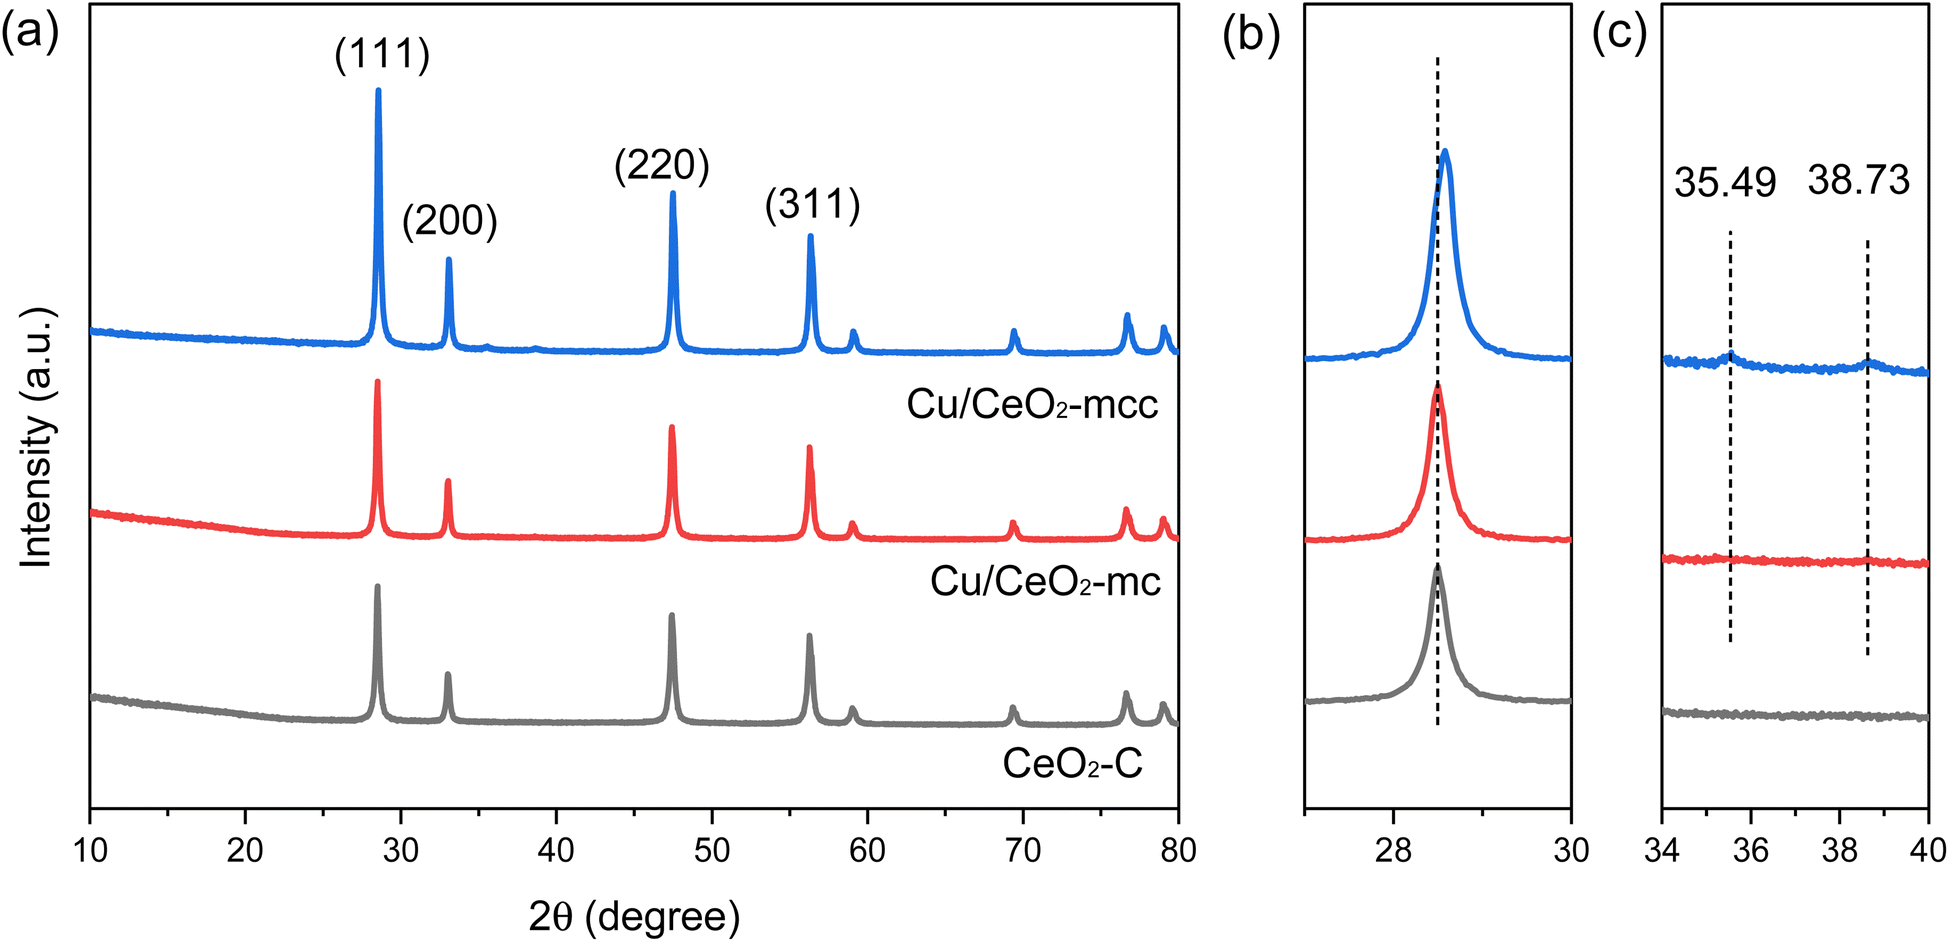 | ||
| Fig. 1 (a) XRD patterns of Cu/CeO2-mc, Cu/CeO2-mcc and CeO2–C support at 10–80°; (b) 27–30°; (c) 34–40°. | ||
The Cu/CeO2 catalysts with different structures were characterized by H2-TPR to study the metal-support interaction. Fig. 2 presents the H2-TPR spectra of the catalysts with reduction peaks at 100–500 °C. The reduction peaks of pure CuO are in the range of 260–380 °C, whilst the Cu/CeO2 reduction peaks are significantly shift to lower temperatures compared to pure CuO, that is because CeO2 can facilitate the reduction of CuO caused by the interaction of Cu–Ce.18 It is obvious that the Cu/CeO2-mcc reduction peak shifts to lower temperature (207.8 °C) compared with Cu/CeO2-mc, which indicates the strong Cu–Ce interaction.22 Based on XRD, CuO of Cu/CeO2-mc catalyst is highly dispersed on the surface of support, whereas Cu–Ce solid-solution structure forms for Cu/CeO2-mcc. Thereby it can be concluded that the Cu–Ce interaction is enhanced by the formation of solid solution structure of Cu–Ce during further calcination after micro-combustion.
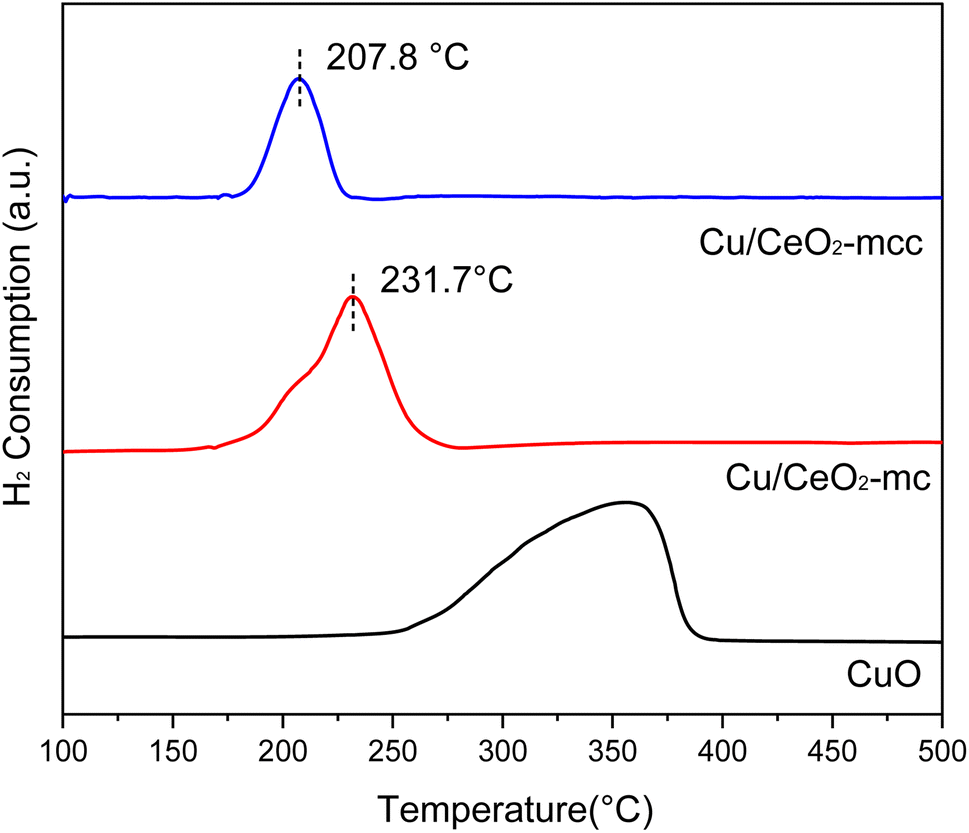 | ||
| Fig. 2 H2-TPR spectra of Cu/CeO2 catalysts and CuO. | ||
The morphology of the catalysts was analyzed by TEM. Fig. 3a, b, c, g, h and i present the TEM images for Cu/CeO2-mc and Cu/CeO2-mcc catalysts, respectively. Both catalysts have typical cubic CeO2 structures, while expose different crystal planes of CeO2. The CeO2 (111) and (100) crystal planes with lattice spacings of 0.31 and 0.27 are mainly recognized on Cu/CeO2-mc. Whereas, the CeO2 (110) and (100) crystal planes with lattice spacings of 0.19 and 0.27 nm are detected on Cu/CeO2-mcc.
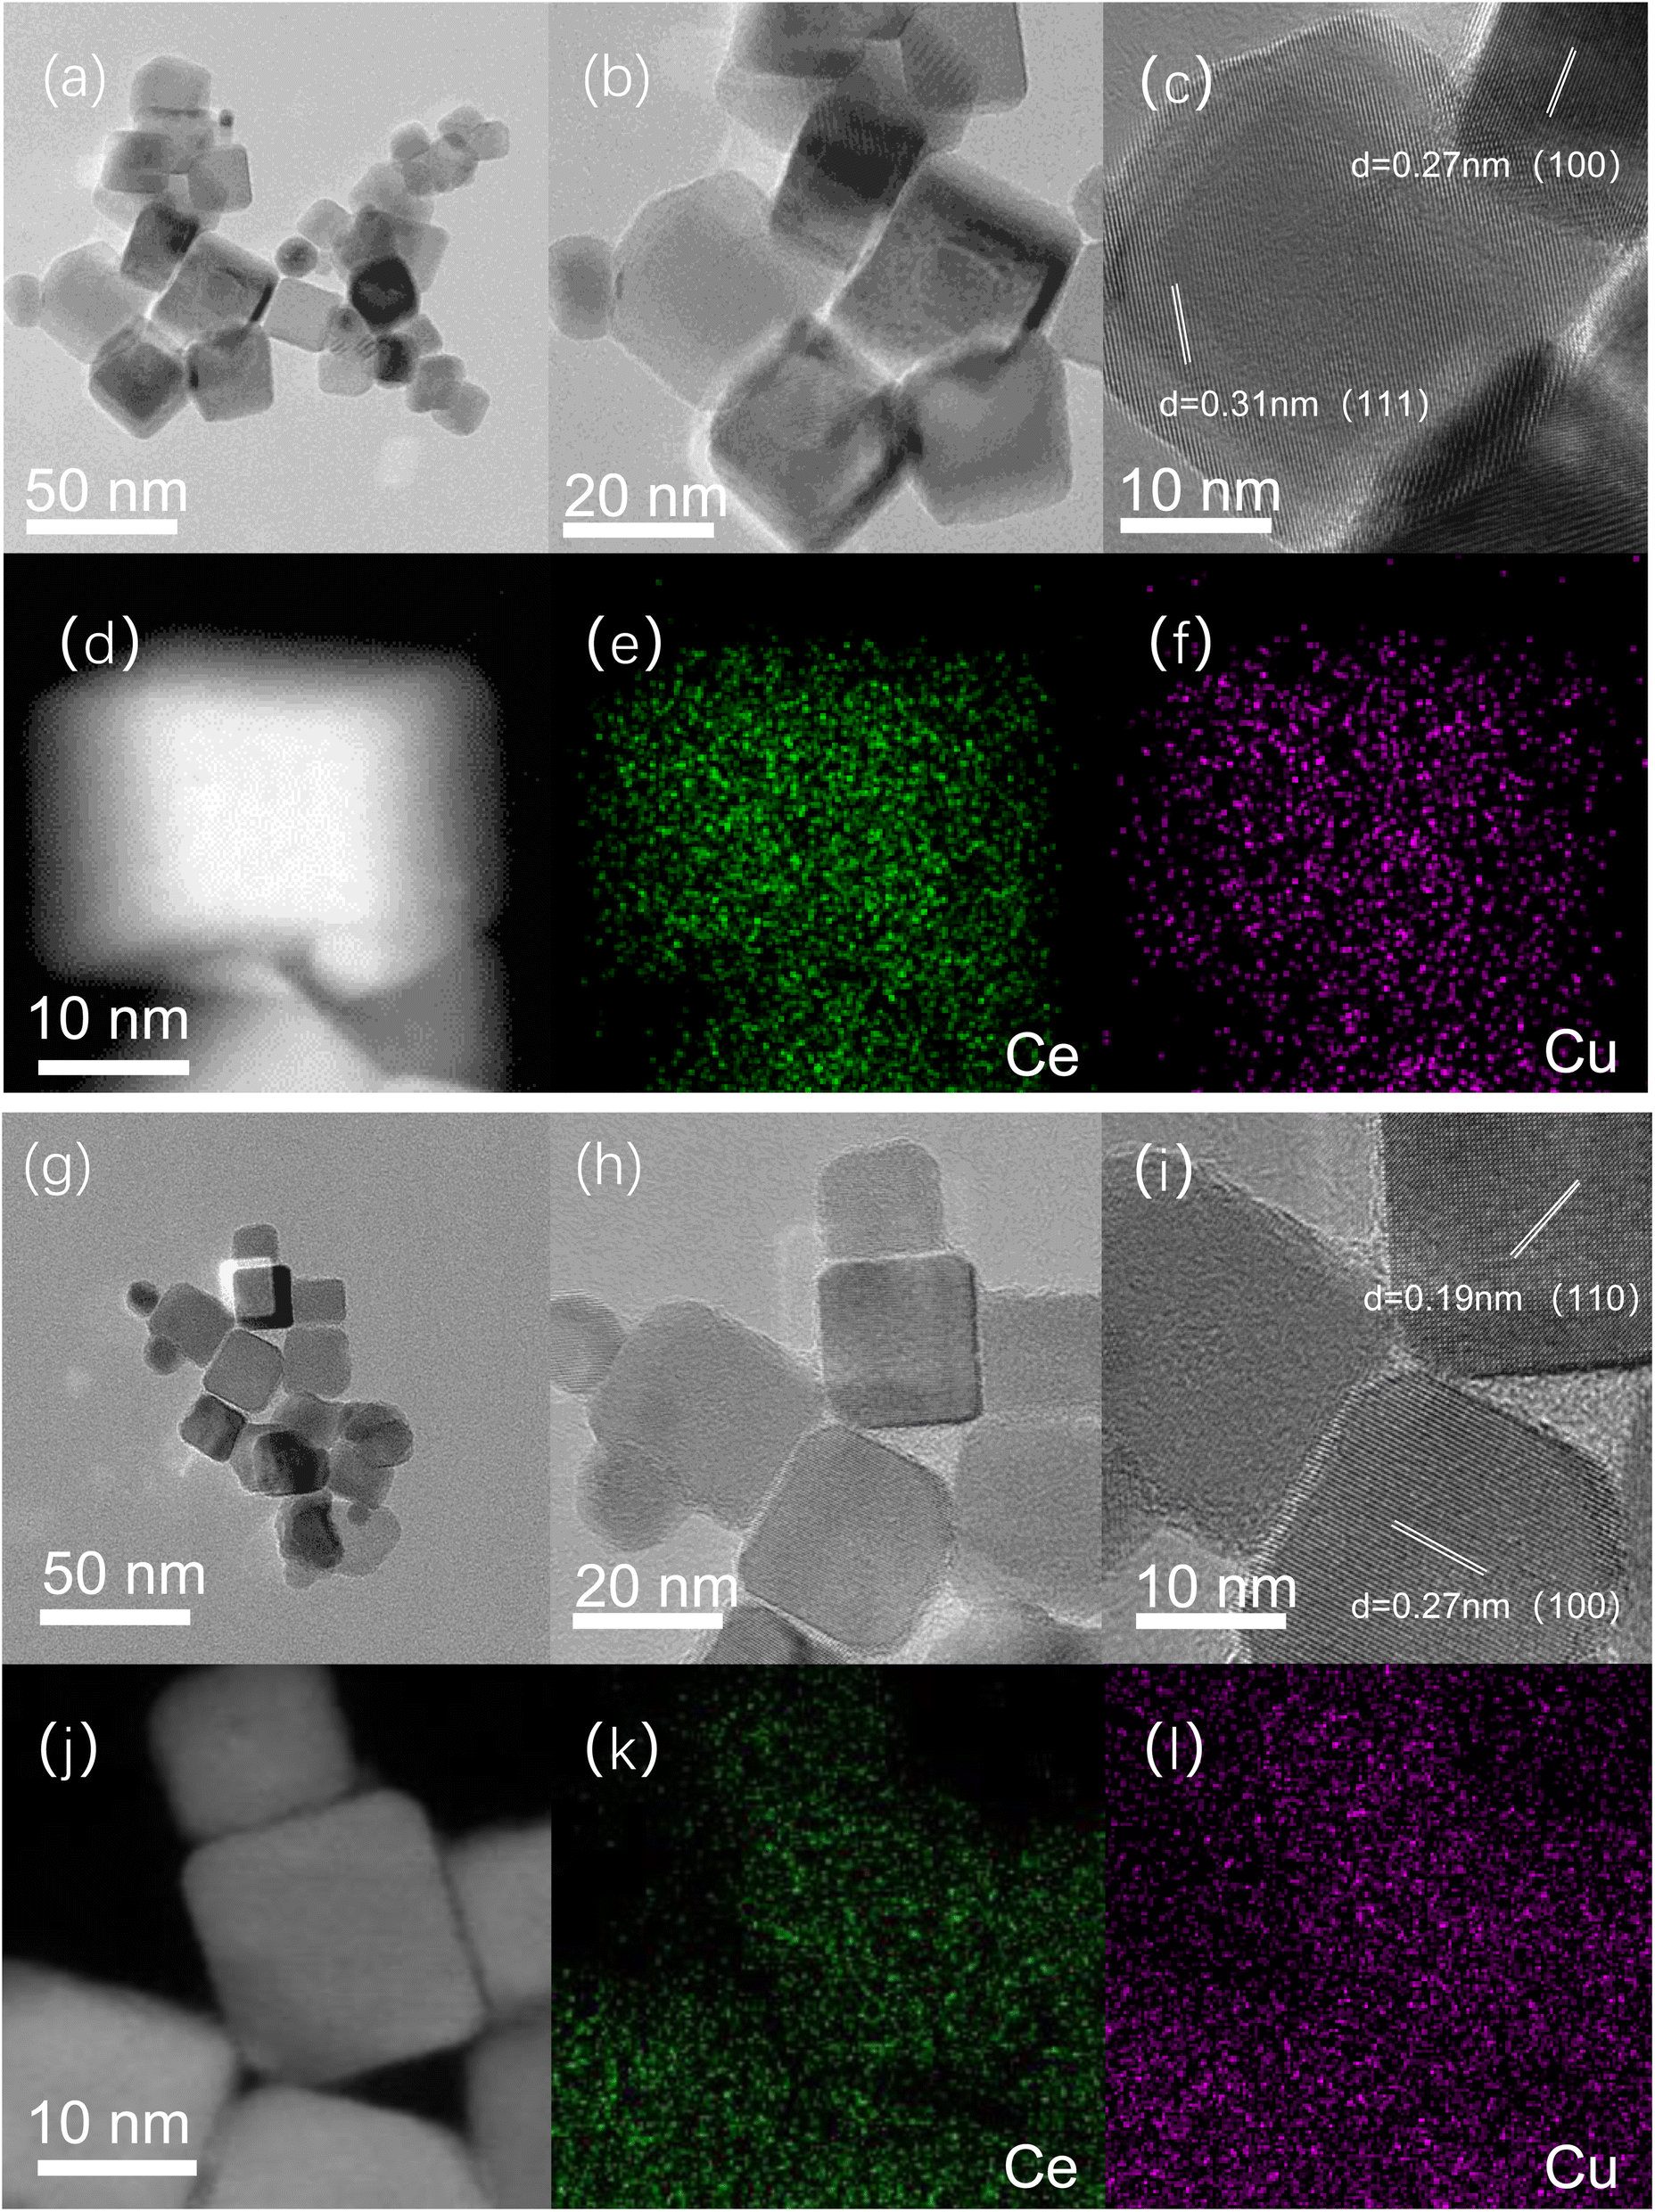 | ||
| Fig. 3 TEM (a–c) and STEM/EDS mapping images of Cu/CeO2-mc (d–f); TEM (g–i) and STEM/EDS mapping images of Cu/CeO2-mcc (j–l). | ||
According to the XRD spectra, Cu/CeO2-mcc has lower intensity ratios of (111) to (100) of CeO2 (Table S1†), which may cause the fewer (111) crystal planes exposing on the surface.21 This may be related to the solid solution structure of the Cu/CeO2-mcc. It is well recognized that CeO2 (111) is the densest crystal plane,19 while CeO2 (110) and CeO2 (100) have the lower vacancy formation energy.20 The formation of oxygen vacancies is easier on the CeO2 (110) and (100) than CeO2 (111). More oxygen vacancies can enhance the CO2 adsorption and activation during reaction.
The elemental distribution of the catalysts was further illustrated by the mapping of STEM/EDS, Fig. 3d and j present the dark-field images of Cu/CeO2-mc and Cu/CeO2-mcc, respectively. Fig. 3e, f, k and l are the elemental distributions of Ce (green) and Cu (purple) for the two catalysts, separately. For both catalysts, Cu elements are highly dispersed on CeO2 supports, which is in line with the XRD results. Line scans of Cu/CeO2 catalysts are presented in Fig. S1.† The relatively uniform distribution of Ce and Cu elements on Cu/CeO2-mcc substantiates the formation of a homogeneous Cu–Ce solid solution structure. While for Cu/CeO2-mc, it can be observed a decline for Ce element between the two particles, while a slight increase is observed for Cu element, this confirms that the high dispersion of Cu species on the surface of CeO2 for Cu/CeO2-mc.
The chemical states of Cu, Ce, and O species on the catalyst surface were analyzed using XPS technology. Fig. 4a presents the spectra of Cu 2p after peak fitted, where the peaks at around 933 and 952 eV belong to the characteristic peaks of Cu0/Cu+ 2p3/2 and 2p1/2. The characteristic peaks of Cu2+ 2p3/2 and 2p1/2 are around 934 eV and 954 eV,22 respectively. In addition, peaks at 941–944 eV are attributed to the oscillating satellite peaks of Cu2+ 2p3/2.23,24 For Ce 3d (Fig. 4b), two types of spin orbitals, including Ce 3d3/2 (labeled u–u′′′) and Ce 3d5/2 (labeled v–v′′′), can be mainly subdivided into eight separate peaks. Among them, u′ (902.59 eV) and v′ (883.76 eV) are attributed to Ce3+ species, whereas u (900.60 eV), u′′ (907.76 eV), u′′′ (916.58 eV), v (882.38 eV), v′′ (888.96 eV) and v′′′ (898.12 eV) are classified as Ce4+ species.25 Three main chemical states of oxygen are detected in the O 1s of Fig. 4c. The first peak at around 529 eV belongs to the lattice oxygen Oα,26 while the second peak around 531 eV is assigned to surface adsorbed oxygen Oβ, and the peak at 532.7 eV is weakly bound oxygen Oγ.27
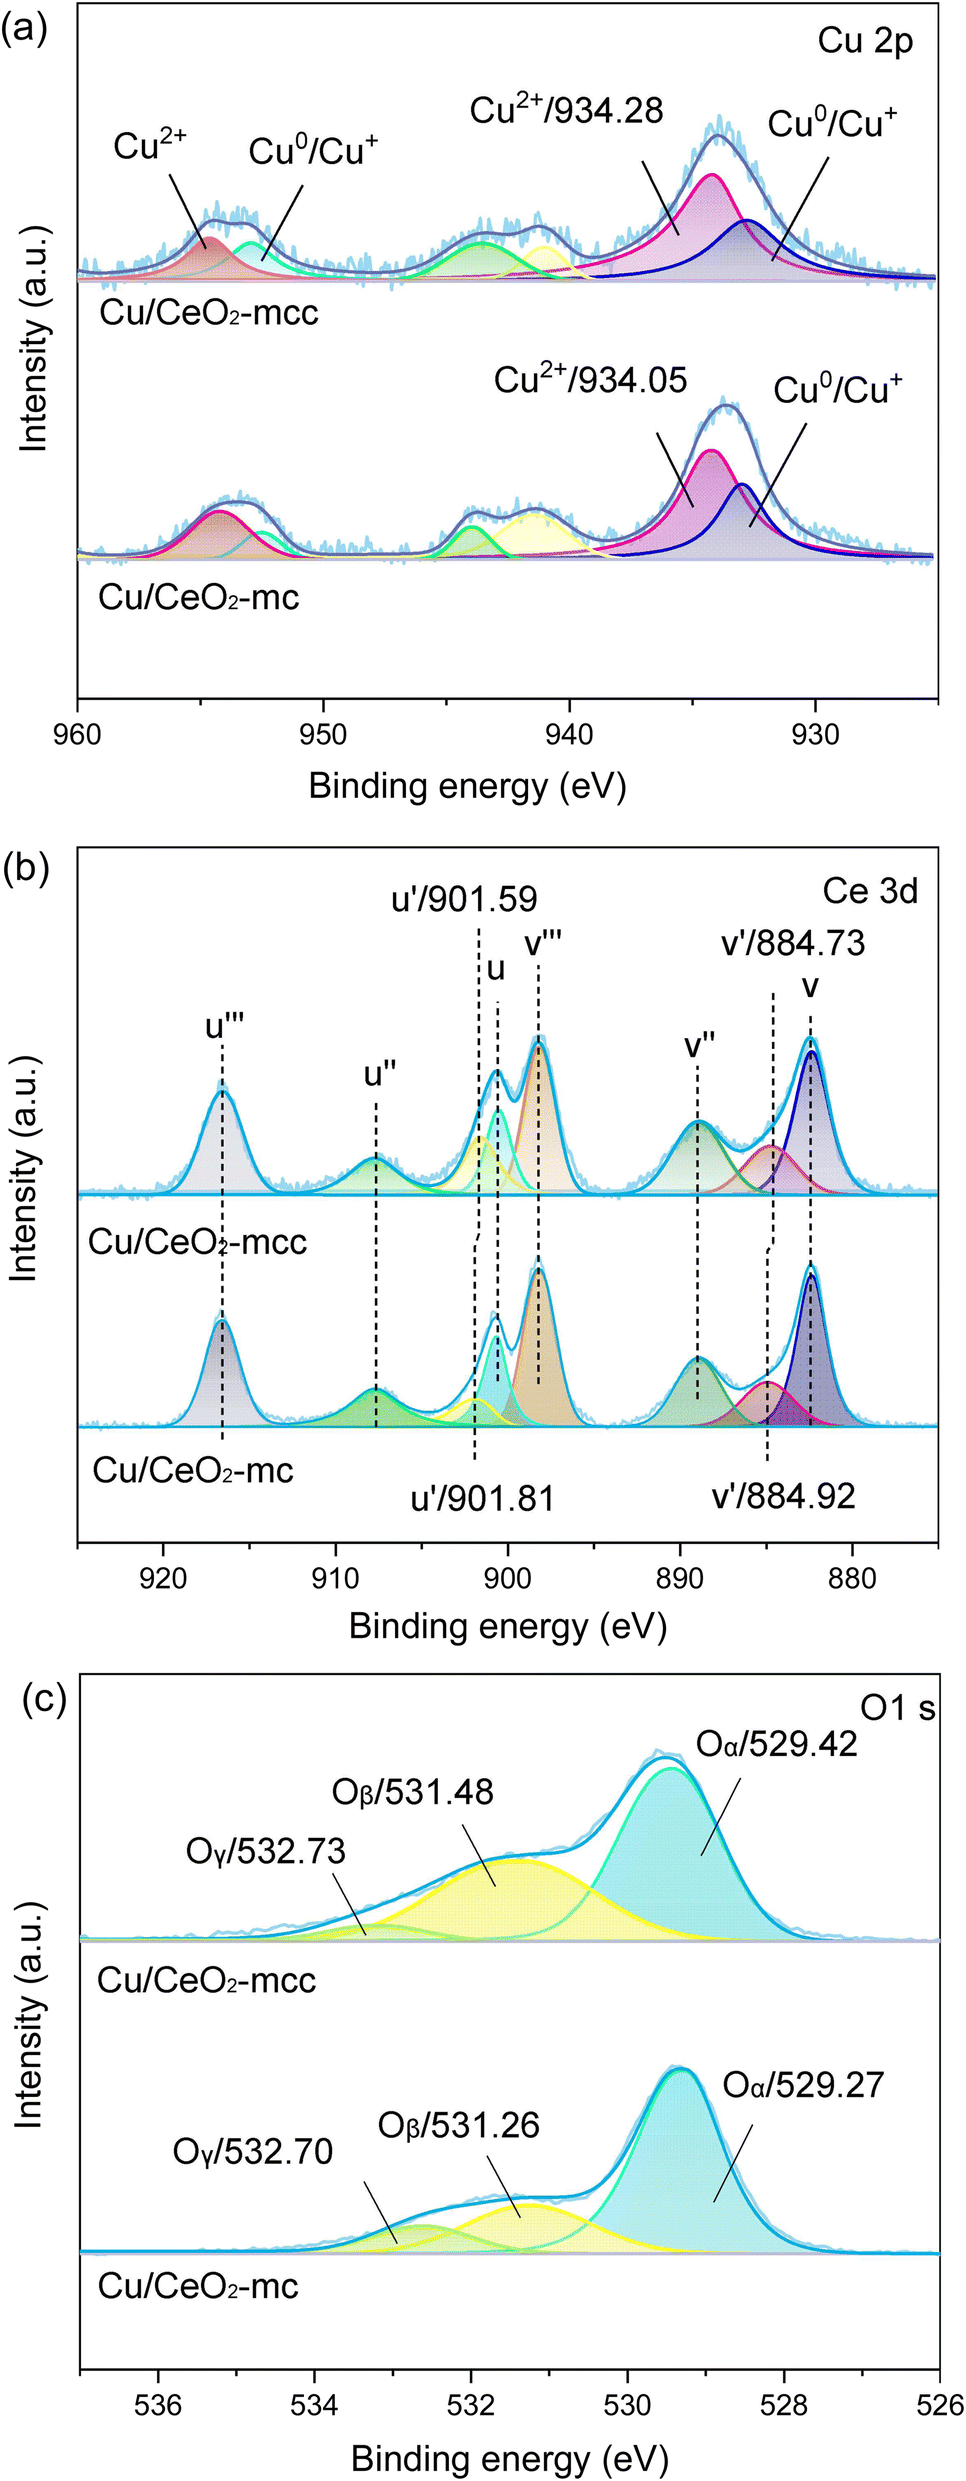 | ||
| Fig. 4 XPS spectra of (a) Cu 2p; (b) Ce 3d and (c) O 1s of Cu/CeO2-mc and Cu/CeO2-mcc. | ||
The intensity ratio of Cu2+ 2p3/2 satellite peaks to main peak (Isat/Ipp) is used to indicate the degree of unsaturation of Cu2+,28,29 Isat/Ipp are 0.3 and 0.4 for Cu/CeO2-mcc and Cu/CeO2-mc, respectively. The lower Isat/Ipp for Cu/CeO2-mcc also demonstrates the higher degree of the unsaturated state of Cu2+, which implies the formation of Cu–Ce solid structure.30 Furthermore, through careful observation, it can be found that the Cu2+ 2p3/2 peak of Cu/CeO2-mcc shifts towards higher binding energy compared with Cu/CeO2-mc, indicating lower electron density around Cu and the weakened Cu–O bond for Cu/CeO2-mcc. The Oβ and Oα binding energies of Cu/CeO2-mcc both shift to higher binding energies. In addition, in contrast to Cu/CeO2-mc catalysts, the Ce3+ binding energy of Cu/CeO2-mcc significantly shifts to a lower level, which indicates electron enrichment around Ce species. The electron density variation of Cu, O, and Ce confirms the transfer of electrons from O of CuO to Ce species, which further verifies the formation of Cu–Ce solid solution structure, as indicated in XRD and TPR.
Surface-adsorbed oxygen is easily activated and is recognized as oxygen vacancies, therefore, the relative concentration of oxygen vacancies on the surface can be expressed by Oβ/(Oα + Oβ + Oγ).31 Oβ/(Oα + Oβ + Oγ) is higher for Cu/CeO2-mcc (38.1%) than that of Cu/CeO2-mc (22.8%). Two reasons may cause the enhanced formation of oxygen vacancy. First, the formation of Cu–Ce solid solution facilitates the reaction of Cu+ + Ce4+ ↔ Cu2+ + Ce3+, which promotes the transfer from Ce4+ to Ce3+. This is confirmed by the relative content of Ce3+ species acquired through the calculation of the ratio of Ce3+ to the total Ce species presented in Table 1. Ce3+ content on the surface of Cu/CeO2-mcc (22.7%) is higher than Cu/CeO2-mc (18.4%) catalyst. The conversion of Ce4+ to Ce3+ generates oxygen vacancies.32 Meanwhile, different exposed crystal faces for CeO2 correspond to the order of oxygen vacancy formation energy as (110) < (100) < (111).33 According to TEM and XRD, Cu/CeO2-mc exposes more (110) and (100) crystal planes. Therefore, oxygen vacancies are more likely to be formed on the surface of Cu/CeO2-mcc.
UV-Raman spectra were used to further explore the vacancy defects in different Cu/CeO2 catalysts and pure cubic CeO2, as shown in Fig. 5. The strong peak in the UV-Raman spectrum of pure CeO2 at 447 cm−1 is related to the IF2g vibrational mode of the CeO2 fluorite structure. The peak at 578 cm−1 is attributed to the defect-induced ID mode, which is associated with the oxygen vacancies caused by Ce3+ in CeO2.34 There is no significant shift of peaks in Cu/CeO2-mc catalysts compared to pure CeO2, indicating the highly dispersed Cu species loading on CeO2 fluorite structure. For Cu/CeO2-mcc catalysts, both vibrational peaks of IF2g and ID shift higher bands, the blueshift phenomenon is due to changes in the lattice parameter of Ce.35 Owing to the formation of Cu–Ce solid solution, Cu species enter into the crystal plane of Ce causing a decrease in the lattice parameter of Ce, corresponding to XRD results. In addition, the ratio of ID/IF2g represents a relative concentration of oxygen vacancies.11 As shown in Table 1 the oxygen vacancy concentration of Cu/CeO2-mc catalyst (42.9%) is similar to that of the cubic CeO2 (40.8%). In contrast, the ID/IF2g ratio of Cu/CeO2-mcc increases to 60.5%. This further confirms the increased oxygen vacancies for Cu/CeO2-mcc, which is owing to the formation of Cu–Ce solid solution structure. Oxygen vacancies are considered as main active sites for CO2 adsorption and activation. Therefore, Cu/CeO2-mcc catalysts with increased oxygen vacancies may have high activity for CO2 conversion.
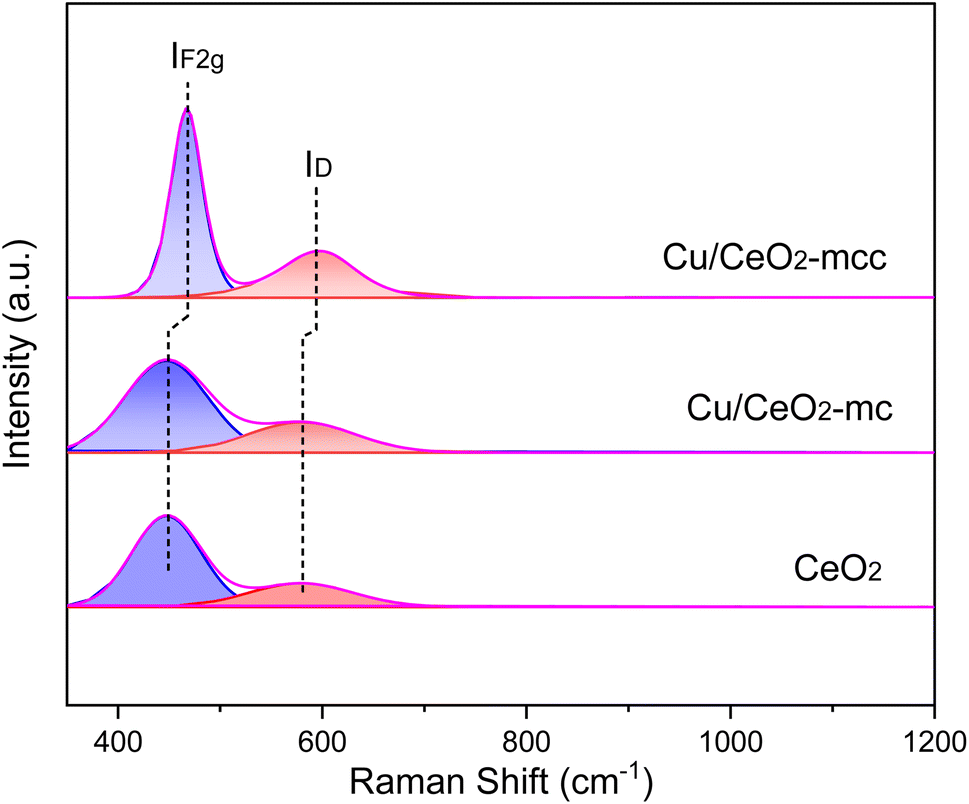 | ||
| Fig. 5 UV-Raman spectra of Cu/CeO2 catalyst and CeO2. | ||
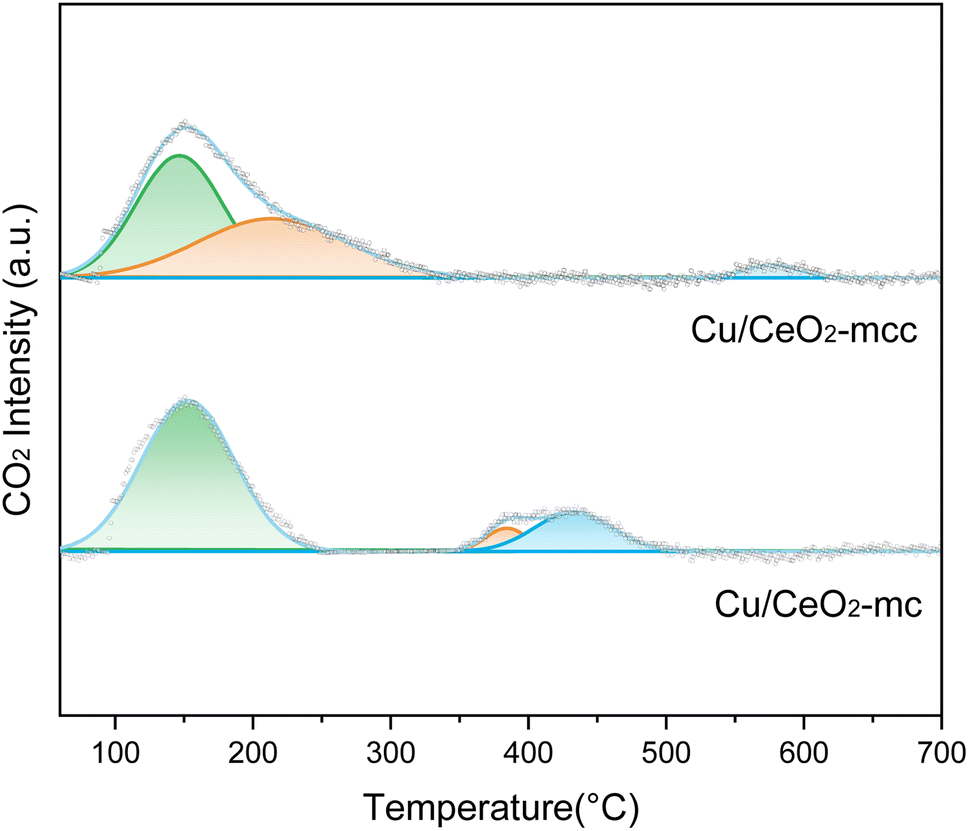
Fig. 6 illustrates the CO2-TPD spectra of Cu/CeO2-mcc and Cu/CeO2-mc to explore the CO2 adsorption ability of catalysts. The α-peak locates at less than 200 °C, β-peak is from 200–400 °C, and above 400 °C belongs to γ-peak.36 The α-peak is ascribed to weak adsorption of CO2, β-peak is attributed to medium-strength adsorption of CO2.37 The γ peak is attributed to CO2 produced from sample decomposition. Compared to Cu/CeO2-mc, the shift of β-peak to lower temperature is observed for Cu/CeO2-mcc. This difference further demonstrates the different structures of the two catalysts. The calculated adsorption peak area ratios are listed in Table 2. There is a significant increase for the medium-strength CO2 adsorption (37.8%) on Cu/CeO2-mcc catalysts. Medium-strength CO2 adsorption occurs on the surface oxygen vacancies, which can be speculated that Cu–Ce solid solution structure provides more oxygen vacancies. It is recognized that medium-strength adsorption sites are considered active for CO2 hydrogenation,38 high β-peak area ratio of Cu/CeO2-mcc indicating the improvement of medium-strength CO2 adsorption, which may improve the activity of Cu/CeO2-mcc in RWGS.
 | ||
| Fig. 6 CO2-TPD spectra of Cu/CeO2-mc and Cu/CeO2-mcc. | ||
| Catalysts | The α peak (%) | The β peak (%) | The γ peak (%) |
|---|---|---|---|
| Cu/CeO2-mc | 77.7 | 5.3 | 17.0 |
| Cu/CeO2-mcc | 50.6 | 37.8 | 11.1 |
3.2 Catalytic evaluation
RWGS activity was evaluated for two Cu/CeO2 catalysts at 300–700 °C, the results are demonstrated in Fig. 7a. Both catalysts exhibit the improvement of CO2 conversion with rising temperature, which is consistent with the thermodynamically beneficial feature of RWGS. CO2 conversion of the Cu/CeO2-mc catalyst increases significantly compared with the catalyst prepared with the conventional solution combustion method (Cu/CeO2-c) (Fig. S3†). The inferior catalytic property of Cu/CeO2-c may be related to the structure collapse of cubic CeO2 (Fig. S4†), while the TEM results for Cu/CeO2-mcc and Cu/CeO2-mc show that the cubic structure maintains well for micro-combustion because of the mild temperature during micro-combustion shown in Fig. S5.† Importantly, the activity of Cu/CeO2-mcc catalyst is significantly better than Cu/CeO2-mc at 300–500 °C. For example, CO2 conversion on Cu/CeO2-mcc is 33.14% and it is 21.72% on Cu/CeO2-mc at 450 °C. After calcination, the formation of Cu–Ce solid solution structure in the Cu/CeO2-mcc catalyst promotes the conversion of CO2 in the low-temperature RWGS reaction. The two catalysts maintain the same CO2 conversion after 500 °C, which is close to the thermodynamic equilibrium (dashed line), and CO selectivity is almost 100% for all the catalysts in the reaction temperature range. The stability test of the catalysts is illustrated in Fig. 7b. It is found that CO2 conversion of Cu/CeO2-mc decreases from the very beginning of the reaction, and it reduces from 40.24% to 31.68% in the 11 h at 500 °C. While CO2 conversion of the Cu/CeO2-mcc catalyst remains unchanged in the first 5 h, and then the conversion slightly decreases within 5%. Therefore, the Cu/CeO2-mcc catalyst has superior stability than Cu/CeO2-mc.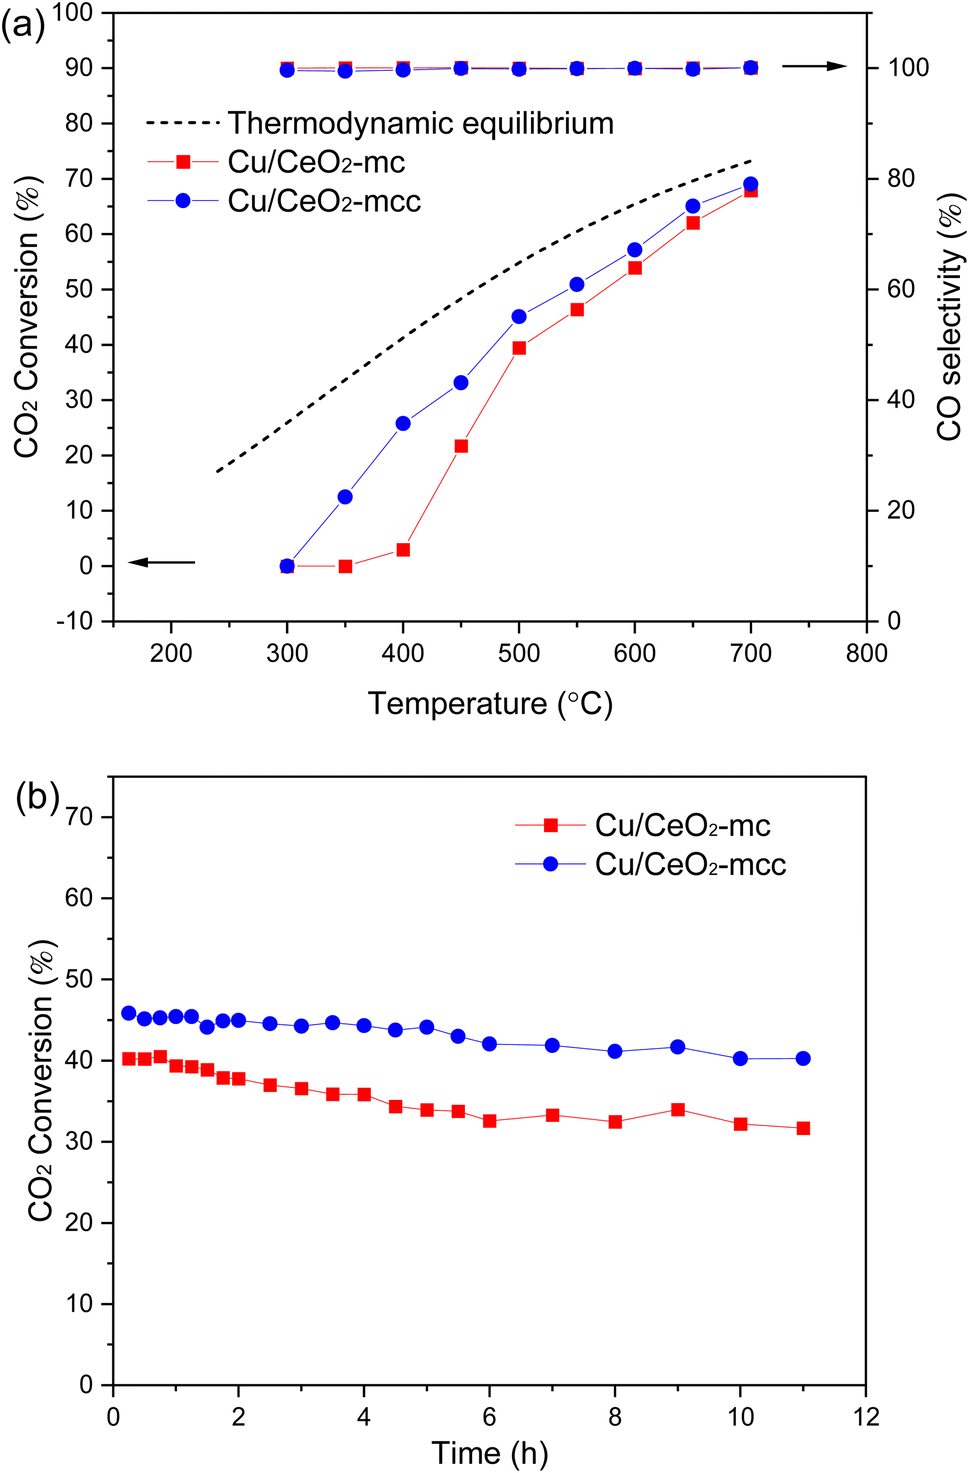 | ||
| Fig. 7 Catalytic evaluation for Cu/CeO2-mc and Cu/CeO2-mcc (a) CO2 conversion and CO selectivity versus temperature; (b) CO2 conversion versus time. | ||
The excellent low-temperature activity and stability exhibited by Cu/CeO2-mcc catalysts can be attributed to the Cu–Ce solid solution structure and CuO clusters. Cu species of Cu/CeO2-mc catalysts highly disperse on support surfaces, whereas Cu–Ce solid solutions with small CuO clusters co-exist on the surface of Cu/CeO2-mcc catalysts. The Cu–Ce solid solution generates more oxygen vacancies while CuO clusters provide active sites for H dissociation. Under the synergetic effect of Cu species and oxygen vacancies,39,40 Cu/CeO2-mcc catalyst exhibits superior catalytic performance than Cu/CeO2-mc.
3.3 Reaction mechanism analysis
In situ DRIFTS was conducted to identify the reaction intermediates during the RWGS reaction. Fig. 8 shows the in situ DRIFTS spectra of Cu/CeO2-mc and Cu/CeO2-mcc catalysts. Both catalysts exhibit vibrational peaks of reactant CO2 at 2200–2400 cm−1.41 Linear CO absorption bands (2000–2200 cm−1) are observed when the reaction temperature exceeds 200 °C. The formation of carbonate species at 1250–1600 cm−1 is attributed to the species of CO2 adsorption.39 In particular, the bands at around 1597 cm−1 and 1345 cm−1 belong to species. The asymmetric and symmetric OCO stretching vibrations for HCOO* species are observed at around 1580 cm−1 and 1386 cm−1, and 2848 cm−1 for C–H vibrations of HCOO*.42,43 With the increase of temperature,
  disappears accompanied by significantly enhanced peak density for HCOO* vibrational on both Cu/CeO2-mc and Cu/CeO2-mcc catalysts, indicating the occurrence of transformation from
  to form HCOO*. This implies that HCOO* pathway is the main mechanism in RWGS for Cu/CeO2 catalyst. Another interesting finding is that the
  species are different for the two catalysts. For Cu/CeO2-mc, the density of vibrational peaks (1527 cm−1) attributed to monodentate
  species (
 ) gradually strengthens when the temperature increases,44,45 whereas bidentate
  (
( ) at 1472 cm1 tends to weaken. This suggests that
  is the main species on the catalysts of which Cu species are highly dispersed on the surface of CeO2. Whereas,
  species are the main adsorbed carbonate species for the Cu/CeO2-mcc. Therefore, it can be concluded that CO2 is activated through
  and
and  on Cu/CeO2-mcc and Cu/CeO2-mc, respectively.
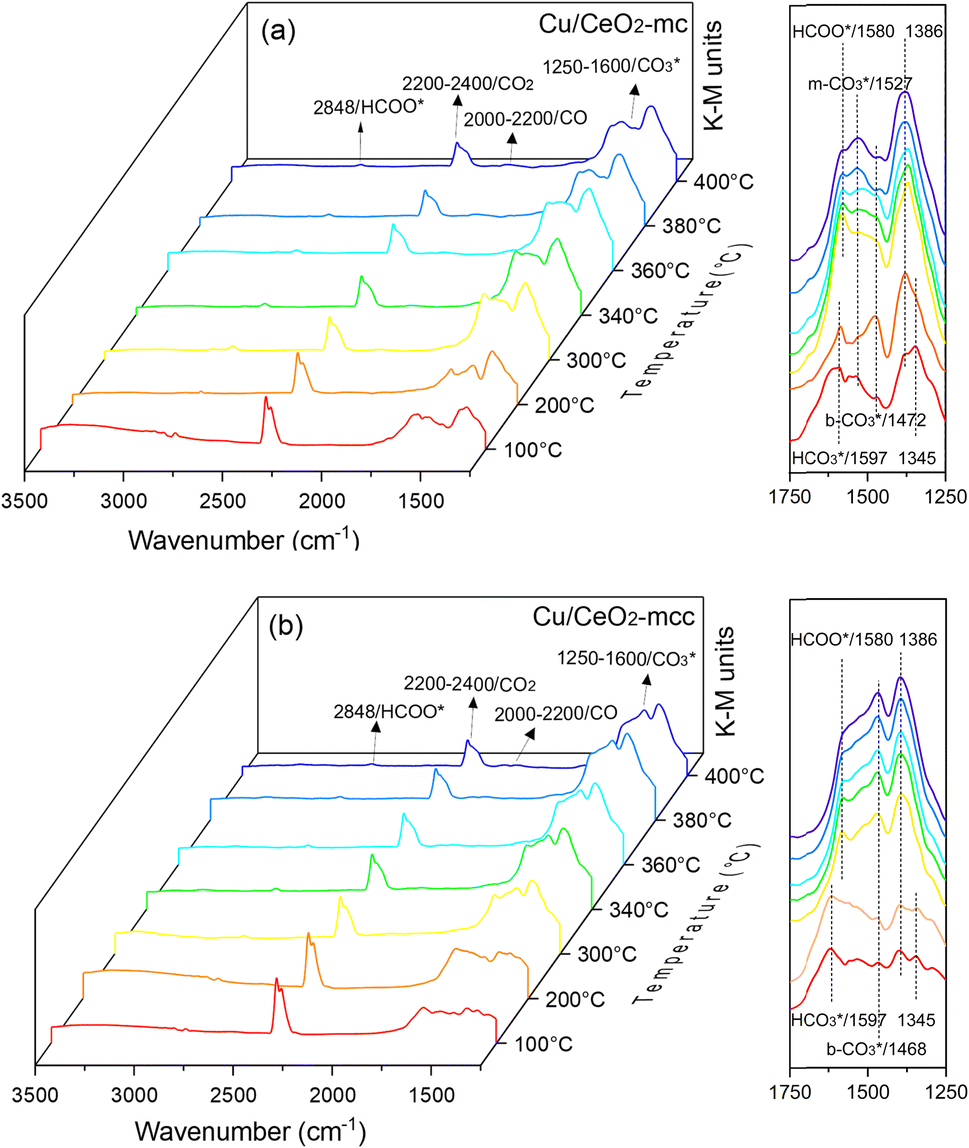 | ||
| Fig. 8 In situ DRIFTS for the RWGS reaction over (a) Cu/CeO2-mc and (b) Cu/CeO2-mcc at different temperatures. | ||
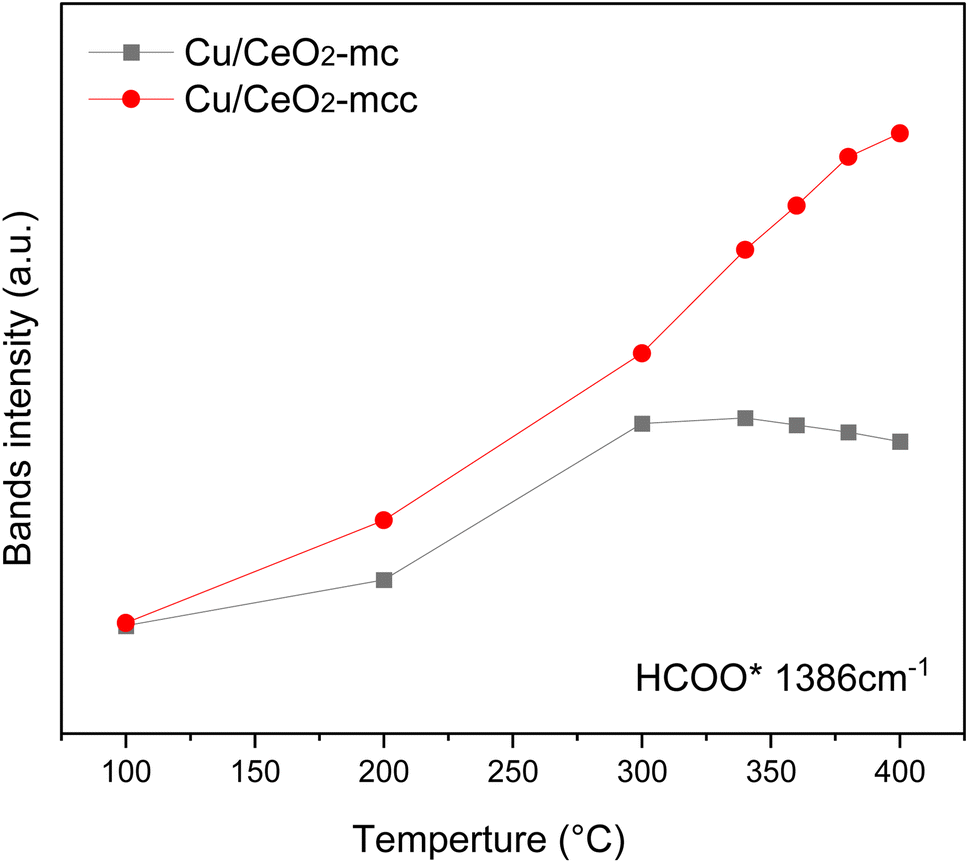
The HCOO* (1386 cm−1) band intensities of Cu/CeO2-mc and Cu/CeO2-mcc with temperature are further analyzed as shown in Fig. 9. It can be seen from Fig. 9 that the intensity of HCOO* for Cu/CeO2-mcc gradually increases with temperature rises, while the band for HCOO* intermediate of Cu/CeO2-mc tends to decrease above 300 °C. It should be noted that the change of HCOO* intensity before 400 °C for both samples is closely related to the CO2 conversion. When the temperature increases from 300 to 400 °C, CO2 conversion of Cu/CeO2-mcc significantly enhanced from 0% to 25.7%. While for Cu/CeO2-mc, CO2 conversion remains unchanged. This confirmed that HCOO* is a key reaction intermediate for CO2 conversion, in which hydrogen and carbonate species are involved in generating HCOO* intermediates. The different structures of Cu/CeO2-mc and Cu/CeO2-mcc lead to different  species. On Cu/CeO2-mcc, there is more surface oxygen as discussed in XPS and UV-Raman analysis. When CO2 reacts with surface O to form
  , O of
  can be captured by oxygen vacancy, thereby
  forms in the surface of Cu–Ce solid solution. While on Cu/CeO2-mc, fewer oxygen vacancies lead to the formation of
  . Importantly, the stability of adsorbed CO2 species is demonstrated in the following order: carboxylic acid ≈
  .46 This may explain the different desorption temperatures for the β peak of the two catalysts in CO2-TPD. Moreover,
  is apt to break the C–O bond and be hydrogenated to HCOO* by H*. This also results in the higher activity of Cu/CeO2-mcc, adsorbed CO2 on Cu–Ce solid solution structure can easily convert to CO through the
  pathway.
 | ||
| Fig. 9 Temperature-profiles of selected band intensities. | ||
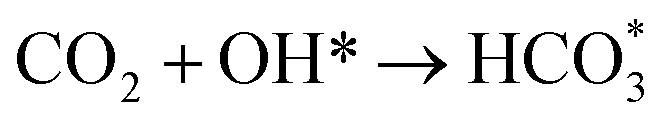
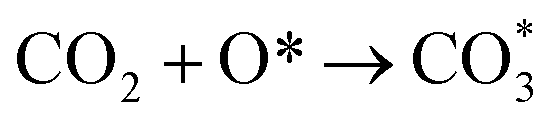
Based on DRIFTS, the RWGS mechanism is presented in Fig. 10. The formate pathway is the main mechanism for RWGS, in which hydrogen and carbonate species are involved in generating formate intermediates (HCOO*).  is mainly from the reaction of CO2 and surface OH (eqn (3)–(5)),
  can be hydrogenated to HCOO* in presence of H* species (eqn (6)). HCOO* can also form through the hydrogenation of
  which is generated from the adsorbed CO2 with surface oxygen species of the catalyst (eqn (7) and (8)). In Cu/CeO2-mc, HCOO* generates from
  , while for Cu/CeO2-mcc HCOO* forms from
  . This difference is mainly caused by the increased oxygen vacancy of Cu/CeO2-mcc owing to the Cu–Ce solid solution. Subsequently, HCOO* further decomposes into CO*, O* and H* (eqn (9) and (10)), H* combines with surface OH* to form H2O* (eqn (11)).
| H2 + 2* → 2H* | (3) |
| H* + O* → OH* + * | (4) |
 | (5) |
 | (6) |
 | (7) |
 | (8) |
| HCOO* + * → HCO* + O* | (9) |
| HCO* → CO* + H* | (10) |
| H* + OH* → H2O* + * | (11) |
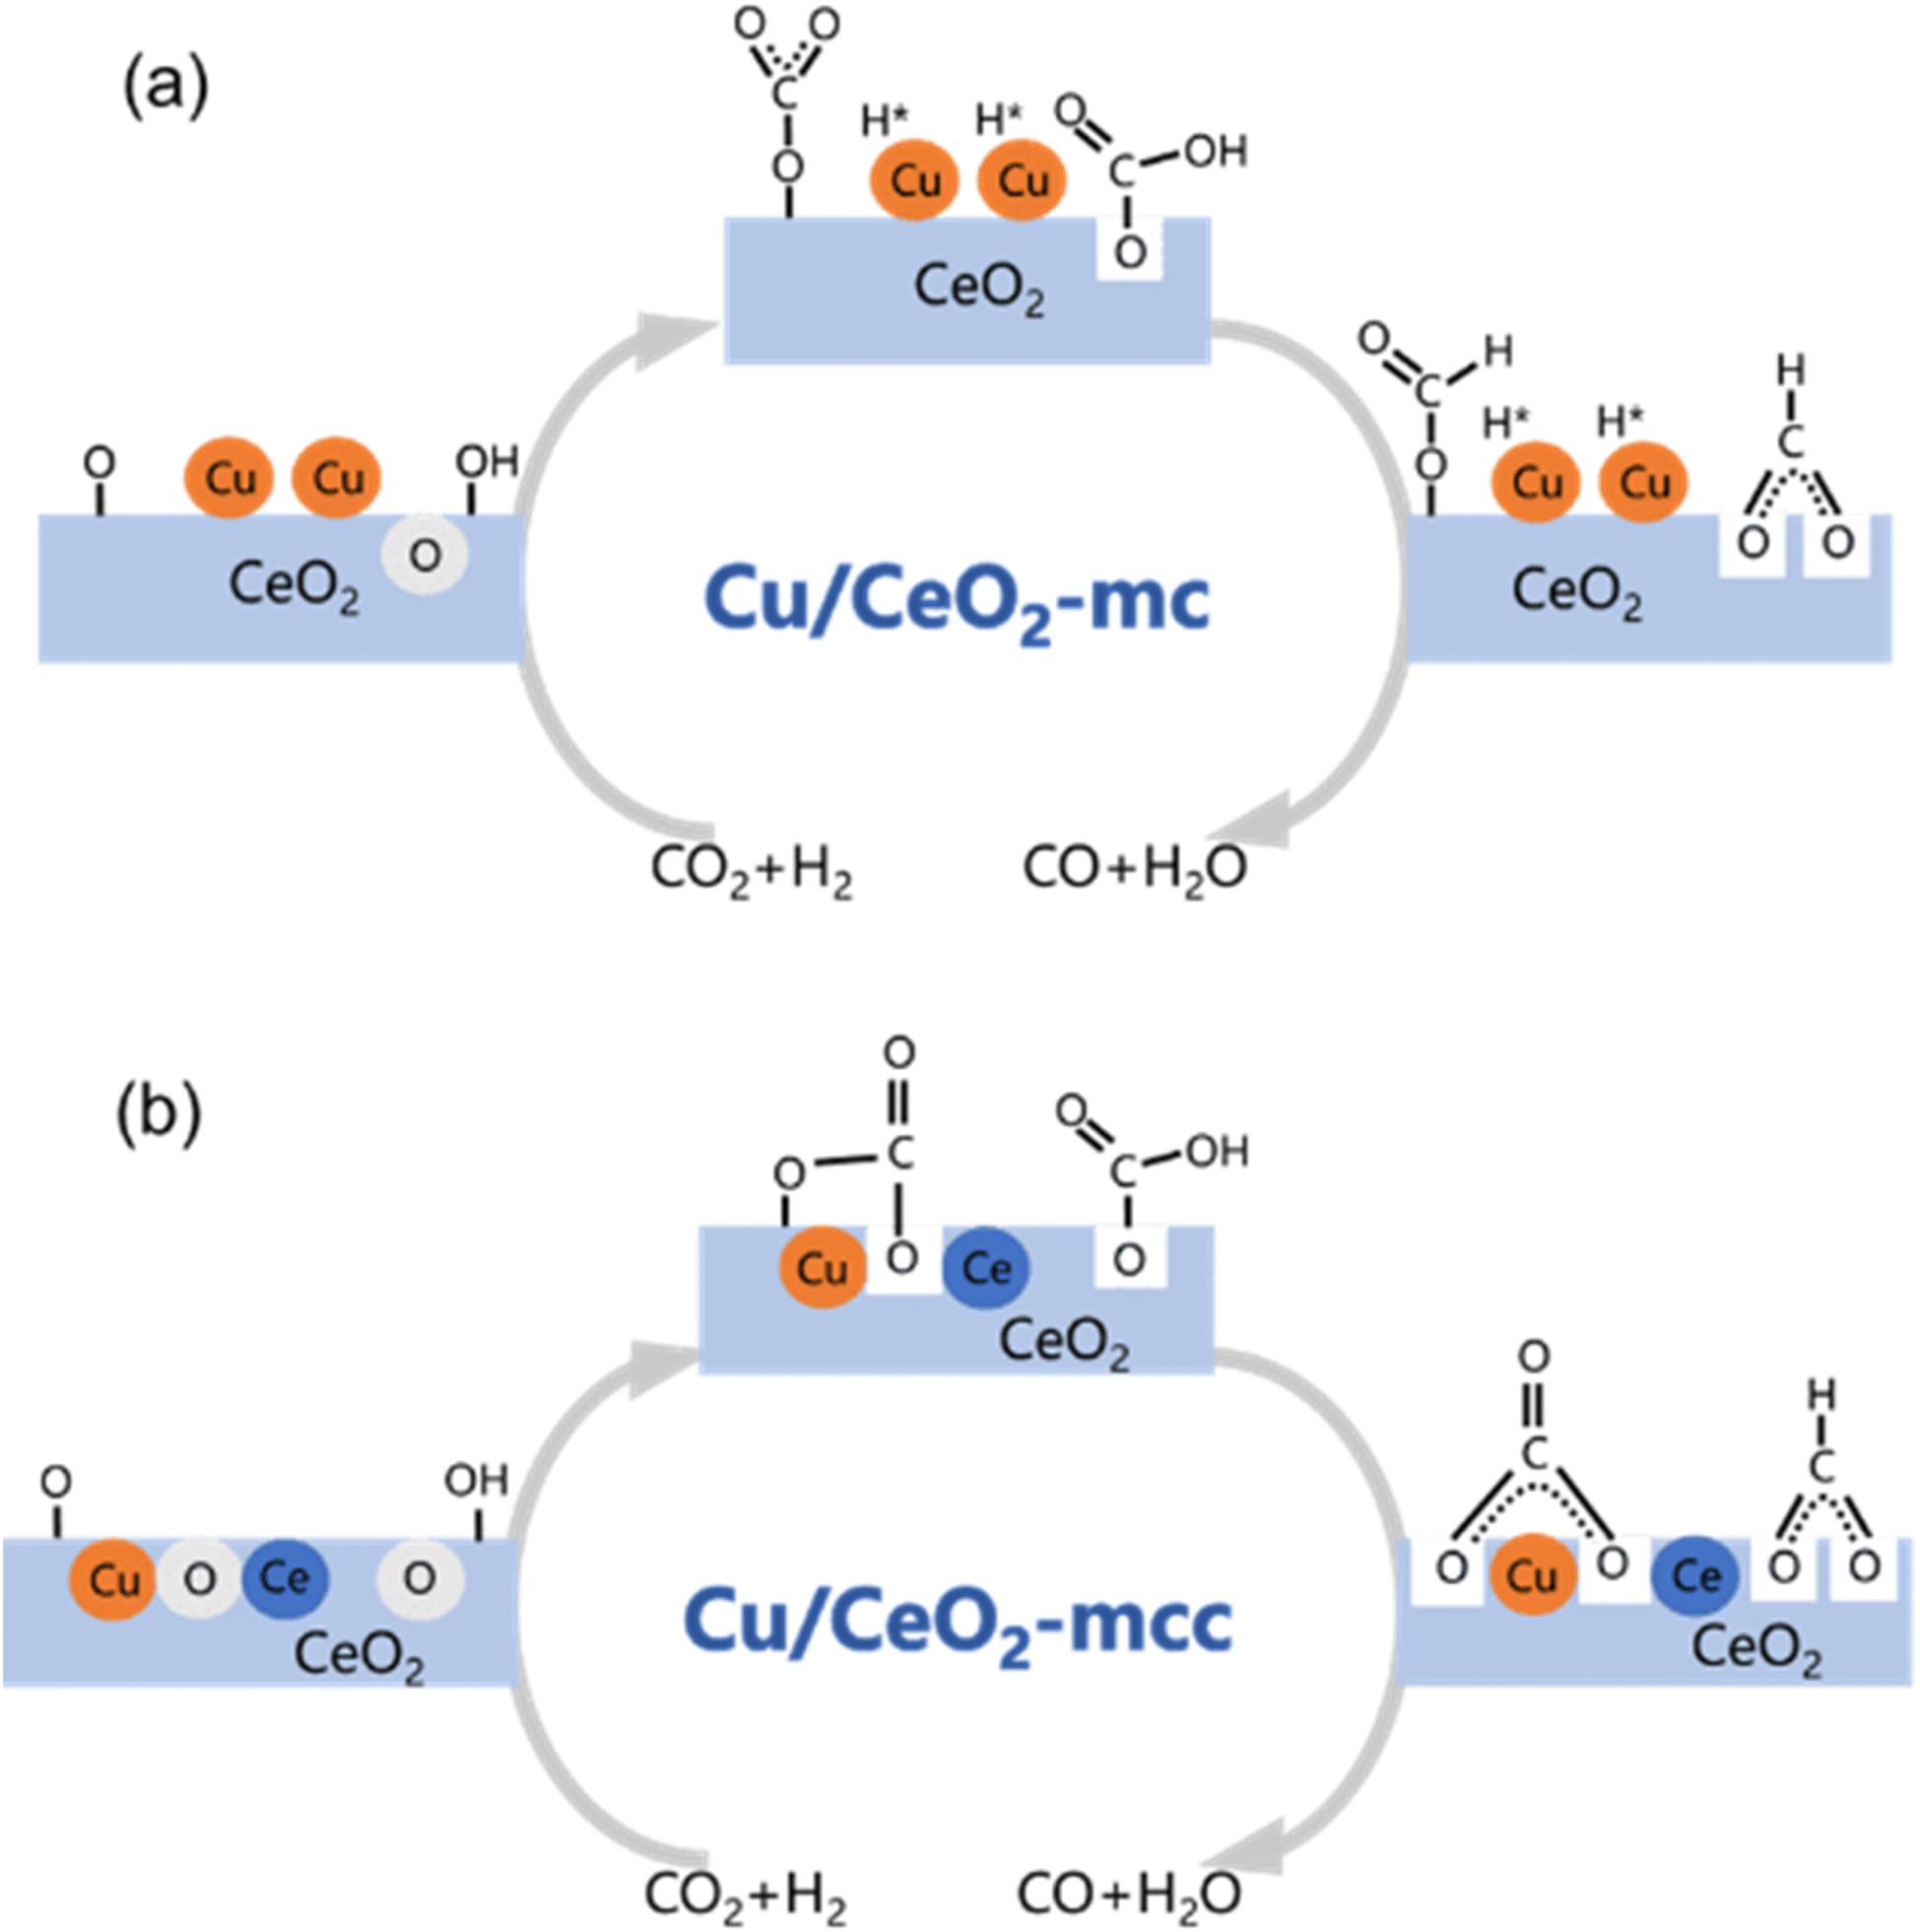 | ||
| Fig. 10 Schematic for RWGS mechanism on (a) Cu/CeO2-mc; (b) Cu/CeO2-mcc. | ||
4 Conclusions
In this paper, plasma-induced micro-combustion method is used to prepare Cu/CeO2 catalysts, focusing on the effect of calcination process on structures and properties of catalysts. Structural characterization demonstrated that calcination process produces Cu–Ce solid solution structures and CuO clusters in Cu/CeO2-mcc, while highly dispersed Cu species form on CeO2 surface of Cu/CeO2-mc. Catalytic evaluation in RWGS successfully confirms that Cu/CeO2-mcc has higher activity and stability than Cu/CeO2-mc due to the generation of Cu–Ce solid solution with more surface oxygen vacancies to enhance adsorption and activation of CO2. Mechanistic analysis further reveals that Cu–Ce solid solution structure is beneficial to the formation of , whereas
  is mainly developed on the surface of catalysts with Cu species highly dispersed on CeO2 surface.
  more easily dissociates and hydrogenate to HCOO*, which decomposes into CO. This study illustrates the effect of calcination process on the structural properties of Cu/CeO2 catalysts and provides references to the structural design of Cu-based catalysts.
Conflicts of interest
There are no conflicts to declare.Acknowledgements
Binran Zhao acknowledges the support from the National Key R&D Program of China (No. 2018YFB0604903).References
- S. Zhao, H. Li, B. Wang, X. Yang, Y. Peng and H. Du, Fuel, 2022, 321, 124124 CrossRef CAS.
- S. Simanungkalit, I. Jones, C. Okoye, Z. Zhang, M. Zhu and D. Zhang, Biomass Bioenergy, 2023, 174, 106850 CrossRef CAS.
- S. Han, D. Fan, N. Chen, W. Cui, L. He and P. Tian, ACS Catal., 2023, 13(16), 10651–10660 CrossRef CAS.
- Q. Yu, Z. Liu and Y. Wang, Chemical Reaction Engineering and Process, 2014, 30(05), 421–427 CAS.
- N. Nelson, L. Chen, D. Meira, L. Kovarik and J. Szanyi, Angew. Chem., Int. Ed., 2020, 132(40), 17657–17663 CrossRef PubMed.
- X. Yang, X. Su, X. Chen, H. Duan, B. Liang and Q. Liu, Appl. Catal., B, 2017, 216, 95 CrossRef CAS.
- Z. Zhao, M. Wang, P. Ma, Y. Zheng, J. Chen and H. Li, Appl. Catal., B, 2021, 291, 120101 CrossRef CAS.
- A. Rabee, D. Zhao, S. Cisneros, C. Kreyenschulte, V. Kondratenko and S. Bartling, Appl. Catal., B, 2023, 321, 122083 CrossRef CAS.
- Y. Hsueh, Y. Chuah, C. Lin and D. Tsai, ACS Appl. Nano Mater., 2022, 5(7), 8883–8893 CrossRef CAS.
- P. Ebrahimi, A. Kumar and M. Khraisheh, Int. J. Hydrogen Energy, 2022, 47(97), 41259–41267 CrossRef CAS.
- Y. Zhang, L. Liang, Z. Chen, J. Wen, W. Zhong and S. Zou, Appl. Surf. Sci., 2020, 516, 146035 CrossRef CAS.
- W. Kang and A. Varma, Appl. Catal., B, 2018, 220, 409–416 CrossRef CAS.
- B. Zhao, Y. Yao, H. Shi, F. Yang, X. Jia and P. Liu, Catal. Today, 2019, 337, 28–36 CrossRef CAS.
- B. Zhao, L. Liu and H. Shi, Ind. Eng. Chem. Res., 2022, 61(11), 3877–3888 CrossRef CAS.
- M. Lykaki, E. Pachatouridou, S. Carabineiro, E. Iliopoulou, C. Andriopoulou and N. Kallithrakas-Kontos, Appl. Catal., B, 2018, 230, 18–28 CrossRef CAS.
- G. Zhou, F. Xie, L. Deng, G. Zhang and H. Xie, Int. J. Hydrogen Energy, 2020, 45(19), 11380–11393 CrossRef CAS.
- X. Guo and R. Zhou, J. Power Sources, 2017, 361, 39–53 CrossRef CAS.
- J. Li, Z. Zhang, Z. Tian, X. Zhou, Z. Zheng and Y. Ma, J. Mater. Chem., 2014, 2(39), 16459–16466 RSC.
- A. Vantomme, Z. Yuan, G. Du and B. Su, Langmuir, 2004, 21(3), 1132–1135 CrossRef PubMed.
- A. Trovarelli and J. Llorca, ACS Catal., 2017, 7(7), 4716–4735 CrossRef CAS.
- Y. Xiao, J. Wu, T. Jia, T. Li, Z. Wang and Y. Qi, Colloid Interface Sci. Commun., 2021, 40, 100357 CrossRef CAS.
- D. Svintsitskiy, T. Kardash, O. Stonkus, E. Slavinskaya, A. Stadnichenko and S. Koscheev, J. Phys. Chem. C, 2013, 117(28), 14588–14599 CrossRef CAS.
- L. Xue, C. Zhang, J. Wu, Q. Fan, Y. Liu and Y. Wu, Appl. Catal., B, 2022, 304, 120951 CrossRef CAS.
- R. Singh, K. Tripathi and K. Pant, Fuel, 2021, 303, 121289 CrossRef CAS.
- J. Shim, H. Na, A. Jha, W. Jang, D. W. Jeong and I. Nah, Chem. Eng. J., 2016, 306, 908–915 CrossRef CAS.
- G. Zhou, B. Dai, H. Xie, G. Zhang, K. Xiong and X. Zheng, J. CO2 Util., 2017, 21, 292–301 CrossRef CAS.
- R. Peng, X. Sun, S. Li, L. Chen, M. Fu and J. Wu, Chem. Eng. J., 2016, 306, 1234–1246 CrossRef CAS.
- B. Skårman, D. Grandjean, R. Benfield, A. Hinz, A. Andersson and L. Wallenberg, J. Catal., 2002, 211(1), 119–133 Search PubMed.
- X. Hou, Q. Zhao, Z. Liu, D. Cheng, F. Chen and X. Zhan, Int. J. Hydrogen Energy, 2023, 48, 24697–24708 CrossRef CAS.
- X. Guo and R. Zhou, J. Power Sources, 2017, 361, 39–53 CrossRef CAS.
- T. Sakpal and L. Lefferts, J. Catal., 2018, 367, 171–180 CrossRef CAS.
- L. Kong, Y. Shi, J. Wang, P. Lv, G. Yu and W. Su, Catal. Lett., 2023, 153(2), 477–492 CrossRef CAS.
- W. Zhang, X. Ma, H. Xiao, M. Lei and J. Li, J. Phys. Chem. C, 2019, 123(18), 11763–11771 CrossRef CAS.
- B. Wang, B. Chen and Y. Sun, Appl. Catal., B, 2018, 238, 328–338 CrossRef CAS.
- V. Dimitriy, C. Zhang and S. Hwang, ACS Catal., 2020, 10(17), 10216–10228 CrossRef.
- Y. Pu, Y. Luo, X. Wei, J. Sun, L. Li and W. Zou, Appl. Catal., B, 2019, 254, 580–586 CrossRef CAS.
- S. Chang, W. Na, J. Zhang, L. Lin and W. Gao, New J. Chem., 2021, 45, 22814–22823 RSC.
- J. González-Arias, M. González-Castaño, M. E. Sánchez and J. Cara-Jiménez, Renewable Energy, 2022, 182, 443–451 CrossRef.
- P. Yan, H. Peng, X. Wu, H. Rabiee, Y. Weng, M. Konarova, J. Vogrin, A. Rozhkovskaya and Z. Zhu, J. Catal., 2024, 432, 115439 CrossRef CAS.
- P. Yan, E. Kennedy and M. Stockenhuber, Green Chem., 2021, 23, 4673 RSC.
- A. Goguet, F. Meunier, D. Tibiletti, J. Breen and R. Burch, J. Phys. Chem. B, 2004, 108(52), 20240–20246 CrossRef CAS.
- X. Wang, H. Shi, J. Kwak and J. Szanyi, ACS Catal., 2015, 5(11), 6337–6349 CrossRef CAS.
- S. Kattel, B. Yan, Y. Yang, J. Chen and P. Liu, J. Am. Chem. Soc., 2016, 138(38), 12440–12450 CrossRef CAS PubMed.
- W. Wang, Z. Qu, L. Song and Q. Fu, J. Energy Chem., 2020, 40, 22–30 CrossRef.
- K. Pokrovski, K. Jung and A. Bell, Langmuir, 2001, 17, 4297–4303 CrossRef CAS.
- U. Tumuluri, J. Howe, W. Mounfield, M. Li, M. Chi and Z. Hood, ACS Sustain. Chem. Eng., 2017, 5(10), 9295–9306 CrossRef CAS.
Footnote |
| † Electronic supplementary information (ESI) available. See DOI: https://doi.org/10.1039/d4ra02545h |
| This journal is © The Royal Society of Chemistry 2024 |