 Open Access Article
A novel magnetite C18/paracetamol/alginate adsorbent bead for simultaneous extraction of synthetic antioxidants and bisphenol A in water samples†
Nurma Sulaimanab,
Nuryanee Hamaab,
Saowanit Saithonga and
Thitima Rujiralai *ab
*ab
aCenter of Excellence for Innovation in Chemistry and Division of Physical Science, Faculty of Science, Prince of Songkla University, Songkhla, 90110, Thailand. E-mail: thitima.r@psu.ac.th
bAnalytical Chemistry and Environment Research Unit, Division of Science, Faculty of Science and Technology, Prince of Songkla University, Pattani, 94000, Thailand
First published on 6th June 2024
Abstract
A novel magnetic composite bead was synthesized using carbon 18, paracetamol and alginate (mC18/Pa/Alg). The bead was applied to simultaneously adsorb butylated hydroxytoluene, butylated hydroxyanisole, and bisphenol A from water samples by magnetic solid-phase extraction (MSPE). The adsorbed analytes were determined by gas chromatography-flame ionization detection. The morphology and composition of the bead were examined by field emission scanning electron microscopy, energy-dispersive X-ray spectrometry, X-ray diffraction analysis, Fourier transform infrared spectroscopy and Brunauer–Emmett–Teller surface analysis. The best condition of MSPE included an adsorbent bead made with 0.8% sodium alginate, a 0.3 g adsorbent dose, a sample solution pH of 7, and a desorption time of 20 min in methanol. The proposed method exhibited linearity at concentrations between 0.015 and 1.00 μg mL−1 of analytes. Limits of detection ranged from 6.86 to 9.66 ng mL−1. Recoveries from 80.3 to 100.1% were achieved with interday and intraday precisions (RSDs) of 0.4–4.3%.
1 Introduction
Synthetic organic compounds such as phenolic antioxidants and bisphenol A (BPA) are found in plasticizers, packaging materials and cosmetics, and in what we eat and drink.1,2 They are used to protect foodstuffs, polymeric materials and personal care products against deterioration caused by oxidation reactions.2 Butylated hydroxytoluene (BHT) and butylated hydroxyanisole (BHA) are the most frequently used phenolic antioxidants, and with BPA, are classified as endocrine disrupting chemicals which can potentially interfere with, or slow down, the normal synthesis, release, binding and action functions of the endocrine system.1,3 To avoid the adverse health effects of these compounds, the permissible levels of BHT and BHA in food are 200 μg g−1 and 2–1000 μg g−1 for BPA.4 In drinking water, BPA should not exceed 0.01 mg L−1.5 Since these compounds are present in the environment, their monitoring and determination are important for public health purposes.In real sample analysis, complex matrices and low concentration levels of analytes are key limitations for determination by chromatography and spectrometry, and sample pretreatment or preconcentration is required. Sample preparation methods developed for the adsorption/extraction of antioxidants and BPA include solid-phase extraction (SPE),6 dispersive solid-phase extraction (DSPE),7 solid-phase microextraction,8 liquid–liquid extraction,9 and magnetic solid-phase extraction (MSPE),10–12 dispersive liquid–liquid microextraction (DLLME),13 and microextraction using deep eutectic solvents (DESs).14 Compared to SPE and LLE, MSPE is more suitable for large volumes of sample solution. The magnetic adsorbent with the adsorbed analyte can be separated quickly and easily from the solution using a magnetic separator. MSPE requires no filtration and no SPE column.11,12,15 Magnetic adsorbents that have been applied for the MSPE and pre-concentration of antioxidants and BPA include composites of multi-walled carbon nanotubes, iron oxide and manganese dioxide (MWCNTs–Fe3O4–MnO2)11 and magnetic cobalt ferrite, natural organic matter, and graphene (CoFe2O4/NOM/graphene)12 for BPA. These adsorbents were synthesized either under N2 gas or at high temperature (100 °C) for 24 h. A dextran coated-magnetite was prepared by co-precipitation and then doped with a metal–organic framework (MOF), using the reflux method with dimethylformamide (DMF) as a suspension solvent: the obtained MOF:Fe3O4@Dex composite was applied for BPA removal.16 Recently, a magnetic molecularly imprinted polymer (MMIP) was synthesized through the radical polymerization of the monomer with a BPA template that was removed by Soxhlet extraction6 and a graphene oxide-alginate bead (GO-AB) was synthesized with a centrifugation step for GO.17 Previously, we prepared magnetic mesoporous carbon by using phloroglucinol and glyoxylic acid as precursors and pluronic F-127 as a surfactant: the composite was used to extract BHA and BHT.10 However, our method required a temperature of 800 °C under a nitrogen atmosphere and we would prefer to develop a magnetic adsorbent without the complexity, long preparation time and harsh solvent and temperature conditions of our and other methods.
Sodium alginate (SA) is a naturally occurring biopolymer with abundant carbonyl and hydroxyl groups and oxygen atoms.17 It has been used to prepare biocompatible and biodegradable materials using easy and cost-effective methods. Furthermore, the extraction of our target analytes can be increased via π–π stacking and hydrogen bonding with the widely used painkiller paracetamol (acetaminophen or 4′-hydroxyacetanilide),18 which contains aromatic ring and amine group. In addition, to our knowledge, there are no reports of an adsorbent prepared from magnetite, C18, SA, and paracetamol.
Herein, we synthesized a magnetite C18/paracetamol/alginate composite bead (mC18/Pa/Alg) by combining SA, C18 and paracetamol (Pa) with the ferromagnetic properties of Fe3O4. This composite bead interacted with BHA, BHT and BPA by hydrogen bonding, π–π stacking and hydrophobic interactions, and facilitated the separation and recovery of the analytes for MSPE. The synthesized mC18/Pa/Alg bead was used to extract and enrich the target analytes from stream and bottled water samples for quantification by gas chromatography with flame ionization detection (GC-FID). The effects of various parameters on the efficiency of MSPE were optimized.
2 Materials and methods
2.1 Chemicals
Butylated hydroxyaisole (BHA) was purchased from Sigma-Aldrich (Germany). Butylated hydroxyltoluene (BHT) was from Sigma-Aldrich (Spain). Bisphenol A (BPA) was purchased from Alfa Aesar (the Netherlands). Ferric chloride hexahydrate (FeCl3·6H2O), ferrous sulfate heptahydrate (FeSO4·7H2O), calcium chloride (CaCl2), and ammonia (NH3) were purchased from Merck (Germany). HPLC grade methanol, acetonitrile, isopropanol and ethyl acetate, and hydrochloric acid (HCl) were from RCI Labscan (Thailand). Sodium alginate (SA) (low viscosity) and calcium carbonate (CaCO3) were purchased from Loba-Chemie (India). Supelclean ENVI-C18 from Supelco (USA) with a 17% carbon load was polymerically bonded and endcapped. Cemol Brand 500 mg paracetamol (Pa) tablets were from a store in Hat Yai District, Songkhla Province. Deionized (DI) water was purified by using a Millipore Milli-Q system (USA). Stock standard solutions of BHA, BHT, and BPA were prepared in methanol to obtain a final concentration of 100 μg mL−1 and lower concentrations of standard solutions were diluted with appropriate volumes of methanol and stored at −20 °C until used.2.2 Gas chromatography-flame ionization detection (GC-FID) condition
The gas chromatographic analysis was performed using the Hewlett Packard HP 5890 Series II gas chromatograph equipped with a splitless injector system and FID. The analytes were separated in a MEGA-1 capillary column (100% polydimethylsiloxane, 30 m × 0.25 mm × 0.25 μm i.d.). Helium was the carrier gas and nitrogen the make-up gas; flowed at 1 mL min−1 and 25 mL min−1, respectively. The oven temperature was programmed at an initial temperature of 150 °C, held for 2 min, then ramped up to 250 °C at a rate of 10 °C min−1 and held at 250 °C for 5 min. The FID temperature was maintained at 250 °C. Hydrogen gas and air for FID were flowed at 40 mL min−1 and 200 mL min−1, respectively.2.3 Characterization
The surface morphology and elemental analysis of the synthesized adsorbent were examined using field emission scanning electron microscopy (FE-SEM) coupled with energy-dispersive X-ray (EDX) spectrometry (Talos F200i, Thermo Scientific, Czech Republic). The functional groups of the adsorbent and associated materials were investigated by using Fourier transform infrared spectroscopy (FTIR) (Nicolet iS5, Thermo Scientific, USA). The Brunauer–Emmett–Teller (BET) surface area and pore size distribution of the adsorbent were investigated by using a surface area and micropore analyzer (ASAP2060, Micromeritics, USA). X-ray diffraction (XRD) analysis (PANalytical Empyrean, the Netherlands) was used to investigate the atomic and molecular structures of the adsorbent and associated materials.2.4 Synthesis of magnetite particles (Fe3O4)
Magnetite particles were synthesized according to a previously reported method.19 In brief, 1.62 g of FeCl3·6H2O and 0.85 g of FeSO4·7H2O were dissolved in 120 mL of DI water, followed by adjustment to pH 10–11 with NH3. The solution was heated at 60 °C for 2 h and allowed to cool to room temperature. The obtained synthesized magnetite was washed with DI water until the runoff was neutral, dried at 70 °C for 4 h, and then ground by mortar and pestle. The magnetite powder was kept in a desiccator.2.5 Preparation of magnetite C18/paracetamol/alginate bead
The magnetite C18/paracetamol/alginate bead (mC18/Pa/Alg) was prepared as follows. SA was mixed under stirring with 25 mL of DI water at 80 °C for 12 min to obtain a final concentration of 0.8% (w/v). To the homogeneous SA solution, 1.2 g of C18 and 0.5 g of CaCO3 were added under stirring until the solids were well dispersed, giving a cloudy mixture. Then, 0.05 g of Fe3O4 was added and the mixture was ultrasonicated for 20 min, giving a dark brown precipitate mixed with white solids of C18. The mixture was added dropwise into a 10% (w/v) solution of CaCl2 to form cross-linked water-insoluble composite mC18/Alg beads that were left in the CaCl2 solution for 2 h to complete crosslinking. The mC18/Alg bead was then soaked in 20% HCl in about 5 s to generate bubbles of carbon dioxide inside the bead that created a network of pores and taken out by using dispensing spoons. Subsequently, the mC18/Alg beads were washed several times with DI water to remove excess HCl and unbound CaCl2. The washed beads were collected and incubated in 10 mM of Pa solution for 2 h. After the Pa solution was discarded, the synthesized mC18/Pa/Alg beads were used to extract water samples. It can be mentioned that when using HCl for synthesis, most Fe3O4 particles remain in the beads, which the beads can be separated from the water by external magnet (Fig. S1†).2.6 Magnetic solid phase extraction with mC18/Pa/Alg bead
The MSPE procedure is illustrated in Fig. 1. An adsorbent dose of 0.3 g of mC18/Pa/Alg beads was placed in 3 mL of sample solution and shaken for 30 min to allow the adsorption of analytes (extraction). The composite bead was separated from the solution with an external magnet. The adsorbed analyte was eluted with sonication for 10 min in 2 mL of methanol (desorption). Finally, the eluant was filtered with a 0.22 μm nylon membrane filter and 5 μL of the filtered solution were injected into the GC-FID for analysis.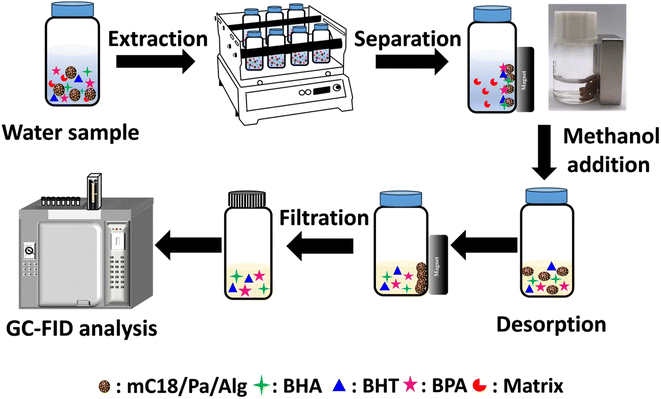 | ||
| Fig. 1 Magnetic solid phase extraction of butylated hydroxyanisole (BHA), butylated hydroxytoluene (BHT), and bisphenol A (BPA) with the proposed mC18/Pa/Alg bead. | ||
2.7 Preparation of real water samples
Two different types of water samples were analyzed: bottled water from local market and water from a stream in Ron Phibun District, Nakhon Si Thammarat Province (location at 47P 593![[thin space (1/6-em)]](https://www.rsc.org/images/entities/char_2009.gif) 171 E 904
171 E 904![[thin space (1/6-em)]](https://www.rsc.org/images/entities/char_2009.gif) 789 N and 47P 595
789 N and 47P 595![[thin space (1/6-em)]](https://www.rsc.org/images/entities/char_2009.gif) 701 E 908
701 E 908![[thin space (1/6-em)]](https://www.rsc.org/images/entities/char_2009.gif) 326 N). Samples were transported to the laboratory, stored at 4 °C until used, and filtered with a Whatman No. 4 filter paper before extraction.
326 N). Samples were transported to the laboratory, stored at 4 °C until used, and filtered with a Whatman No. 4 filter paper before extraction.
3 Results and discussion
3.1 Characterization of mC18/Pa/Alg bead
The synthesized mC18/Pa/Alg bead was characterized by FE-SEM, EDX, XRD, FTIR and BET techniques. The FE-SEM image in Fig. 2A shows a calcium alginate bead with a smooth, regular spherical surface and a diameter of 1.26 ± 0.04 mm. Fig. 2B–D show the mC18/Pa/Alg bead at various magnifications. The mC18/Pa/Alg is porous and spherical but has a larger diameter of 1.75 ± 0.06 mm. Moreover, the synthesized bead is rougher with evenly distributed clusters of Fe3O4 and C18 particles embedded in the calcium alginate and Pa matrices. The white particles scattered on the outer surface of the bead are possibly C18 particles and Pa. To demonstrate the modification of Pa, the bead without Pa (mC18/Alg) was prepared and compared with mC18/Pa/Alg. Fig. S2† shows the FE-SEM images of mC18/Alg and mC18/Pa/Alg. The mC18/Alg beads are spherical with a similar diameter of 1.69 ± 0.07 mm but the surface of mC18/Alg is smoother than mC18/Pa/Alg with lesser, white-colored distribution belonged to C18.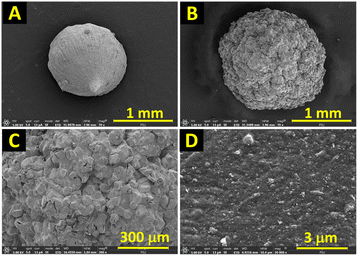 | ||
Fig. 2 FE-SEM images show (A) a calcium alginate bead at 70× magnification, and (B–D) the mC18/Pa/Alg bead at 70×, 200×, and 200![[thin space (1/6-em)]](https://www.rsc.org/images/entities/char_2009.gif) 00× magnifications, respectively. 00× magnifications, respectively. | ||
The EDX analysis of the mC18/Pa/Alg bead identified six peaks of oxygen (O), carbon (C), silicon (Si), calcium (Ca), iron (Fe), and chlorine (Cl). These elements were present at atomic ratios of 36.0, 32.9, 19.9, 4.9, 4.1 and 2.2%, respectively (Fig. 3A). The EDX patterns confirmed the distribution of Fe3O4 (Fe and O), C18 (C and Si) and calcium alginate (C and Ca) on the surface of the bead. Peaks of C and O belonging to Pa were observed but not a peak of N, possibly because the total concentration of N was much lower than that of C and O, and limited detection. The high atomic ratio of oxygen indicated the abundance of oxygen-containing functional groups on the surface of the bead that might facilitate the adsorption of BHA, BHT and BPA.20 Meanwhile, EDX mapping confirmed the existence of characteristic elements which were consistent with the EDX spectrum of the bead. These results demonstrated the incorporation of Fe3O4, C18 and Pa into the calcium alginate matrix.
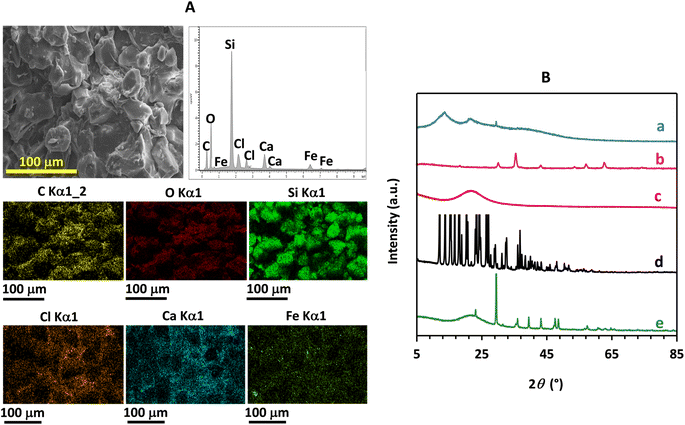 | ||
| Fig. 3 (A) EDX spectrum and EDX mapping of the mC18/Pa/Alg bead. (B) XRD patterns of (a) pure SA, (b) Fe3O4, (c) commercial C18, (d) paracetamol tablet and (e) the synthesized mC18/Pa/Alg bead. | ||
The XRD analysis of SA, Fe3O4, C18, Pa and the mC18/Pa/Alg bead showed that SA had a semi-crystalline structure with peaks at 13.6, 21.6 and 39.4° 2θ (Fig. 3B(a)) that indicated the (110) plane of the polyguluronate unit, the (200) plane of polymannuronate and the amorphous halo of SA.21
Fe3O4 produced five distinctive peaks at 2θ = 30.2°, 35.6°, 43.3°, 57.2° and 62.8° (Fig. 3B(b)), indexed to the (220), (311), (400), (511), and (440) planes of Fe3O4, respectively (ICDD No. 01-084-2782). The amorphous C18 produced a broad diffraction peak at 21.6° 2θ (Fig. 3B(c)). Paracetamol tablet (Fig. 3B(d)) produced peaks at 12.1°, 13.8°, 15.5°, 16.8°, 18.2°, 20.4°, 23.5°, 24.4°, 26.6° and 27.2° 2θ, corresponding to the (011), (−101), (101), (−111), (111), (021), (−121), (022), (−122) and (−211) planes, respectively (ICDD No. 00-065-1376). In the diffraction pattern of the mC18/Pa/Alg bead (Fig. 3B(e)), dominant peaks of C18 and Fe3O4 were observed, evidencing their incorporation into the alginate matrix. The intensity of the peaks present in the pattern of SA were clearly weakened in the spectrum of the mC18/Pa/Alg bead. The broad peaks of C18 between about 15° and 25° 2θ were also significantly reduced, and most peaks of Pa were no longer present in the bead. These results confirm the successful synthesis of mC18/Pa/Alg bead and agree well with the FE-SEM and EDX results.
The FTIR spectrum of SA (Fig. 4a) shows a broad peak of O–H stretching vibration at 3360 cm−1, peaks of asymmetric and symmetric stretching vibrations of the carboxylate groups (–COO−) at 1604 cm−1 and 1406 cm−1, respectively, and a peak of C–O–C stretching vibration at 1026 cm−1.22 Peaks at 926 and 872 cm−1 correspond to the stretching vibration of Na–O.23 The characteristic band of Fe3O4 (Fig. 4b) at 545 cm−1 confirms the Fe–O bond in Fe3O4.24 Two peaks of C18 (Fig. 4c) at 2919 and 2848 cm−1 are assigned to C–H stretching vibrations and the dominant peak at 1056 cm−1 is attributed to the O–Si–O bond of C18.25 The FTIR spectrum of Pa (Fig. 4d) shows characteristic peaks at 3400–3200 cm−1, 3160–3020 cm−1, 3000–2840 cm−1 and 1649 cm−1 that respectively indicate the combined O–H stretching of the phenol group and N–H stretching of the amide group, the C(sp2)–H stretching of the aromatic C–H group, the C(sp3)–H stretching of the methyl (CH3) group, and the C![[double bond, length as m-dash]](https://www.rsc.org/images/entities/char_e001.gif) O stretching of the amide I group.26 The C–N–C
O stretching of the amide I group.26 The C–N–C![[double bond, length as m-dash]](https://www.rsc.org/images/entities/char_e001.gif) O stretching of the amide II group is indicated at 1502 cm−1. The peaks between 1620 and 1460 cm−1 are attributed to the C
O stretching of the amide II group is indicated at 1502 cm−1. The peaks between 1620 and 1460 cm−1 are attributed to the C![[double bond, length as m-dash]](https://www.rsc.org/images/entities/char_e001.gif) C stretching of aromatic groups. Furthermore, peaks at 1270–1120 cm−1 indicate the C–O stretching of the phenol group.26
C stretching of aromatic groups. Furthermore, peaks at 1270–1120 cm−1 indicate the C–O stretching of the phenol group.26
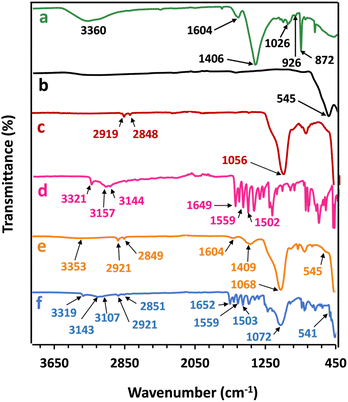 | ||
| Fig. 4 FTIR spectra of (a) pure SA, (b) Fe3O4, (c) commercial C18, (d) paracetamol tablet, (e) the mC18/Alg bead (without Pa) and (f) the synthesized mC18/Pa/Alg bead. | ||
FTIR spectra of mC18/Alg (without Pa) and mC18/Pa/Alg are shown in Fig. 4e and f, respectively. Peaks of SA, Fe3O4 and C18 were found in both beads but only the mC18/Pa/Alg beads contained characteristic peaks of Pa. This result indicated that Pa was already modified in the mC18/Pa/Alg. The spectrum of the mC18/Pa/Alg bead demonstrates shifts of peaks and reduced peak intensities of pure materials after synthesis. For example, the –COO− peak in SA at 1604 cm−1 disappeared in the mC18/Pa/Alg spectrum, possibly attributing to the ionic bond formed between Ca2+ and –COO− of SA.22 The –CH stretching peaks in C18 at 2919 and 2848 cm−1 were shifted to 2921 and 2851 cm−1, respectively. The peak at 545 cm−1 of Fe–O in Fe3O4 was shifted to 541 cm−1 while most peaks found in pure Pa were decreased in the mC18/Pa/Alg bead.
These results demonstrated the deposition of Fe3O4 and C18 into the bead framework and the interactions between Pa, C18 and alginate and confirmed the successful synthesis of the bead. The results of FE-SEM, EDX, XRD and FTIR all attested to the successful preparation of the mC18/Pa/Alg bead for efficient extraction of BHA, BHT and BPA.
The surface area, pore volume, and pore size distribution of the mC18/Pa/Alg bead were determined by nitrogen adsorption–desorption analysis. Fig. 5 reveals the nitrogen adsorption–desorption isotherms and the corresponding BJH pore-−size distribution curves. The mC18/Pa/Alg bead produced a type IV isotherm, according to the IUPAC classification, with an H3 hysteresis loop. The BET surface area of the mC18/Pa/Alg bead was 153.11 m2 g−1, notably higher than other reported alginate beads (2.16–32.20 m2 g−1).17,27,28 This difference could be due to the synthesis process and precursor applied. The BJH pore volume of 0.29 cm3 g−1 and average pore diameter of 7.69 nm confirmed that the bead obtained in this work was of the mesoporous class (2 nm < pore size < 50 nm).29
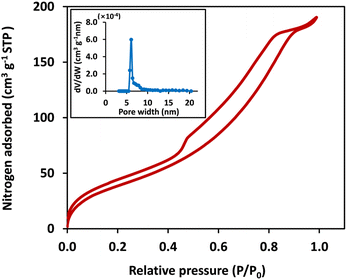 | ||
| Fig. 5 Nitrogen adsorption–desorption isotherm and pore size distribution (inset) of mC18/Pa/Alg bead. | ||
3.2 Proposed adsorption interactions
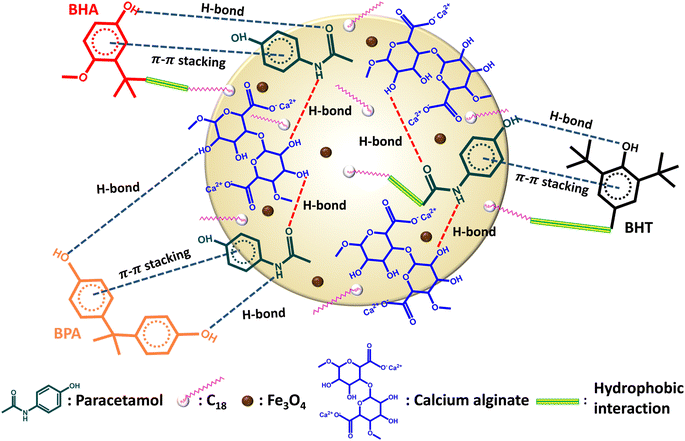
SA is a biodegradable and hydrophilic material with several –OH groups while C18 is non-biodegradable and hydrophobic. Pa contains an aromatic ring, and C![[double bond, length as m-dash]](https://www.rsc.org/images/entities/char_e001.gif) O, –OH and –NH groups. These materials were combined to create a composite mC18/Pa/Alg bead with high dispersibility and minimal degradation of alginate. As seen in Fig. 6, Pa is fixed in the bead through the non-covalent bonds with alginate and C18. Hydrogen bonding between C
O, –OH and –NH groups. These materials were combined to create a composite mC18/Pa/Alg bead with high dispersibility and minimal degradation of alginate. As seen in Fig. 6, Pa is fixed in the bead through the non-covalent bonds with alginate and C18. Hydrogen bonding between C![[double bond, length as m-dash]](https://www.rsc.org/images/entities/char_e001.gif) O, –OH and –NH groups of Pa and C
O, –OH and –NH groups of Pa and C![[double bond, length as m-dash]](https://www.rsc.org/images/entities/char_e001.gif) O and –OH groups of alginates and hydrophobic interactions between –CH3 group of Pa and C18 are the main interactions in the bead. Magnetite particles, calcium ions (Ca2+) and C18 are entrapped in the composite. The C18 has hydrophobic functional groups, thus there is hydrophobic interaction between the analytes and C18. This interaction also enhances the extraction efficiency of the mC18/Pa/Alg. The composite provides many active sites and pores which facilitates the adsorption of BHT, BHA and BPA. BHT, BHA and BPA molecules have aromatic rings, –OH groups and hydrophobic groups, adsorption interactions can take place through hydrogen bonding, π–π stacking and hydrophobic interaction. Thus, the extraction and preconcentration of studied analytes are increased by these interactions in the MSPE process.
O and –OH groups of alginates and hydrophobic interactions between –CH3 group of Pa and C18 are the main interactions in the bead. Magnetite particles, calcium ions (Ca2+) and C18 are entrapped in the composite. The C18 has hydrophobic functional groups, thus there is hydrophobic interaction between the analytes and C18. This interaction also enhances the extraction efficiency of the mC18/Pa/Alg. The composite provides many active sites and pores which facilitates the adsorption of BHT, BHA and BPA. BHT, BHA and BPA molecules have aromatic rings, –OH groups and hydrophobic groups, adsorption interactions can take place through hydrogen bonding, π–π stacking and hydrophobic interaction. Thus, the extraction and preconcentration of studied analytes are increased by these interactions in the MSPE process.
3.3 Optimization of parameters for MSPE process based on mC18/Pa/Alg bead
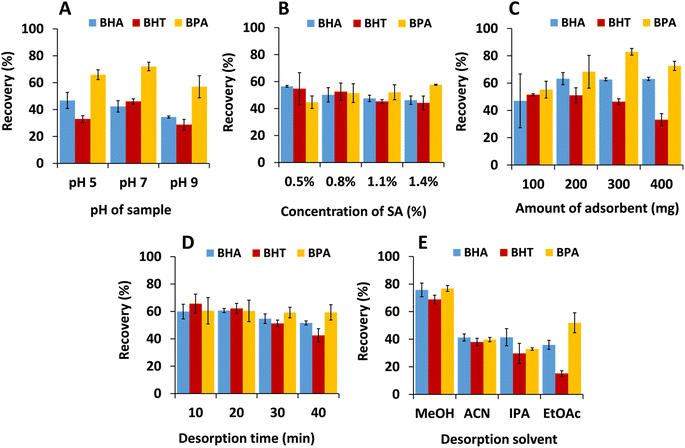
Several extraction conditions for MSPE with the mC18/Pa/Alg bead were studied to achieve the best extraction efficiency. The optimization study considered the pH of the sample solution, the concentration of sodium alginate used to prepare the bead, the adsorbent dose, desorption time, and desorption solvent (Fig. 7). Percentage extraction recovery (Recovery, %) as an analytical response was calculated based on the following equation:| Recovery (%) = [(Cdes × Vdes)/(Caq × Vaq)] × 100 |
Pa is necessary for the preparation of the novel mC18/Pa/Alg since it can significantly enhance the extraction efficiency of BHT, BHA and BPA when compared to the beads without Pa (mC18/Alg) from ∼10% for mC18/Alg to more than 40% for mC18/Pa/Alg. The extraction recoveries of mC18/Alg bead mC18/Pa/Alg bead were compared as shown in Fig. S3.† The active functional groups, i.e. C![[double bond, length as m-dash]](https://www.rsc.org/images/entities/char_e001.gif) O, –OH and –NH groups of Pa can be loaded on the surface of the beads which facilitate the adsorption of the analytes via hydrogen bonding and π–π interactions, thus resulting in significant increase of extraction efficiency for studied analytes by the mC18/Pa/Alg. It is noted that Pa does not help separation but can provide more active sites (C
O, –OH and –NH groups of Pa can be loaded on the surface of the beads which facilitate the adsorption of the analytes via hydrogen bonding and π–π interactions, thus resulting in significant increase of extraction efficiency for studied analytes by the mC18/Pa/Alg. It is noted that Pa does not help separation but can provide more active sites (C![[double bond, length as m-dash]](https://www.rsc.org/images/entities/char_e001.gif) O, –OH and –NH groups) to adsorb BHT, BHA and BPA. We use GC-FID technique for separation of all analytes.
O, –OH and –NH groups) to adsorb BHT, BHA and BPA. We use GC-FID technique for separation of all analytes.
The pH of the sample solution is a crucial factor affecting extraction. Sample solution pH was tested at 5, 7 and 9, adjusted with 0.1 M of HCl or 0.1 M of NaOH (Fig. 7A). The recoveries of BHA, BHT and BPA increased from pH 5 to 7 and decreased sharply at pH 9. In the acidic condition (pH 5), the ionization constant of the sample solution was much lower than the ionization constant of BHA (pKa = 11.8), BHT (pKa = 12.7) and BPA (pKa = 10.3). Therefore, the mC18/Pa/Alg bead could not easily adsorb the protonated analytes because hydrogen bonding between analytes and bead was reduced. Additionally, excess H+ ions in the solution could combine with COO− and compete with the analytes for adsorption on the surface sites of the bead,17 and extraction recoveries decreased. In the basic condition (pH 9), more OH− was available to disrupt adsorption, and since this pH is close to the pKa of the analytes, neutral analytes could start deprotonating to anions. At that point, electrostatic repulsion could occur between analyte anions and oxygen-containing functional groups of beads,30 and recoveries decreased. The results indicated that pH 7 was the most suitable condition for extracting the target analytes and the MSPE process did not require the pH adjustment of sample solutions.
The concentration of SA may affect the formation of the hydrogel structure and stability in calcium chloride solutions.23 The concentration of SA was investigated at 0.5, 0.8, 1.1, and 1.4% (Fig. 7B). Extraction recoveries were better with beads prepared at concentrations of 0.8–1.4% but were similar for BHA and BHT. In addition, when preparing the bead in HCl, we noticed that fewer gas bubbles were formed at 0.5% SA and assumed that this bead was less porous than the beads prepared with higher concentrations. As a result, 0.8% SA was chosen as the appropriate concentration for preparing the bead.
To improve recoveries and ensure the efficient extraction of analytes, the mC18/Pa/Alg bead dosage was varied from 100 to 400 mg (Fig. 7C). Recoveries increased from 100 to 300 mg due to the increase in the number of adsorption sites. At 400 mg, recoveries were reduced, possibly due to incomplete desorption of the analytes in the fixed volume (2 mL) of elution solvent. Thus, 300 mg was selected for further study.
It was noted that ultrasonication is suitable for reversible adsorption applications.31 Thus, after extracting BHA, BHT and BPA, desorption was employed with ultrasonication to obtain sufficient desorption of analytes from the bead and speed up the MSPE process. Desorption intervals of 10, 20, 30, and 40 min (Fig. 7D) were studied. Results indicated that recoveries of all analytes reached a plateau within 20 min and reduced thereafter for BHA and BHT, possibly due to reduced desorption activation energy. A similar result was observed in the work of Xu et al.32 Therefore, 10 min was chosen as the optimum desorption time.
Water-miscible organic solvents were investigated as desorption solvents for BHA, BHT and BPA. The solvents included methanol (relative polarity 0.76), acetonitrile (0.46), isopropanol (0.55) and ethyl acetate (0.23). The highest recovery, and therefore enrichment, of analytes from the mC18/Pa/Alg bead was obtained by eluting the analytes with methanol (Fig. 7E), which was selected as the eluent in further studies.
3.4 Validation of the method
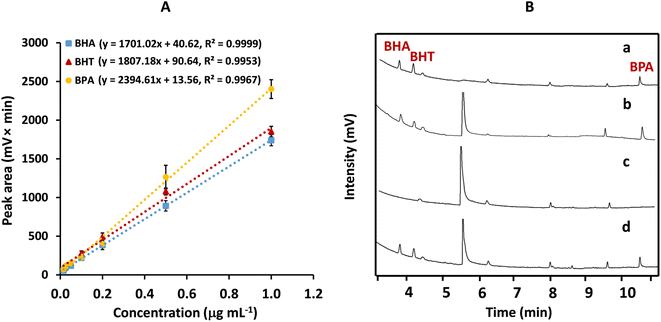
The analytical features of MSPE with the mC18/Pa/Alg bead and analysis by GC-FID were evaluated in the optimized condition. Concentrations of BHA, BHT, and BPA were prepared in the range of 0.015–1.00 μg mL−1. To quantify the analyte concentration in real samples, the calibration curve of each analyte was plotted between peak area (mV × min) and analyte concentration (μg mL−1) (Fig. 8A). The plots were linear. The regression equations were y = 1701.02x + 40.62, R2 = 0.9999 for BHA, y = 1807.18x + 90.64, R2 = 0.9953 for BHT, and y = 2394.61x + 13.56, R2 = 0.9967 for BPA. The limits of detection (LOD) and quantification (LOQ) were calculated from (3 × SD)/m and (10 × SD)/m, respectively, where SD is the standard deviation of the blank solution (n = 8) and m is the slope of the calibration curve. The LODs of BHA, BHT and BPA were 9.66, 9.09 and 6.86 ng mL−1, respectively. The LOQs were 32.20 ng mL−1 for BHA, 30.31 ng mL−1 for BHT and 22.87 ng mL−1 for BPA.The precision of the method was reported as relative standard deviations (RSDs), evaluated by testing 0.2 and 0.5 μg mL−1 of each analyte on the same day (n = 5) for intraday precision and on three different days (n = 9 for each day) for interday precision. The RSDs for intraday and interday precision ranged from 0.4% to 3.3%, and 2.3% to 4.3%, respectively. These values are within the 6 to 8% range recommended by the AOAC standard.33
The selectivity of the mC18/Pa/Alg was investigated by MSPE coupled with GC-FID analysis. Some competitive aromatic compounds, i.e. phenol, benzoic acid, methylparaben and diisobutyl phthalate were tested along with the target analytes. Chemical structures of competitive aromatic compounds are shown in Fig. S4.† Individual compound (10 μg mL−1) was separately spiked in 3 mL of deionized water and the spiked water samples were extracted by the proposed MSPE method. After desorption with methanol, the desorbed concentrations of these compounds were determined by GC-FID. As demonstrated in Fig. S5,† recoveries of BHA, BHT and BPA was much higher than those of diisobutyl phthalate and methylparaben. Unfortunately, no phenol and benzoic acid can be detected possibly due to the unsuitable GC-FID condition used in this work. This result confirmed the excellent selectivity of mC18/Pa/Alg for BHA, BHT and BPA towards competitive compounds.
For reusability test of the beads, the mC18/Pa/Alg after MSPE was washed by ultrasonication with 2 mL of methanol for 10 min twice before it was utilized for the next extraction cycle. Fig. S6† presents the recovery (%) of mC18/Pa/Alg after four cycles of adsorption and desorption by MSPE. The extraction recovery of BHA, BHT and BPA slightly reduced with increasing regeneration cycles from 108.0% to 85.0%, 77.0% to 64.2% and 99.7 to 95.0, respectively. However, the loss in adsorption–desorption step of the mC18/Pa/Alg was just about 5–23% and no carry-over of the analytes was observed in the GC-FID chromatograms after MSPE step. Thus, it suggested that the mC18/Pa/Alg is stable and can be reused at least four times for MSPE without a significant decrease of the adsorption capacities of analytes.
The adsorption capacity was conducted as described in the ESI.† It was found that the adsorption capacity for target analytes was lower (0.006–0.008 mg g−1) than C18 used in conventional SPE. This is a disadvantage of the beads. The C18 is used only once but our bead has good reusability at least 4 times. It can be noted that the capacity values are sufficient for extraction of low working concentration range of studied analytes in real samples. Thus, the mC18/Pa/Alg beads may be used as potential MSPE adsorbent for BHA, BHT and BPA.
3.5 Determination of BHA, BHT and BPA in water samples
To prove the applicability of MSPE with the proposed mC18/Pa/Alg bead coupled with GC-FID analysis, two sets of samples were tested for the simultaneous determination of BHA, BHT and BPA: stream water and bottled water (Table 1). GC-FID chromatograms of a standard mixture, and un-spiked and spiked stream water samples are presented in Fig. 8B. BHA, BHT, and BPA were not detected in any samples. Four peaks between BHT and BPA were observed in chromatograms. They originated from methanol (as blank standard) and beads as shown in Fig. S7.† Methanol is used to prepare standard solution and used as a desorption solvent. We found three peaks in methanol. Un-spiked synthetic water using DI water (as blank extract) and spiked synthetic water (spiked with a 0.5 μg mL−1 standard mixture) were prepared and extracted by MSPE using mC18/Pa/Alg beads. After MSPE, the high peak was found in both un-spiked extract (as blank extract) and spiked extract, indicating that it was from the beads.| Sample | Spiked (μg mL−1) | Mean concentration ± SD (μg mL−1) (n = 3) | Mean recovery ± RSD (%) (n = 3) | ||||
|---|---|---|---|---|---|---|---|
| BHA | BHT | BPA | BHA | BHT | BPA | ||
| a ND = not detected. SD = standard deviation. | |||||||
| Stream | 0.00 | ND | ND | ND | — | — | — |
| Water 1 | 0.20 | 0.182 ± 0.003 | 0.168 ± 0.002 | 0.172 ± 0.001 | 90.91 ± 1.86 | 84.13 ± 1.16 | 86.01 ± 0.30 |
| 0.50 | 0.432 ± 0.011 | 0.416 ± 0.002 | 0.401 ± 0.017 | 86.49 ± 2.65 | 83.25 ± 0.49 | 80.28 ± 4.22 | |
| Stream | 0.00 | ND | ND | ND | — | — | — |
| Water 2 | 0.20 | 0.200 ± 0.002 | 0.173 ± 0.000 | 0.176 ± 0.004 | 100.09 ± 0.79 | 86.42 ± 0.25 | 87.76 ± 2.05 |
| 0.50 | 0.482 ± 0.018 | 0.424 ± 0.007 | 0.500 ± 0.020 | 96.35 ± 3.74 | 84.86 ± 1.54 | 100.00 ± 4.03 | |
| Bottled | 0.00 | ND | ND | ND | — | — | — |
| Water | 0.20 | 0.191 ± 0.002 | 0.180 ± 0.001 | 0.168 ± 0.001 | 95.38 ± 0.93 | 89.96 ± 0.60 | 83.98 ± 0.58 |
| 0.50 | 0.464 ± 0.012 | 0.409 ± 0.008 | 0.460 ± 0.017 | 92.84 ± 2.58 | 81.71 ± 2.01 | 92.06 ± 3.76 | |
The reliability of the developed method was evaluated. A recovery study was performed by spiking water samples with 0.2 and 0.5 μg mL−1 of each standard (Table 1). Recoveries were in the range of 80.28–100.09% with RSDs of 0.30–4.22%, confirming the efficient extraction and determination of BHA, BHT and BPA based on the proposed method.
4 Conclusions
A magnetic adsorbent bead was successfully prepared from sodium alginate and paracetamol embedded with C18 and Fe3O4 (mC18/Pa/Alg). The bead was applied to extract butylated hydroxytoluene, butylated hydroxyanisole, and bisphenol A from aqueous samples using magnetic solid phase extraction. Field emission scanning electron microscopy showed a rough and spherical bead with a diameter of 1.75 ± 0.06 mm. Magnetic solid phase extraction with the mC18/Pa/Alg bead achieved high extraction efficiency and enrichment via hydrogen bonding, π–π stacking and hydrophobic interactions with the targeted analytes. Furthermore, under the optimal conditions, the developed method produced low limits of detection (6.86–9.66 ng mL−1), good recoveries (over 80.2%) and precision (lower than 4.4%). The proposed synthesis method is simple but the magnetic solid phase extraction of antioxidants and BPA from water samples with the mC18/Pa/Alg bead can compete with alternative approaches such as dispersive liquid–liquid microextraction and solid-phase extraction.Data availability
The data supporting this article have been included as part of the ESI.†Author contributions
Nurma Sulaiman: formal analysis, investigation, visualization, writing – original draft. Nuryanee Hama: visualization, writing – review & editing. Saowanit Saithong: visualization, writing – review & editing. Thitima Rujiralai: conceptualization, formal analysis, investigation, project administration, validation, visualization, writing – review & editing.Conflicts of interest
There are no conflicts to declare.Acknowledgements
Miss Nurma Sulaiman was supported by a Graduate Fellowship (Research Assistant) from the Faculty of Science, Prince of Songkla University, Contract number 1-2565-02-003. We gratefully acknowledge the Division of Physical Science and Center of Excellence for Innovation in Chemistry (PERCH-CIC), Ministry of Higher Education, Science, Research and Innovation, Faculty of Science, Prince of Songkla University. We thank Mr Thomas Duncan Coyne for English editing.References
- Z. H. Deng, N. Li, H. L. Jiang, J. M. Lin and R. S. Zhao, Pretreatment techniques and analytical methods for phenolic endocrine disrupting chemicals in food and environmental samples, TrAC, Trends Anal. Chem., 2019, 119, 115592, DOI:10.1016/j.trac.2019.07.003.
- R. Rodil, J. B. Quintana, G. Basaglia, M. C. Pietrogrande and R. Cela, Determination of synthetic phenolic antioxidants and their metabolites in water samples by downscaled solid-phase extraction, silylation and gas chromatography-mass spectrometry, J. Chromatogr. A, 2010, 1217, 6428–6435, DOI:10.1016/j.chroma.2010.08.020.
- United Nations Environment Programme, https://wedocs.unep.org/bitstream/handle/20.500.11822/25633/EDC_report1.pdf?sequence=1%26isAllowed=y, accessed February 2024.
- K. L. Ng, G. H. Tan and S. M. Khor, Graphite nanocomposites sensor for multiplex detection of antioxidants in food, Food Chem., 2017, 237, 912–920, DOI:10.1016/j.foodchem.2017.06.029.
- National Standard of the People’s Republic of China, GB 5749-2006 Standards for Drinking Water Quality, 2006 Search PubMed.
- A. Karrat and A. Amine, Solid-phase extraction combined with a spectrophotometric method for determination of Bisphenol-A in water samples using magnetic molecularly imprinted polymer, Microchem. J., 2021, 168, 106496, DOI:10.1016/j.microc.2021.106496.
- L. Lian, X. Jiang, J. Guan, Z. Qiu, X. Wang and D. Lou, Dispersive solid-phase extraction of bisphenols migrated from plastic food packaging materials with cetyltrimethylammonium bromide-intercalated zinc oxide, J. Chromatogr. A, 2020, 1612, 460666, DOI:10.1016/j.chroma.2019.460666.
- B. O. Johnson, F. M. Burke, R. Harrison and S. Burdette, Quantitative analysis of bisphenol A leached from household plastics by solid-phase microextraction and gas chromatography-mass spectrometry (SPME-GC-MS), J. Chem. Educ., 2012, 89, 1555–1560, DOI:10.1021/ed2003884.
- D. Battal, A. A. Sukuroglu, K. Kocadal, I. Cok and I. Unlusayin, Establishment of rapid, sensitive, and quantitative liquid chromatography-electrospray ionization-tandem mass spectrometry method coupled with liquid-liquid extraction for measurement of urinary bisphenol A, 4-t-octylphenol, and 4-nonylphenol, Rapid Commun. Mass Spectrom., 2021, 35, e9084, DOI:10.1002/rcm.9084.
- T. Rujiralai, S. Kaewsara, L. Chuenchom, P. Jitpirom and S. Kaowphong, Facile and environmentally friendly magnetic mesoporous carbon for the selective extraction of antioxidants from water, Anal. Methods, 2019, 11, 4204–4210, 10.1039/C9AY00819E.
- X. Guo, Y. Huang, W. Yu, X. Yu, X. Han and H. Zhai, Multi-walled carbon nanotubes modified with iron oxide and manganese dioxide (MWCNTs-Fe3O4-MnO2) as a novel adsorbent for the determination of BPA, Microchem. J., 2020, 157, 104867, DOI:10.1016/j.microc.2020.104867.
- R. V. M. Oliveira, A. F. Santos, M. D. L. Santos, G. D. C. Cunha and L. P. C. Romão, Magnetic solid-phase extraction of bisphenol a from water samples using nanostructured material based on graphene with few layers and cobalt ferrite, Microchem. J., 2022, 181, 107741, DOI:10.1016/j.microc.2022.107741.
- M. A. Farajzadeh, S. Pezhhanfar and A. Mohebbi, Development of a dispersive solid phase extraction procedure using a natural adsorbent as an efficient and costless sorbent followed by dispersive liquid-liquid microextraction, Int. J. Environ. Anal., 2021, 101, 1499–1512, DOI:10.1080/03067319.2019.1685667.
- W. Zhu, P. Jin, H. Yang, F. Li, C. Wang, T. Li and J. Fan, A green extraction strategy for the detection of antioxidants in food simulants and beverages migrated from plastic packaging materials, Food Chem., 2023, 406, 135060, DOI:10.1016/j.foodchem.2022.135060.
- M. Šafaříková and I. Šafařík, Magnetic solid-phase extraction, J. Magn. Magn. Mater., 1999, 194, 108–112, DOI:10.1016/S0304-8853(98)00566-6.
- O. Icten and D. Ozer, Magnetite doped metal-organic framework nanocomposites: an efficient adsorbent for removal of bisphenol-A pollutant, New J. Chem., 2021, 45, 2157–2166, 10.1039/D0NJ05622G.
- N. S. Fuzil, N. H. Othman, N. A. S. R. A. Jamal, A. N. Mustapa, N. H. Alias, A. Dollah, N. R. N. Him and F. Marpani, Bisphenol A adsorption from aqueous solution using graphene oxide-alginate beads, J. Polym. Environ., 2022, 30, 597–612, DOI:10.1007/s10924-021-02226-y.
- I. C. Wang, M. J. Lee, D. Y. Seo, H. E. Lee, Y. Choi, W. S. Kim, C. S. Kim, M. Y. Jeong and G. Choi, Polymorph transformation in paracetamol monitored by in-line NIR spectroscopy during a cooling crystallization process, AAPS PharmSciTech, 2011, 12, 764–770, DOI:10.1208/s12249-011-9642-x.
- P. Thongprapai, W. Cheewasedtham, K. F. Chong and T. Rujiralai, Selective magnetic nanographene oxide solid-phase extraction with high-performance liquid chromatography and fluorescence detection for the determination of zearalenone in corn samples, J. Sep. Sci., 2018, 41, 4348–4354, DOI:10.1002/jssc.201800441.
- M. W. Shih, C. J. M. Chin and Y. L. Yu, The role of oxygen-containing groups on the adsorption of bisphenol-A on multi-walled carbon nanotube modified by HNO3 and KOH, Process Saf. Environ. Prot., 2017, 112, 308–314, DOI:10.1016/j.psep.2017.04.033.
- J. Fabia, Cz. Ślusarczyk, A. Gawłowski, T. Graczyk, A. Włochowicz and J. Janicki, Supermolecular structure of alginate fibres for medical applications studied by means of WAXS and SAXS methods, Fibres Text. East. Eur., 2005, 13, 114–117 CAS.
- S. Hua, H. Ma, X. Li, H. Yang and A. Wang, pH-sensitive sodium alginate/poly(vinyl alcohol) hydrogel beads prepared by combined Ca2+ crosslinking and freeze-thawing cycles for controlled release of diclofenac sodium, Int. J. Biol. Macromol., 2010, 46, 517–523, DOI:10.1016/j.ijbiomac.2010.03.004.
- B. E. Channab, M. El Ouardi, S. E. Marrane, O. A. Layachi, A. El Idrissi, S. Farsad, D. Mazkad, A. BaQais, M. Lasri and H. A. Ahsaine, Alginate@ZnCO2O4 for efficient peroxymonosulfate activation towards effective rhodamine B degradation: optimization using response surface methodology, RSC Adv., 2023, 13, 20150–20163, 10.1039/D3RA02865H.
- S. Asadi, S. Eris and S. Azizian, Alginate-based hydrogel beads as a biocompatible and efficient adsorbent for dye removal from aqueous solutions, ACS Omega, 2018, 3, 15140–15148, DOI:10.1021/acsomega.8b02498.
- X. Zhang, T. Zeng, S. Wang, H. Niu, Xi. Wang and Y. Cai, One-pot synthesis of C18-functionalized core-shell magnetic mesoporous silica composite as efficient sorbent for organic dye, J. Colloid Interface Sci., 2015, 448, 189–196, DOI:10.1016/j.jcis.2015.02.029.
- F. Zapata, A. López-Fernández, F. Ortega-Ojeda, G. Quintanilla, C. García-Ruiz and G. Montalvo, Introducing ATR-FTIR spectroscopy through analysis of acetaminophen drugs: Practical lessons for interdisciplinary and progressive learning for undergraduate students, J. Chem. Educ., 2021, 98, 2675–2686, DOI:10.1021/acs.jchemed.0c01231.
- S. Lilhare, S. B. Mathew, A. K. Singh and S. Sankarasubramanian, A simple spectrophotometric study of adsorption of Hg(II) on glycine functionalised magnetic nanoparticle entrapped alginate beads, Int. J. Environ. Anal., 2023, 103, 1917–1937, DOI:10.1080/03067319.2021.1884242.
- H. Ren, Z. Gao, D. Wu, J. Jiang, Y. Sun and C. Luo, Efficient Pb(II) removal using sodium alginate-carboxymethyl cellulose gel beads: Preparation, characterization, and adsorption mechanism, Carbohydr. Polym., 2016, 137, 402–409, DOI:10.1016/j.carbpol.2015.11.002.
- S. S. Chang, B. Clair, J. Ruelle, J. Beauchêne, F. D. Renzo, F. Quignard, G. J. Zhao, H. Yamamoto and J. Gril, Mesoporosity as a new parameter for understanding tension stress generation in trees, J. Exp. Bot., 2009, 60, 3023–3030, DOI:10.1093/jxb/erp133.
- A. Bhatnagar and I. Anastopoulos, Adsorptive removal of bisphenol A (BPA) from aqueous solution: A review, Chemosphere, 2017, 168, 885–902, DOI:10.1016/j.chemosphere.2016.10.121.
- S. H. Loh, M. M. Sanagi, W. A. W. Ibrahim and M. N. Hasan, Multi-walled carbon nanotube-impregnated agarose film microextraction of polycyclic aromatic hydrocarbons in green tea beverage, Talanta, 2013, 106, 200–205, DOI:10.1016/j.talanta.2012.12.032.
- L. Xu, Y. Li, J. Zhu and Z. Liu, Removal of toluene by adsorption/desorption using ultra-stable Y zeolite, Trans. Tianjin Univ., 2019, 25, 312–321, DOI:10.1007/s12209-019-00186-y.
- AOAC, Appendix F: Guidelines for Standard Method Performance Requirements, AOAC Official Methods of Analysis, 2019, vol. 4 Search PubMed.
Footnote |
| † Electronic supplementary information (ESI) available. See DOI: https://doi.org/10.1039/d4ra02720e |
| This journal is © The Royal Society of Chemistry 2024 |

